DOI: 10.12928/TELKOMNIKA.v15i2.6124 805
Prediction of Bioprocess Production Using Deep Neural
Network Method
‘Amirah Baharin*1, Afnizanfaizal Abdullah2, Siti Noorain Mohmad Yousoff3 Synthetic Biology Research Group, Faculty of Computing, Universiti Teknologi Malaysia,
81310 UTM, Johor, Malaysia
Corresponding author, e-mail: [email protected], [email protected], [email protected]
Abstract
Deep learning enhanced the state-of-the-art methods in genomics allows it to be used in analysing the biological data with high prediction. The training process of neural network with several hidden layers which has been facilitated by deep learning has been subjected into increased interest in achieving remarkable results in various fields. Thus, the extraction of bioprocess production can be implemented by pathway prediction in genomic metabolic network in eschericia coli. As metabolic engineering involves the manipulation of genes which have the potential to increase the yield of metabolite production. A mathematical model of this network is the foundation for the development of computational procedure that directs genetic manipulations that would eventually lead to optimized bioprocess production. Due to the ability of deep learning to be well suited in terms of genomics, modelling for biological network can be implemented. Each layer reveal the insight of biological network which enable pathway analysis to be implemented in order to extract the target bioprocess production. In this study, deep neural network has been to identify any set of gene deletion models that offers optimal results in xylitol production and its growth yield.
Keywords: Deep learning, deep neural Network, bioprocess production, metabolic engineering, gene deletion
Copyright © 2017 Universitas Ahmad Dahlan. All rights reserved.
1. Introduction
The development of bioprocess in the production of xylitol gives a huge contributions towards the industry. Xylitol is a sugar alcohol compound of great commercial interest with a number of applications. It has been widely used as a sweetener usually can found in any chewing gums or confectionary [1]. Furthermore, the consumption of xylitol in human body inhibits the growth of dental caries, promotes oral health [2-3] and sugar substitutes for diabetics [4]. Previously, xylitol has been produced by using hydrogenation process of xylose with the presence of methanation catalyst [5]. This process are highly costed which may lead to the limited amount of xylitol production. The advent of metabolic engineering offer potential opportunities to be applied in bioprocess production for the industrial needs. The use of microorganisms as the host strains are required to extract biological information by genetically engineered of its cellular metabolism. Several organisms has been tested to produce xylitol such as escherichia coli, yeast, bacillus subtilis and candida sp., However, escherichia coli has been used in this study as the capability in fast growing, produce wide range of related products and well understood in terms of metabolism has gain interest among the researchers [6].
However, the implementation of in silico genome-scale metabolic network in this research which is using flux balance analysis method consist of huge and unessential components. These factors may defect in bioprocess production and cell growth. Due to the size, complexity of metabolic networks and interaction between the components, it is difficult to determine the optimal gene knockout combination. The development of deep neural network opens up a great opportunities in solving this problems. Deep neural network able to learn complex pattern from the lower level to high level of architecture. Thus, representation of data which consist of high level of abstraction can be learned through complex computational model that consist of multiple processing layers. Thus, it helps in understanding abstraction and processing of the cells due to multiple levels of information provided. The biological structure in each layers can be inferred at multiple levels of resolution [8]. The extraction of bioprocess production in organisms can be done effectively due to the high level of accuracy of prediction. This can be done by predicting on several sets of deleted genes that obtain the most bioprocess production and growth yield. By the end of this study, the most convenience set of gene deletion is highly selected to extraction high amount of xylitol production.
The rest of this paper depicted as follows. In section 1, discussed on the application of bioprocess production and the use of metabolic engineering to extract target product. While in section 2 described the implementation of deep neural network in predicting the bioprocess product. In section 3 the expected results in the form of graphs are provided and brief explanation on experimental analysis. In the last section is about conclusion of this work.
2. Research Method
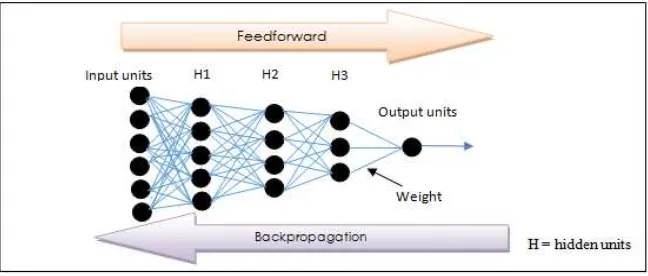
In this section firstly introduced the method which is deep neural network. The main architecture of deep neural network is presented in this section. Then, the experimental framework is elaborated for further understanding to generate output from deep neural network. Deep neural network is used to train the dataset to predict the bioprocess production especially and the growth rate of escherichia coli. are working with the presence of input data and directly calculated the output values throughout every layers of the network. The total input value generated from the layer below, xk are passed to each of hidden unit, k in the current layer by using logistic function at the scalar state yk. The interconnection are formed between input layer to the first hidden layer which are then will be directed to the next hidden layer and so forth until it reached to the output layer. Based on the interaction shown, it can be as a sort of topological structure.
(1)
Regarding to the formula above denoteas bias of unit k. Meanwhile, the value of l is the index of the unit below and is the weight that connecting unit k from unit l from the layer below [9]. The implementation of non-linearity into the whole network structure can be done by defining right architecture and using non-linear activation function. Basically, sigmoidal activation function is the common choices such as logistic function as shown in the equation above. The value of the output layer given by the last hidden layer depends on activation function that attain the supervised task given by the network [10].
(2)
During the learning process, the network is trained by back-propagation algorithm. The key insight in implementing backpropagation is to compute the gradient of objective function relative to the weight of multilayer stacking modules. The concept of backpropagation, in every weight of the input is used to calculate the gradient error. It can be done by straight fully propagate the error in backward manner. The propagation is started at the top to the bottom throughout all modules. This can be done by using the cost function to measure the discrepancy involved between the target and actual output of each training phases.
(3)
Where the cost function C is minimized by given a fixed training set of {(x(1), y(1)), … , x(T), y(T)), }.
The const function is done by calculating the corss-entropy within softmax output, p and target probabilities, d. In order to increase the network performance, the weight should be minimize after the calculation of the cost function takes place. This can be done by calculating the gradient of the cost function [11]. Afterwards the weights must be appropriately adjusted in obtaining weight optimization. The optimization is implemented by using mini batch stochastic gradient descent algorithm.
(4)
Where is the learning rate and the used of momentum coefficient can be further improved the
training method by a declaring 0 < α < 1 for smoothening the gradient of mini-batch, s. The value of weight must always be in the state of one to implement derivation of biases update rule. In order to get a clear view, Figure 1 shows the implementation of feedforward and backpropagation architecture.
Figure 1. Architectural view of deep neural network
2.2. Input Set Preparation and Experimental Framework
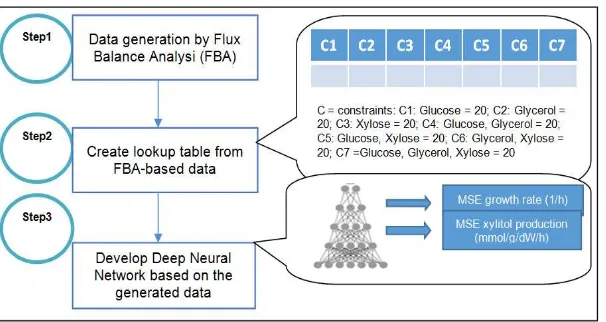
In this study, there are three steps involved as shown in figure 2. In order to generate the input data for deep neural network architecture, firstly a flux balance analysis (FBA) model is developed. FBA is a constraint-based methods which mathematically presents metabolic network of organism. It is relevance to genome-scale models as it permits better knowledge on
in vivo system that shows interplay among metabolic pathways. Besides, it is used to validate
wild-type organism of genome-scale metabolic model and metabolite characteristics using any additional conditions. The essential part of FBA is implementing gene knockout to predict the resulting phenotypic effects after the deletion takes place [12].The model created based on in
silico metabolic model of genome scale eschericia coli K-12 MG1655 reconstruction. Several
In the meantime for the second step, a number of lookup tables is constructed based on the three sets of gene deletion. The lookup tables are created based on the results of respected xylitol production and growth rate. There are about 7 column involved where each of it represents the consumption of glucose, glycerol and xylose alternately. The tables are made separately between xylitol production and growth rate. Meanwhile, step 3 can be implemented by inserting the data created based on the lookup table. The output after implementing deep neural network are calculated in term of mean squared error (MSE). The end results will predict respected xylitol production and growth rate based on the three set of deleted genes.
Figure 2. Schematics of the procedure used for determining the optimum neural network (h=hour; mmol=millimolar; g=gram; dW=dry cell weight)
3. Related Works
In this section elaborates about previous works which implementing deep neural network to improve the prediction of complex pattern in biological information. As deep neural network shows a huge success as it is implemented in many applications over state-of-the-art machine learning methods.
3.1. Prediction of Lung Tumors
Based on the study of lung tumours [13], proposed a combination of deep neural network and fuzzy logic method. The aim of this study is to predict fractional variations including intra- and inter- sides of several patients which suffer tumour movement related to respiration. Previously, there are several problems arise where the fractional variations are hardly mathematized. Furthermore, the movements are hardly predicted as inconstant variation takes place and taking longer computational time to process the results. Thus, this method allows high accuracy in predicting the movement and takes lower computational times. The value of root mean square error (RMSE) is used as a benchmark in the proposed method as it overshoots with existing methods from 29.98% into 70.93%.
3.2. Compound Protein Interaction Prediction
3.3. Enhancer Prediction- Deep Neural Network (EP-DNN)
Based on the study conducted Seong et al., [15] deep neural network has been used in order to predict the locations of enhancer in gene expression. Basically, short DNA sequence which is known as enhancer, modulate the patterns generation in gene expression. In order to predict the location of enhancer, modification of histone combinatorial codes are required. However, current computational methods suffer from lack interpretation of obtainable results in order to choose biological significant modification of histone and low prediction accuracy. The implementation of EP-DNN improved the enhancer prediction accuracy by having more than 90% validation rates in identifying operational region. Furthermore, this study uncovers the variation of essential modification of histone between different cells and identify either the proximal or distal features are important.
4. Results and Analysis
The performance of the three dataset has been tested in order to predict the optimal results for the respected xylitol production and growth rate in escherichia coli model. The number of learning rates has been adjusted in order to get the lowest value of RMSE in order to choose the most accurate result on the deleted genes. To compare the performance of the model, several graphs have been generated respected to fine-tuning values of learning rates and epochs.
4.1. In Silico Genome-Scale Metabolic Model Analysis
The escherichia coli model iJO1366 in system biology markup file is imported into FBA
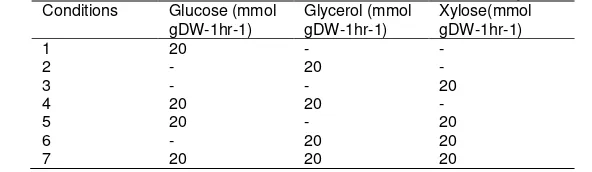
to get the respected growth rate and xylitol production of the organisms. Furthermore, gene deletion has been implemented to predict the effect towards the production of the target metabolites. The main structure of the model made up of stoichiometric coefficient with complete sets of biochemical reactions between substrates and products. Constraints value is then be applied to predict the flux distribution of mutant strain that undergo gene knockout creating a smaller feasible solution space. M9 minimal media has been used in this study and alternate used of glucose, glycerol and xylose as carbon source uptake.Table 1 shows the consumption of the constraints between glucose, glycerol and xylose in the metabolic model correspondingly. Optimal flux distribution will be identified within the new solution space.
Table 1. Conditional probabilities for the uptake rate of glucose, glycerol and xylose Conditions Glucose (mmol
Figure 3. Metabolic pathway for the deletion of of i) rpi genes, ii) pgi, eno, mgsa genes and iii) rpi, pgi, eno and mgsa genes for xylitol production
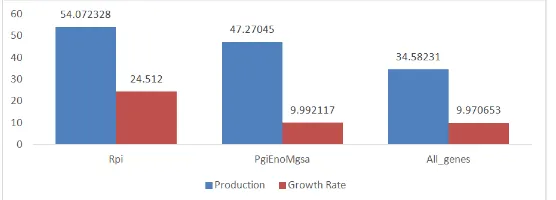
Based on the results shown in Figure 4, there are three sets of gene deletion from the model. The resultant values showing ribose-5-phosphate isomerase (rpi) gives higher production of xylitol and growth rate by average of 54.07237 and 24.51196 respectively. Meanwhile the second sets of deletion involving the deletion of pgi, eno and mgsA genes gives lower value of xylitol production by mean of 47.27046 while the average growth rate is 9.9921. However, in the last sets involving combination of the other two sets of gene deletions shows lowest results with the average of 34.58231 and 9.970653 of respected xylitol production and its growth rate. Besides, it can be seen that almost 60% of the cell growth has been used up to maximize xylitol production in the model which is quite high for the deletion between pgi, eno, mgsA and rpi, pgi, eno and mgsA genes.
Figure 4. Xylitol production (mmol gDW-1hr-1) and growth rate (hr-1) of the three deleted genes model in escherichia coli
4.2. Evaluating the Training Error
The deep neural network are trained using the dataset based on the results generated from the in silico metabolic model analysis. There are 6 three types of dataset which have been used in this study that including the xylitol production and respected growth rate for each type of deleted genes. The experimental simulation has been implemented based on different number of learning rates according to the range of 0.1-0.9 and 0.01-0.09. The choice which has been made was purely done on the arbitrary basis. These simulations have been implemented in order to compare the performance based on the three models involved. However, the most optimal learning rates are chosen to examine which set of gene deletion that gives the highest value especially for xylitol production and also the cell growth.
Figure 5. MSE of deleted genes in i) rpi, ii) pgi,eno,mgsA and iii) all genes for the learning rate 0.01 at epochs 350
In the first experimental result as shown in figure 5 the training of deep neural network involved the learning rate 0.01. The result at this point can be considered as one of the best value for MSE compared to the other learning rate between 0.01 until 0.09. The deletion of rpi shows the lowest value of MSE for xylitol production wich is 1.498066 compared to the other training models. However, the highest value of MSE for the deletion of pgi, eno and mgsA genes which is 1.991501. The difference of MSE between the deletion of rpi and pgi, eno, mgsA is 0.493435. Meanwhile, the value of MSE for the growth rate is higher as compared to the production of xylitol. The deletion of all genes shows the lowest value for MSE which is 1.529821.Whereas the highest MSE for growth rate takes place when the pgi, eno and mgsA genes are deleted from eschericia coli model. Based on this situation, rpi is considered the most potential gene to be deleted in order to increase the value of xylitol production. This is due to the lowest error obtained from the trainng involved in deep neural network. Regarding to the result shown in previous section, where the simulation of flux balance analysis has been implemented.It can be seen that xylitol production for rpi deletion is at 54.07237 mmol gDW-1hr-1 which is the highest value compared to the other gene deletion models. Furthermore, the value of growth rate can be considered as optimal result which is at 24.512 hr-1. Even though there is slight difference of prediction during the training process in deep neural network for the growth rate, however eschericia coli model are still can survived in order to extract xylitol production.
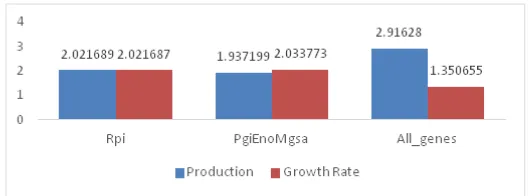
The second experimental analysis, the performance of the gene deletion models has been assessed by training the deep neural network architecture with learning rate 0.1 until 0.9. However, only the best MSE result has been presented in this paper. Based on figure 6, at the learning rate 0.1 can be considered as the best results of MSE. The deletion of pgi, eno, mgsA genes model shows the best results in terms of MSE due to the lowest value of error for xylitol production which is 1.937199 compared to the other models. In contrast, all gene deletion models obtained the highest MSE which is 2.91628. The difference between the lowest and the highest value of MSE for these two models took about 0.979081. On the other hand, the prediction of MSE for growth rate is slightly different compared to the results obtained for xylitol production. This is due to the all gene deletion model obtained the lowest value of MSE compared which is 1.350655. The highest MSE is at the deletion of pgi, eno, mgsA genes where the MSE is 2.03373. The difference of the error is quite higher which is 0.72718. The prediction which has been calculated in this second experimental analysis is completely different based on the results obtained from flux balance analysis simulation. However, the rpi gene deletion model can be considered as the optimal results since it does not obtained the highest error value for both situations.
These two experimental analyses perform different behavior in terms of error prediction due to the different lowest value of MSE with respected to the gene deletion models. Generally, in the first experimental analysis, the lowest MSE prediction involved in the deletion of rpi which is 1.498066 for xylitol production. In contrast, for the second experimental analysis obtained about 1.937199 error prediction for the production of xylitol when pgi, eno, mgsA genes are deleted from escherichia coli model. However, in terms of the growth rate based on these two models rpi still shows the most optimal value of MSE compared to the pgi, eno, and mgsA gene deletion model into its respective cases. Based on the experimental simulation, it can be found that small learning rates produced better and consistent results in predicting xylitol production and growth rate. In contrast, large learning rate produced inconsistent results.
5. Conclusion
The modeling and simulation of genome scale metabolic models have effectively played an important role in aiding the metabolic engineering, especially for improvement of bioprocess production. The use of in silico genome-scale metabolic model analysis allows the identification of identify the essential genes that able to form a minimal genome without degrading the biological function. In terms of biological validation, the in silico results obtained show the conflict between the metabolites production and the growth rate of the microorganism where higher production can be obtained with a lower growth rate and vice-versa. Using the capability of deep neural network, it has been successfully identified the optimal gene knockout strategy to improve the production of desired bioprocess production for such xylitol production. The result presented in this research predict the most optimal value for xylitol production and respected growth rate. It has been noted that for many deep neural network examined the lowest xylitol production errors occurred at the lowest learning rate. For these cases, learning rate 0.01 has been chosen as the best learning rate in order to obtain the optimal solutions. The best performance for the gene deletion model is rpi since the value of error is at the lowest point for the production of xylitol and low error in terms of growth rate. It is quite interesting to note that for all learning rate which has been tested performs the best in terms of prediction analysis at 350 epochs.
Acknowledgements
This project was supported by Malaysian Ministry of Higher Education (MOHE), managed by Universiti Teknologi Malaysia Research Management Centre (RMC) under Fundamental Research Grant Scheme (FRGS) vote number R.J130000.7828.4F481.
References
[2] Cirino PC, Chin JW, Ingram LO. Engineering Escherichia coli for xylitol production from glucose‐xylose mixtures. Biotechnology and bioengineering. 2006; 95(6): 1167-76.
[3] Emodi A. Xylitol: its properties and food applications. Food Technology. 1978. [4] Pepper T. Xylitol in sugar-free confections. Food Technol. 1988; 10: 98-106.
[5] Kim JH, Han KC, Koh YH, Ryu YW, Seo JH. Optimization of fed-batch fermentation for xylitol production by Candida tropicalis. Journal of Industrial Microbiology and Biotechnology. 2002; 29(1): 16-9.
[6] Khankal R, Chin JW, Cirino PC. Role of xylose transporters in xylitol production from engineered Escherichia coli. Journal of biotechnology. 2008; 134(3): 246-52.
[7] Price ND, Papin JA, Schilling CH, Palsson BO. Genome-scale microbial in silico models: the constraints-based approach. Trends in biotechnology. 2003; 21(4): 162-9.
[8] Kotsiantis SB. Supervised Machine Learning: A Review of Classification Techniques. Informatica. 2007; 31: 249-68
[9] Hinton G, Deng L, Yu D, Dahl GE, Mohamed AR, Jaitly N, Senior A, Vanhoucke V, Nguyen P, Sainath TN, Kingsbury B. Deep neural networks for acoustic modeling in speech recognition: The shared views of four research groups. IEEE Signal Processing Magazine. 2012; 29(6): 82-97. [10] Larochelle H, Bengio Y, Louradour J, Lamblin P. Exploring strategies for training deep neural
networks. Journal of Machine Learning Research. 2009; 10(Jan): 1-40.
[11] Qian Y, Fan Y, Hu W, Soong FK. On the training aspects of deep neural network (DNN) for parametric TTS synthesis. In2014 IEEE International Conference on Acoustics, Speech and Signal Processing (ICASSP). 2014; 4: 3829-3833.
[12] Antoniewicz MR, Kraynie DF, Laffend LA, González-Lergier J, Kelleher JK, Stephanopoulos G. Metabolic flux analysis in a nonstationary system: fed-batch fermentation of a high yielding strain of E. coli producing 1, 3-propanediol. Metabolic engineering. 2007; 9(3): 277-92.
[13] Park S, Lee SJ, Weiss E, Motai Y. Intra-and Inter-Fractional Variation Prediction of Lung Tumors Using Fuzzy Deep Learning. IEEE journal of translational engineering in health and medicine. 2016; 4: 1-2.
[14] Tian K, Shao M, Zhou S, Guan J. Boosting compound-protein interaction prediction by deep learning. In Bioinformatics and Biomedicine (BIBM), 2015 IEEE International Conference on. 2015: 29-34. [15] Kim SG, Theera-Ampornpunt N, Grama A, Chaterji S. Interpretable deep neural networks for