FUNCTION OF SOME ECOSYSTEM COMPONENTS
AT NATURAL FOREST AND CACAO
AGROFORESTRY SYSTEMS AT THE MARGIN OF
LORE LINDU NATIONAL PARK,
CENTRAL SULAWESI
BY:
TRIADIATI
DEPARTEMENT OF BIOLOGY
THE POST GRADUATE SCHOOL
BOGOR AGRICULTURAL UNIVERSITY
This is to verify that my dissertation entitled: Function of Some Ecosystem Components at Natural Forest and Cacao Agroforestry Systems at the Margin of Lore Lindu National Park, Central Sulawesi is my own work and never been submitted to any institution before. All of the incorporated data and information are valid and stated clearly in the text, and listed in the references.
Bogor, August 2008
ABSTRACT
TRIADIATI
.
Function of Some Ecosystem Components at Natural Forest and Cacao Agroforestry Systems at the Margin of Lore Lindu National Park,Central Sulawesi. Under direction of SUKISMAN TJITROSEMITO, EDI
GUHARDJA, SUDARSONO, IBNUL QAYIM
Cacao agroforestry is a traditional form of agriculture practiced by the people of Central Sulawesi. These agroforestry systems vary from a simple system, following selective cutting of forest trees, to a more sophisticated planting design. The aims of this research were (1) to determine litterfall dynamics, leaf-litter decomposition, and fine root biomass, (2) to determine active fraction on soil macro-organic matter (SOM) in natural forest and cacao agroforestry systems, and (3) to assess nitrogen resorption and nitrogen use efficiency (N NUE) and implication for cacao establishment.
The field studies were conducted in three types of cacao agroforestry systems at the northeastern margin of Lore Lindu National Park (LLNP). Field study sites covering in natural forest (NF) and in three cacao agroforestry systems that is cacao was planted under remaining forest cover (CF1), under planted trees (CF2), and between shade trees Gliricidia sepium (CP). The parameters are nitrogen soil content, fine root biomass, soil macro-organic matter by size and density fractionation, soil surface organic layer by quadrant, litterfall production by litter trap, and rate of decomposition by litter bag, nitrogen use efficiency in cacao plant and ecosystem scale, and nitrogen resorption.
The results shown that the greatest litterfall production was recorded in the NF with the fastest rate of decomposition. Among cacao agroforestry systems, the CP produced the greatest litterfall, but the rate of decomposition was lower than that of the CF1. Leaf-litter was predominant litter component compared to the other components (woody litter and reproductive parts) in all study sites. The monthly litterfall in NF and cacao agroforestry systems were influenced by climate. The rate of leaf-litter decomposition was done in two periods, which revealed a different pattern. Fine roots biomass in the natural forest was higher than those of cacao agroforestry systems. Fractionation of soil macro-organic matter resulted three fractions with the order of total fractions as followed intermediate fraction (MF) > heavy fraction (HF) > light fraction/active fraction (LF). The percentage of LF in the natural forest was lower than those of in the cacao agroforestry systems. The carbon organic and nitrogen content in the LF in the natural forest was higher than those of cacao agroforestry systems. Among cacao agroforestry system, the organic carbon and nitrogen content in the LF was the highest in the CF2. The dry weight of LF-SOM was influenced by amount of litterfall and rate of decomposition. Nitrogen resorption and nitrogen use efficiency in cacao plant (N NUEC) were not
significantly different among three cacao agroforestry systems. Nitrogen use efficiency in four different ecosystems (N NUEEs) showed that ecosystem CP was
significantly lower than those the three ecosystems.
It can be concluded that land use change from natural forest to cacao agroforestry systems would influence ecosystem function. Cacao agroforestry system under CF1 and CF2 are able to maintain ecology performance and biodiversity similar to natural forest.
Agroforestri Kakao pada Pinggir Batas Taman Nasional Lore Lindu, Sulawesi
Tengah. Di bawah bimbingan SUKISMAN TJITROSEMITO, EDI GUHARDJA,
SUDARSONO, IBNUL QAYIM
Komoditi kakao banyak ditanam di Sulawesi Tengah dalamsistem agroforestri dan merupakan perkebunan yang dikelola rakyat. Sistem agroforestri kakao yang ada beragam, dari bentuk penanaman diantara vegetasi hutan hingga ditanam dengan pola tanam yang seragam. Penelitian ini bertujuan (1) menentukan dinamika produksi serasah, menghitung laju dekomposisi dan dinamika fine root; (2) menentukan ‘active fraction’ dalam bahan makro-organik tanah di hutan alam dan agroforestry kakao; (3) menghitung resorpsi nitrogen pada tanaman kakao dan efisiensi penggunaan nitrogen.
Penelitian dilakukan berlokasi di sebelah barat tepi Taman Nasional Lore Lindu, Sulawesi Tengah. Empat tipe pemanfaatan lahan yang digunakan sebagai lokasi penelitian meliputi hutan alam (NF) dan tiga tipe sistem agroforestri kakao yaitu kakao ditanam di bawah vegetasi hutan (CF1), ditanam di bawah tanaman lokal (CF2) dan ditanam di bawah Gliricidia sepium (CP). Parameter yang diamati adalah kandungan N tanah, fine root, bahan makro-organik tanah (BOT) dengan metode size and density fractionation, lapisan bahan organik di atas tanah, produksi serasah dengan metoda jaring serasah, laju dekomposisi dengan metoda kantong serasah, efisiensi pemanfaatn nitrogen pada tanaman kakao (N NUEC) dan skala
ekosistem (N NUEEs), dan resorpsi N.
Hasil penelitian menunjukkan bahwa dari empat tipe pemanfaatan lahan, NF menghasilkan serasah tertinggi dengan laju dekomposisi tercepat. Diantara agroforestri kakao, kakao yang ditanam di CP menghasilkan serasah terbanyak tetapi laju dekomposisinya lebih rendah dari pada kakao di lokasi CF1. Daun merupakan komponen serasah terbanyak dibanding komponen serasah lainnya. Produksi serasah perbulan berfluktuasi dan dipengaruhi oleh iklim setempat. Laju dekomposisi serasah daun yang dilakukan pada dua periode yang berbeda mempunyai pola yang berbeda pula. Berat kering biomassa fine root pada NF lebih tinggi daripada agroforestri kakao. Fraksionasi BOT diperoleh tiga fraksi dengan urutan berat kering yaitu fraksi sedang (MF)>fraksi berat (HF)>fraksi ringan/active fraction (LF). Persentase LF pada NF lebih rendah daripada agroforestri kakao. Karbon organik dan N pada LF di NF lebih tinggi dibanding pada agroforestri kakao. Di antara agroforestri kakao, CF2 mempunyai kandungan C-organik dan N tertinggi. Berat kering LF berkorelasi positif dengan produksi serasah dan laju dekomposisi. Resorpsi dan N NUEC tidak menunjukkan perbedaan yang signifikan
pada ketiga agroforestri kakao. Tetapi N NUEES pada empat ekosistem yang
berbeda menunjukkan bahwa ekosistem CP mempunyai efisiensi lebih rendah dan berbeda secara signifikan dengan tiga ekosistem lainnya.
Disimpulkan bahwa perubahan pemanfaatan lahan dari hutan alam menjadi sistem agroforestri kakao akan mempengaruhi fungsi ekosistem. Agroforesri kakao pada CF1 dan CF2 merupakan tipe agroforestri yang layak untuk di pertahankan karena mempunyai kemiripan dengan hutan alam.
SUMMARY
TRIADIATI
.
Function of Some Ecosystem Components at Natural Forest and Cacao Agroforestry Systems at the Margin of Lore Lindu National Park,Central Sulawesi. Under direction of SUKISMAN TJITROSEMITO, EDI
GUHARDJA, SUDARSONO, IBNUL QAYIM
Cacao agroforestry is a traditional form of agriculture by the people of Toro village, Central Sulawesi. These agroforestry systems vary from a simple system, by taking the system of selective cutting of forest trees, to a more sophisticated planting design.
The aims of this research were (1) to determine litterfall dynamics, leaf-litter decomposition, and fine root biomass in natural forest and cacao agroforestry systems; (2) to determine active fraction on soil macro-organic matter (SOM) and to know relation of litterfall as an input of organic matter in soil with SOM; (3) to assess nitrogen resorption and nitrogen use efficiency (N NUE). The field studies were conducted in three different types of cacao agroforestry systems at the northeastern margin of Lore Lindu National Park (LLNP), which is located in Central Sulawesi, Indonesia ca. 75 km southeast of Palu. The whole site is located at an elevation of 800 m to 1100 m in Toro village, Kulawi district, Central Sulawesi, Indonesia. The experiment began in March 2005 and ended in March 2006. Field study sites covering in natural forest (wana-NF as an undisturbed ecosystem) and in three cacao agroforestry systems were pahawa pongko 1-CF1,
pahawa pongko 2-CF2; and huma-CP. Plot size was 30 m x 50 m in every study site. The topography of study sites varied with the different slope. Each plot was divided into 20 subplots, where soil, fine root, soil macro-organic matter, and soil surface organic layer samples were taken. Litterfall production was collected monthly intervals from 10 traps in each plot for one year. The rate of decomposition was evaluated by using the litter bag technique. The amount of soil macro-organic matter was analyzed by using size and density fractionation method. Fractions of soil macro-organic matter were fractionated in silica suspensions (LUDOX solution). Quality of soil macro-organic matter was determined with nitrogen, and organic carbon content.
(0.45 g) and CP (0.63 g) were similar and higher than CF1 (0.26 g). The nitrogen released in first period under NF (0.05 g) differed significantly and higher than CF1 (0.02 g), CF2 (0.02 g) and CP (0.03 g).The nitrogen released in second period was quite similar in NF (0.008 g) and cacao agroforestry systems (0.009 g, 0.009 g, 0.01 g respectively). Fine roots biomass dry weight in the natural forest was higher than those of cacao agroforestry systems and was influenced by amount of soil surface litter.
Fractionation of soil macro-organic matter with size and density fractionation method resulted three fractions with the order of total fractions as followed intermediate fraction (MF) > heavy fraction (HF) > light fraction (LF). The total soil macro-organic matter decreased with increasing of land use intensity. The carbon organic and nitrogen content in the LF in the natural forest was higher than those cacao agroforestry systems. Among cacao agroforestry system, the organic carbon and nitrogen content in the LF was the highest in the cacao agroforestry CF2 (pahawa pongko 2). The dry weight of LF-SOM was correlated by amount of litterfall and rate of decomposition.
Nutrient resorption is a process in which nutrients are withdrawn from leaf prior abscission and redeployed in developing tissues. The resorption of nutrients prior to abscission is one of the key process by which plants conserve. Nitrogen resorption and nitrogen use efficiency in cacao plant (N NUEC) were not
significantly different among three type cacao agroforestry. Nitrogen use efficiency in four different ecosystems (N NUEEs) showed that ecosystem cacao agroforestry
CP (huma) was significantly lower than those the three ecosystems. Nitrogen use efficiency in ecosystem presented nitrogen sufficiency of land for plant growth.
Copyright © 2008, Bogor Agricultural University All Right Reserved
1. It is prohibited to cite all or part of this dissertation without referring to and mentioning the source.
a. Citation only permitted for the sake of education, research, scientific writing, report writing, critical writing or reviewing scientific
problems.
b. Citation does not inflict the name and honor of Bogor Agricultural University.
AGROFORESTRY SYSTEMS AT THE MARGIN OF
LORE LINDU NATIONAL PARK,
CENTRAL SULAWESI
TRIADIATI
A dissertation submitted to fulfill one of the requirements for the
Doctorate Degree at the Study Program of Biology,
Post Graduate School, Bogor Agricultural University,
DEPARTEMENT OF BIOLOGY
THE POST GRADUATE SCHOOL
BOGOR AGRICULTURAL UNIVERSITY
Examiner of first examination:
Prof. Dr. Ir. Cecep Kusmana, MSc.
Department of Silviculture, Faculty of Forestry, Bogor Agricultural University
Examiner of second examination: 1. Prof. Dr. Andry Indrawan, MS.
Department of Silviculture, Faculty of Forestry, Bogor Agricultural University
2. Dr. Kuswata Kartawinata
Herbarium Bogoriense, Botany Division, Research Centre for Biology, Indonesian Institute of Science Bogor.
UNESCO Office, Jakarta, Indonesia.
Name of student : Triadiati Number of student : G 361030021 Study Program : Biology
Certified by
Supervisor Committee
Dr. Soekisman Tjitrosemito,MSc. Prof. Dr. Ir. Edi Guhardja, M.Sc. (Chairman) (Member)
Prof.Dr. Ir. Sudarsono, M.Sc. Dr. Ir. Ibnul Qayim (Member) (Member)
The Biology Study Program Post Graduate School
Dr. Ir. Dedy Duryadi Solihin, DEA. Prof. Dr. Ir. Khairil Anwar Notodiputro, MS. (Head) (Dean)
FOREWORD
Many thanks to Allah SWT for blessing me to finish this dissertation “Function of Some Ecosystem Components at Natural Forest and Cacao Agroforestry Systems at the Margin of Lore Lindu National Park, Central Sulawesi”.
Chapter VI – Nitrogen Resorption and Nitrogen Use Efficiency in Cacao Agroforestry Systems Managed Differently in Central Sulawesi - was published in HAYATI Journal Biosciences (December 2007:127-132). A part of chapter IV and V were presented in Summer School Program in Göttingen, Germany (2005) and STORMA Stakeholder Workshop, Jakarta (2008).
Many people have supported my study in many different ways. I wish to acknowledge my sincere gratitude and appreciation to Dr. Sukisman Tjitrosemito, MSc. As my promoter and Chairman of the advisory committee, for supervising, directing advising, help continuously during preparation, fieldwork, data evaluation and interpretation, and reading critically the manuscript. To Prof. Dr. Ir. Edi Guhardja, MSc., Prof. Dr. Sudarsono, MSc. and Dr. Ir. Ibnul Qayim for their continued encouragement, support and advise during doing research and writing up of the manuscript. Profound gratitude and thanks to Prof. Dr. Christoph Leuschner from the University of Göettingen (Germany) through review of the manuscript, advice, encouragement, guidance, trust and support for this research until this study was completed. Also thanks to Head of Biology Department, FMIPA, IPB permitted to use laboratories during data analysis.
project in Palu for their support.
I owe my sincere gratitude to Dr. Marieke Harteveld for a part litterfall data. Dr. Merijn Bos is thanked for statistical assistance. I would like to thank to Dr. Nunik Sri Aryanti,MSi. for her advices, supports, and discussions during fieldwork and writing up this manuscript. Subari (LIPI) is thanked for assistance in drawing profile diagram in forests and cacao agroforestry. Edi, Baswan, and Sakir, on behalf of all my strong and reliable field assistant team. My special thanks also go to the village heads of Toro and to Rajab who deserves exceptional gratitude for his responsible housekeeping and delicious cuisine in Toro.
CURRICULUM VITAE
TRIADIATI was born on 24 February, 1960 in Surabaya (East Java), a third daughter from five children from father Sarlan Adisutjipto and mother Soetarwi. The Faculty of Biology, Gadjah Mada University in Yogyakarta, was institution she had chosen for study. She became a student in 1979 and graduated in 1984.
Since 1986 she worked at Diponegoro University, Semarang until 1998 as a lecturer. She attended a research Program in Center of Inter University at Bandung Technological Institute for one and a half year in 1988-1990. In 1991, she began to study in Agronomy Department, Post Graduate Program at Bogor Agricultural University. She graduated in Master of Sciences (MSi.) in 1994. Since 1998 she has been working at Biology Department, Bogor Agricultural University as a lecturer.
In 2003, she enrolled Bogor Agricultural Institute in the Biology Department for her doctorate program, which is funded by BPPS Scholarship from The Indonesian Government through The Directorate General of Higher Education, Department of National Education, Republic of Indonesia with research facilities from STORMA.
She has actively participated in several International and National symposiums, such as Summer School Program in Göttingen, Germany (2005) funded by DAAD (German Academic Exchange Service) and BMBF (Bundesministerium für Bidung und Forschung). In 2008, she participated in STORMA Stakeholder Workshop organized by Indonesian Institute of Sciences (LIPI) and STORMA.
TABLE OF CONTENTS..………... xiv
Litterfall production and decomposition………. 4
Soil organic matter……….. 6
Nitrogen use efficiency (N NUE)……… 9
III STUDY AREA AND STUDY SITES Introduction………. 16
Climate……… 17
Study sites……… 18
IV LITTERFALL, LEAF-LITTER DECOMPOSITION AND, FINE ROOT PRODUCTION IN NATURAL FOREST AND CACAO AGROFORESTRY Introduction……….. 25
Material and methods ……….. 29
Results ………. 32
Discussions..………. 45
Conclusions……….. 50
V SOIL MACRO-ORGANIC MATTER IN NATURAL FOREST AND CACAO AGROFORESTRY SYSTEMS
VI NITROGEN RESORPTION AND NITROGEN USE EFFICIENCY IN CACAO AGROFORESTRY SYSTEMS MANAGED DIFFERENTLY Introduction……….. 60
Material and methods ………. 63
Results ………. 65
Conclusions………. 72
VII GENERAL DISCUSSIONS..……….. 73
VIII GENERAL CONCLUSIONS ……… 77
RECOMMENDATION ………. 78
REFERENCES……… 79
LIST OF TABLES
Number Page
3.1. Environmental information in the natural forest (NF) and cacao agroforestry systems (CF1, CF2, and CP) in Toro village,
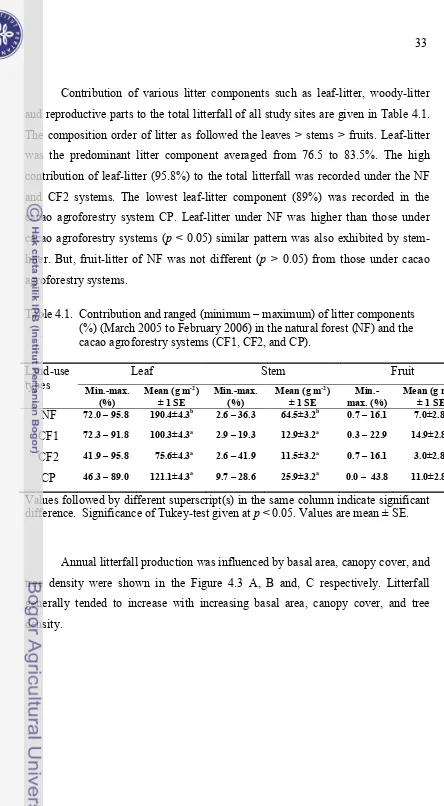
Central Sulawesi ...………... 24 4.1. Contribution and ranged (minimum – maximum) of litter
components (%) (March 2005 to February 2006) in natural forest (NF) and cacao agroforestry systems (CF1, CF2, and CP)…….. 33
4.2. Regression and correlation of exponential curve of leaf-litter mass remaining (%) with time of incubation in leaf-litter
decomposition... 38
4.3. Leaf-litter mass remaining and decay-rate coefficient (k) in the natural forest (NF) and cacao agroforestry systems
(CF1, CF2, and CP)... 39 4.4. The percentage of carbon, nitrogen and C/N ratio leaf-litter
in the initial and the end of leaf-litter decomposition……… 40 4.5. Fine roots biomass sampled from four different land use types
(NF, CF1, CF2, and CP)... 43
5.1. The dry weight of soil macro-organic matter fractions and their fractions in various land use types... 55
6.1. Mean of annual litterfall, cacao foliar N, N resorption, soil N content, and N NUECin the cacao agroforestry systems... 65
6.2. Nitrogen use efficiency (N NUEEs) in natural forest (NF) and
LIST OF FIGURES
4.1. Monthly litterfall in natural forest (NF) and the cacao agroforestry systems (CF1, CF2, and CP)………. 32
4.2. Annual litterfall in the natural forest (NF) and cacao agroforestry Systems (CF1, CF2, and CP)………. 32
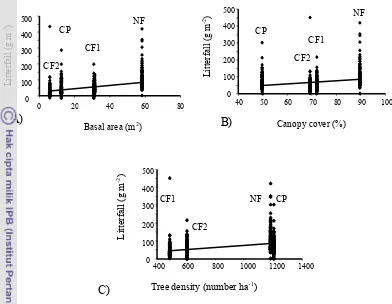
4.3. Litterfall in natural forest (NF) and cacao agroforestry systems (CF1, CF2, and CP) in relation to basal area, canopy cover, and tree density... 34
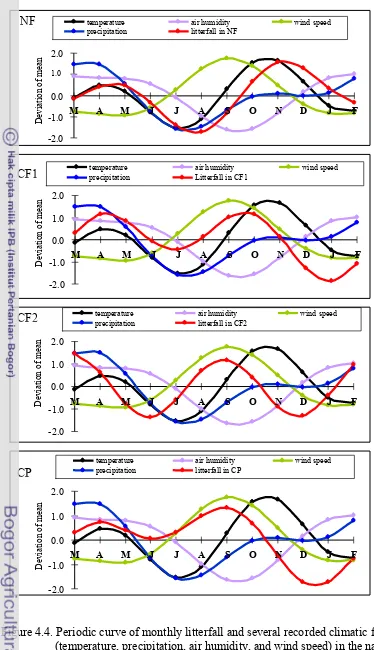
4.4. Periodic curve of monthly litterfall and several climatic factors in the (NF) natural forest and cacao agroforestry systems (CF1, CF2, and CP)... 35
4.5. Annual soil surface litter in the natural forest (NF) and cacao agroforestry systems (CF1, CF2, and CP)... 36
4.6. Exponential curve of leaf-litter mass remaining in two period decomposition in the natural forest (NF) and cacao agroforestry systems (CF1, CF2, and CP) ……….. 37
4.7. The amount of carbon and nitrogen released in two periods decomposition in natural forest (NF) and cacao agroforestry systems (CF1, CF2, and CP)... 41
4.8. Seasonal distribution of fine roots biomass in natural forest (NF) and cacao agroforestry systems (CF1, CF2, and CP)... 42
4.9. Annual fine roots biomass under different land use types... 43
4.10. The relationship of fine roots biomass with in relation to soil surface litter in the Natural forest (NF) and cacao agroforestry systems (CF1, CF2, and CP)... 44
6.1. Cacao foliar nitrogen (%) in relation to temperature (C) and canopy cover (%) in cacao agroforestry systems... 66 6.2. Cacao foliar N (%) in relation to N soil content (mg kg-1) in the
cacao agroforestry systems (CF1, CF2, and CP)... 66 6.3. Nitrogen resorption (%) in relation to soil N content (mg kg-1) in
the cacao agroforestry systems (CF1, CF2, and CP)... 67
6.4. Nitrogen use efficiency of cacao (N NUEc) in relation to soil nitrogen content (g kg-1) in the cacao agroforestry systems
(CF1, CF2, and CP)... 68 7.1. Hierarchical cluster analysis of among four land-use change in
LIST OF APPENDICES
Number Page
1. Profile diagram of natural forest………. 99
2. Profile diagram of cacao agroforestry CF1………. 100
3. Profile diagram of cacao agroforestry CF2..……….. 101
Research background
Indonesia is one of the major tropical rainforest areas worldwide, with 10% of the world’s rainforest area and nearly 50% of Asia’s remaining tropical rainforest, but Indonesia also has one of the highest deforestation rates worldwide, 1.17% annually in the last decade. The most important factor causing deforestation in Indonesia is expansion of agriculture (FAO 2001). Deforestation has often been evaluated from the rainforest conservation perspective. However, large human rural communities depend on agriculture in rainforest margin areas. According to Lanly (1985) slash and burn agriculture worldwide sustains the livelihood of estimated 500 million people, most of them in tropical and subtropical areas. Therefore studies on forest margin stability should not only focus on forest conservations but also on potentials and sustainability of agricultural practices in rainforest conversion areas (Dechert 2003). South East Asia and especially some regions on the Indonesian archipelago including Central Sulawesi were identified as areas of particularly high deforestation rates (Archard et al. 1998, Drigo 2004).
An agroforestry system such as shade-grown cacao (Theobroma cacao) is one alternative of land use systems to slash-and-burn agriculture and is recommended for sustainable development in the humid tropics (Johns 1999). Although cacao has also been linked to deforestation (Ruf 1998), the link depends on certain conditions such as the suitability of cleared land for cacao, property rights, labor availability, and whether farmers capture forest area by planting cacao or substituting other shifting cultivation practices (Vosti et al. 2003). Because cacao is shade-tolerant and can grow under a canopy of trees maintained, regenerated, or replanted from the traditional tropical forest (Beer et al. 1998), its inclusion as a component of a forest agro-ecosystem can maintain biodiversity and ecological services provided by the native forest (Glor et al. 2001, Rice and Greenberg 2000).
organic matter and energy to soil, and it is important for nutrient cycling in ecosystem. Changes in soil management practices influence the amount, quality and turnover of soil organic matter. Soil organic matter is a key of nutrients for plant growth.
The changes in vegetation structure from natural forest to agroforestry systems may not only lead to changes in quantity and composition of litter, but also to the other ecosystem properties (e.g. soil microclimate, Vetaas 1992; and nutrient return, Kochy and Wilson 1997) that could influence ecosystem function (Sangha et al. 2006).
Lore Lindu National Park (LLNP), Central Sulawesi, Indonesia was chosen as the focus of this study. It is the most important protected areas in Indonesia and was declared as a “Biosphere Reserve” in 1978. Biosphere reserves were conceived as “experimental sites for sustainable development, research, and monitoring on ecosystems and conservation of biodiversity”, and are at the same time meant to ”promote well being of local people who live in and around the reserve” (UNESCO 1995). Generally, habitats in the interior of LLNP are still relatively less disturbed, but some areas of the park have been converted to agricultural land and in several locations plantations of coffee and cacao have transgressed the park boundary.
The Toro community is one of the indigenous groups (“Ind.: masyarakat adat”) living around LLNP by planting mostly cacao. Changes in land use under LLNP, particularly in Toro village, into cacao agroforestry systems may change ecosystem function.
Objectives
1. To determine litterfall dynamics, leaf-litter decomposition, and fine root biomass in the natural forest and cacao agroforestry systems.
2. To determine active fraction on soil macro-organic matter (SOM) in the natural forest and cacao agroforestry systems.
3. To assess nitrogen resorption and nitrogen use efficiency (N NUE) in cacao agroforestry systems.
Hypotheses
The hypothesis of the research is that the land use change has an impact on ecosystem characteristic, which includes changes in the litterfall production, the rate of litter decomposition, active pool content in SOM, the soil nitrogen content, the biomass of fine root, the cacao foliar nitrogen content, the nitrogen resorption, and N NUE; also its implication to cacao establishment.
Expected results
II. LITERATURE REVIEW
Introduction
Tropical land use change has important implications for biogeochemical cycles both regionally and globally (Scholes and Van Breemen 1997). Much work has focused on the effects of forest conversion to cropland or pasture on carbon storage (Fisher et al. 1994, Nepstad et al. 1994, Van Nordwijk et al. 1997) and soil nutrient availability (Fernandes and Stanford 1995, Neill et al. 1997). The conversion of the tropical forests to other land use (such as, agroforestry systems) generally ruptures ecosystem function.
Forest management which removes the majority of mature trees in a large area may change the forest microclimate drastically (Childs and Flint 1987) often resulting in increased nitrogen mineralization rates (Frazer et al. 1990, Smethurst and Nambiar 1990).
Approximately 81% of the organic carbon that is active in the terrestrial carbon cycle is stored in soils(Paustian et al.2000, Wattel-Koekkock et al. 2001). Soil is the large pool of terrestrial organic carbon in the biosphere (Jobbagy and Jackson 2000). Beside this, the conversion of the tropical forest will change nitrogen dynamic in ecosystem(Neill et al.1997).
Research in soil nitrogen availability has important relevance for the understanding of processes in forest ecosystems (Pettersson and Hogbom 2004). Nitrogen availability depends highly on the decomposition of litter material and subsequent release of nitrogen in plant-available forms by mineralization, converting organic nitrogen into inorganic nitrogen compounds (Myrold 1999). Thus, nitrogen availability and the nitrogen cycling in forest can be affected by forest management, as it may alter these factors (Likens and Bormann 1995).
Litterfall production and leaf-litter decomposition
Litter maintains nutrient and energy flow at the soil-plant interface. It also provides habitat for various soil organisms and protects soil from erosion (Sangha et al. 2006). Agren and Bossata (1996) described litter as “the bridge between plant and soil”. The plant litter provides the largest contribution to the formation of the humic layers in the soil, and litter decomposition by soil organisms release mineral
nutrients for the plants(Luizão and Schubart 1987).Accumulation of the litter layer on the soil surface depends on many factors, which are, vegetation, climate, management practices, and action of decomposing organisms (Luizão and Luizão 1991, Szott et al. 1991, Fernandes et al. 1997). Leaves are the primarily litter component, which is important in nutrient cycling, because they are faster to decompose than woody components (Herrera et al. 1978, Luizão and Schubart 1987). Tree density, basal area, age structure, altitude, latitude and season are factors that strongly influence litterfall dynamics in natural forest (Sundarapandian and Swamy 1999). However, Kumar and Deepu (1992) in tropical forest ecosystem reported that the litterfall production did not directly relate to stand basal area and density. Litterfall pattern in rain-forest ecosystem is determined by a variety of factors, such as species composition, successional stage in its development and related microclimate differences (Sundarapandian and Swamy 1999).
Decomposition of plant litter involves the physical and chemical processes that reduce litter to CO2, water, and mineral nutrients (Lambers et al. 1998). The
leaves decomposition is recognized as critical pathways of organic matter and nutrient flux in tropical forest.Moreover, leaves decomposition is important factors in forest succession, since they largely form the nutrient status of the forest. Decomposition of leaf-litter, by which organic matter and nutrients are returned to the forest soils, is a primary mechanism and has received considerable attention for sustainable soil fertility (Moretto et al. 2001, Xuluc-Tolosa et al. 2003). In forest ecosystems, a major source of organic matter entering the decomposition subsystem is represented by plant litter, with leaves accounting from 22 to 81% of total litter annual production (Scaracia et al. 2000, Li 2001), or 60-70% of the total fine litterfall in Okinawa forest (Xu et al. 2004). Leaf-litter decomposition is key process in the control of nutrient cycling and formation of soil organic matter(Berg and McClaugherty 2002, Xu and Hirata 2005).
in forest ecosystems are soil moisture, temperature and litter quality (Gilliam et al.
2001, Trofymow et al. 2002).
The nutrient content of the leaves affect the rate of decomposition. Generally high levels of nutrients, notably nitrogen, are expected to be able to accelerate the decomposition process. Several studies have shown a positive correlation between initial nitrogen concentration and the decomposition rate constant (Alhamd et al. 2004) and negatively correlated with both the lignin/nutrient ratio (nitrogen or phosphate) and with the lignin concentration (Lambers et al. 1998). The lignin/nitrogen ratio is a better predictor for litter decomposition, if initial lignin content is 10-28% (BassiriRad 2005).
The nitrogen and C/N ratio often have a direct impact on the decomposition process and nitrogen mineralization, indicating that litters with different nitrogen content decompose at different rates (Li et al. 2001). Therefore, the C/N ratio in litterfall is a good predictor for the rate of decomposition, and the decomposition rate correlates inversely with the C/N ratio.The high C/Nratio correlates with rich-carbon litter, particularly lignin. Litter decomposition depends on vegetation type litter and soil quality(Schinner et al.1989, Lambers et al.1998) in alpine forest has the low decomposition rate due to the high tannin and lignin in litter (Blume et al.
1996, Scheffer and Scfachtschabel 1998). Chemical composition of litter, which changes with type of plant community, influences structure and activity of microbial communities inhabiting soils (Kutsch and Dilly 1999).
Soil organic matter
In the terrestrial ecosystems, soil organic matter (SOM) is an essential reservoir of carbon, nutrients, and energy in the life cycle (Jenkinson 1988). Soil organic matter encompasses the soil biota, plant and animal tissues at varying stages of decomposition. The soil organic matter is the driving force for biological activity as the primary source of energy and nutrients for many soil organisms. A direct effect of this biological activity is seen in the macro structure of soils, through the formation of soil pores as a consequence of faunal activity and root and fungal growth (Craswell and Lefroy 2001). The relative importance of these functions varies with soil type, climate, and farming system (Tiessen and Shang 1998).
Soil organic matter is a key source of nutrients for plant growth. It is essential for maintenance of soil structure, and contributes to the ability of soil to retain nutrients and water (Liu et al. 2003). In North Cameroon, the forest conversion into continuous cultivation causes soil quality degradation. Soil quality degradation is connected with decrease in SOM, particularly in the sand fraction, with negative impacts on soil aggregation and aggregate stability (Obale-Ebanga 2001). According to Bowman et al. (2000) that minimum 2% of SOM would determine soil productivity.
The organic matter content of soils may range from less than 0.1% in desert soils to close to 100% in organic soils. In organic soils, which include most soils used for agriculture, usually contain between 1 and 4% organic matter (Schnitzer 2001). Soil organic matter consist of fresh organic residues (<10 %),active organic fractions (35-50 %),and stable organic matter/humus (33-50 %) (Önemli 2004).
It is largely that SOM increasessoil structure stability(Barthès et al.1999), resistance to rainfall impact (Hudson 1973), increases macroporosity and infiltration rate, and mesofauna activities (Lavelle et al. 1992), increases nutrients holding capacity, constituting a nutrients pool for plants, decreases evapotranspiration, increases water holding capacity (Carter 2002). Forestry and agroforestry can increase biomass production and improve soil fertility through litter on the soil surface (Harmand 1998).
The changes of SOM could be used as an indicator for ecosystems changes, because SOMis thecomplex interaction product in ecosystem (Pennock and Frick 2001). Beside SOM quality, sum and turnover also represented the impact of land use conversion(Tiessen and Stewart 1983). Thus, SOM are an important indicator for soil quality (Larson and Pierce 1994, Rosell et al.2001), and soil productivity (Larson and Pierce 1994).Solomon et al.(2000)stated that changes in land use can influence decreasing quality and quantity of SOM. If SOM was well-managed, it can maintain soil fertility and promote sustainable agriculture (Katyal et al. 2001).
Soil organic matter and biota are most importance for maintaining soil structure and fertility(Grimaldi et al.1993). The content and composition of SOM are important parameter for soil characteristics and any change in the size of soil carbon pool could alter atmospheric CO2concentration and affect the global carbon
mineralization rates (Isaac et al. 2005). Moreover, SOM content depends upon parameters such as, altitude, exposition, relief, microclimate (temperature and humidity), vegetation type, and land use practices(Seeber and Seeber 2005).
Mineralization of SOM is a major source of plant nutrients, but the stock can run out quickly, unless sufficient organic inputs are used. Total SOM content is not very sensitive indicator for soil fertility as it changes relatively slowly under different management regimes, and often has a high spatial variability, linked to variability of soil texture. The SOM is labile and their qualities easily decrease if soil environment change, but it could be recovered by increasing organic matter (Kurniatun et al.1999). If total SOM was compared with active pool, active pool is a better indicator of soil fertility than total SOM content (Maroko et al. 1999). Carbon and nitrogen are major constituents of SOM and plant. As such, they play a fundamental role as nutrients within the tropic food web. Carbon and nitrogen are released when organic matter is biologically or chemically deconstructed (Sharrow and Ismail 2004).
SOM fractionation can be done with chemical and physical fractionation. Chemical fractionation produced humic acid, fulvic acid, and humin (Yagi et al.
2005), whereas physical fractionation produced light, intermediate, and heavy fractions. Light fractions or active pools are more sensitive indicator for ecosystem changes(Degryze et al.2004) and SOM quality(Gregorich and Janzen 1996).Light fraction organic matter (LFOM) is components of SOM which have been considered a labile fraction contributing to carbon and nitrogen cycling(Curtin and Wen 1999). In SOM consists of 10-30 % active pool, which is correlated with soil microbe. Thus, active pool is derived from plant residues, microfauna debris, and microbe with its metabolism product (Janzen et al.1992).
The plant-soil organic matter cycle under agroforestry commences with fixation of carbon from the atmosphere by plants, through the process of photosynthesis. After harvest and losses (e.g. burning), what remains on the soil becomes plant residues (litter and root residues). These are converted into the active fraction by litter decomposition. This decomposition is continued by the action of meso- and microfauna, converting the active fraction into soil humus. During this conversion, more than half of the carbon and nitrogen are lost in the oxidation, an order of 80-90% from above ground plant residues and 50-80% from roots (Young 1997).
Nitrogen Use Efficiency (N NUE)
The concept of nutrient use efficiency (NUE) evolves initially from an agronomic point of view. Nutrient use efficiency is often misunderstood or misrepresented if it is discussed as an isolated issue and not in the context of the efficiency of the total crop production system. Where nutrients are purchased inputs, land is most often the primary limiting resource in terms of its availability. The most effective way of improving the system’s efficiency was through continuous increases in yields. By this way the efficiency of the system as a whole would be improved because the primary limiting resource was more productive in terms of yield per unit farmed (Dibb 2000).
Several basic techniques were described to measure nutrient balances, such as (1) Soil Surface Balance (measures the difference between the inputs or the application of nutrients and the output or removal of nutrients from the soil), (2)
Farm Gate Balance (measures the difference between the nutrient content of farm inputs and the nutrient content of farm outputs) and (3) Soil System Balance (used where detailed information on inputs, out puts, and internal transformations was available for all the important components). This type of balance required much larger data inputs, requiring the use of relevant computer models. A number of excellent mechanistic models were developed to trace the fate of nutrients. The use of isotopes (e.g. 15N) to trace the behavior of applied fertilizer was very useful in understanding the complex physical/chemical/and microbial transformations after nutrients were added to soil. Nutrient budgets were used to get an estimate of nutrient use efficiency. Nutrient efficiency might be defined in agronomic, economic, or environmental terms. For example economic efficiency occurred when farm income was maximized as a result of nutrient inputs. The nutrient deficit or surplus over the short term was not an indication of undesirable consequences, but in fact may be beneficial and desirable for building overall soil fertility. Again this is a typical agronomist concept, which is more dictated by the availability of nutrients by fertilization for an actual yield of harvestable products (Stewart 2007).
microbes (N2 fixation, nitrification, denitrification, immobilization etc.), chemical
processes (exchange, fixation, precipitation, hydrolysis, etc.) and physical processes (leaching, runoff, volatilization, etc.). The extent by which the added nutrients removed from soil solution by these processes, which compete with plant uptake, can thus affect both nutrient use efficiency and the environment (Jagadeeswaran et al. 2005).
Nutrient deficits occur in many places and as crop yields and nutrient removal increase, there is a greater need to be efficient with nutrient inputs. One of the largest input costs in agriculture is fertilizer. Because nitrogen fertilizer is made via an energy intensive process the costs are expected to rise sharply as the price of energy continues to rise. The use of fertilizers also poses an environmental problem because substantial proportions of fertilizer become mobilized by rain or irrigation and may cause damage to nearby lakes and streams where the nutrients cause eutrophication.This situation forces researchers to see the concept from a different angle mainly efficiency considered from nutrient uptake instead of nutrient availability through fertilization. A balanced fertility program is essential for optimizing yields, increasing profit, and improving the efficiency of fertilizer applications (Johnson et al. 1997). Nitrogen deficiency in agricultural systems is a world-wide problem. For non-legumes, nitrogen may be the most common limiting nutrient. The utilization efficiency of nitrogenous fertilizers under field conditions is poor. For example, for rice, the utilization efficiency of nitrogenous fertilizers under field conditions is around 50 and 25-30 %, respectively. However, without balanced nutrition, fertilizer nitrogen applications may be less efficient, and part of the fertilizer investment is wasted. This results in loss of a costly input and accentuates the environmental degradation (Johnson et al. 1997; Abrol et al. 1999).
the land use efficiency (LUE) was the highest as the interacting inputs and resources were at optimum level. In this range the optimum economic gain could be achieved (Figure 2.1) (Dibb 2000).
Figure 2.1. Nutrient use efficiency (NUE) and land use efficiency (LUE) are compatible (Dibb 2000).
vigorously producing a considerable residues and with proper management could help to reduce soil erosion. Agricultural production systems in USA, Europe, and probably also Australia are under this category. The developmental changes from Area I to IV of the response curve could improve NUE for sustainable agricultural production systems that provided adequate food, feed, fiber and fuels to the world. So it is only NUE in area IV, and not in area I, II, or III that is true NUE (Dibb 2000).
The Dibb’s argument was typical of an agronomist, and supported by Mikkelson from Potash and Phosphate Institute using nutrient budget approach. The accepted approach to nutrient balance measured the difference between nutrient inputs and outputs in an agricultural system. Nutrient budgets described nutrient flows within farming systems and assisted in the planning of the complex spatial and temporal managements within rotational cropping and mixed farming systems. Budgets were the outcome of a nutrient accounting process, ranging from simple to complex, which detailed all the inputs and outputs to a given system over a fixed period of time. The underlying assumption of a nutrient budget was that of mass balance (i.e. nutrient inputs to the system minus any nutrient exports equal the change in storage within the system) (Dibb 2000).
Nutrient or fertilizer use efficiency concepts generally describe how well plants or a production system use nutrients (Stewart 2007). The ratio of dry weight gain to net nutrient uptake is one definition of nutrient use efficiency (NUE). The other definition is given by the ratio of dry weight gain to nutrient content and for some tissues such as leaves. NUE is the reciprocal of nutrient concentration since leaf dry weight is the dry weight gain, and the nutrient content is the net nutrient uptake (Luxmoore 1989), or, is the ratio of biomass production to nutrient uptake (Hiremath et al. 2002). When nitrogen fertilizer efficiency was measured as nitrogen use efficiency (NUE), by considering two components: (1) recovery of fertilizer nitrogen, either in grain or in total above ground biomass in the current crop, and (2) a part of the applied nitrogen that was left behind (immobilized) in the soil and becomes available to subsequent crops, NUE value was of about 50-70%, and those of potassium and phosphate were 50-60% and 10-20%, respectively (Isherwood 1999).
Nitrogen use efficiency in ecosystem (N NUEEs) measured by litterfall
reliable indicator of nitrogen availability in the ecosystems. This suggestion is logical if forests are very often nitrogen limited; both nitrogen uptake and circulation should then be a function of nitrogen availability. Vitousek (1982) offer four lines of evidence in support of this suggestion: (1) the sites where potential symbiotic nitrogen fixers are dominants or codominants (which include many of the tropical forests) have a relatively high nitrogen circulation and a relatively low efficiency of litter production, (2) the temperate sites with relatively large amounts of nitrogen in litterfall and low efficiencies are in regions receiving high levels of anthropogenic fixed nitrogen in rain and snow, (3) forest fertilization show that the application of nitrogen increases both the foliar nitrogen concentrations and forest production The increase in nitrogen availability resulting from fertilization progressively increased the amount of nitrogen in litterfall and decreased the nitrogen use efficiency of litter production, (4) the combination of low nitrogen circulation and low N NUE should be possible if the site has a adequate available nitrogen but some other factor strongly limits production. The mechanisms could cause increased N NUE in low forests: (1) increased nutrients use efficiency in active leaves, (2) increase reabsorption of nutrients from leaves to stems prior to leaf abscission. Nitrogen use efficiency in ecosystem (N NUEEs) which is the ratio
of litterfall production to nitrogen content in litterfall, or the inverse of litter nitrogen concentration (Vitousek 1982). The NUEEs was influenced by forest types
and climate (Yin 1993). According to Smith et al. (1998), in forest ecosystem worldwide, NUEEs have been used as indices of nitrogen availability and soil
fertility. Nitrogen use efficiency increases with decreasing availability of soil nitrogen (Vitousek 1982, Birk and Vitousek 1986, Aerts and De Caluwe 1994). This increase in NUE may be partly the result of lower concentration of nitrogen in living tissues and partly the result of greater resorption of nitrogen (Tateno and Kawaguchi 2002). Therefore plants may not have adapted to nitrogen-poor environments simply by enhancing their NUE (Yasamura et al. 2002).
that NUE (grams of organic matter produced per unit of nutrient taken up) is simply the inverse of nutrient concentration in plant tissue, and that consequently plants from nutrient – poor habitats appear to be less efficient than plants from nutrient-rich habitats.
Whole-plant NUE considers processes related to carbon gain and loss, whereas photosynthetic nutrient-use efficiency (NUEPh) considers only the
instantaneous use of nutrients for photosynthetic carbon gain or carbon gain per unit leaf nutrient. The demand for nutrients from growing tissues may drive nutrient resorption and senescence of older leaves. The photosynthetic nitrogen use efficiencytends to decline as the leaves age. The photosynthetic capacity rises with increasing nitrogen content in linear proportion, until limitation by other factors. The photosynthetic nitrogen use efficiency is defined a photosynthetic capacity per unit leaf nitrogen (Larchner 1995, Hikosaka et al. 2002).
Nitrogen and phosphorus are largely withdrawn from senescing leaves before abscission, and use for new growth or stored in plant tissue. At species level, it has been postulated that low rates of nutrient loss can increase the fitness of plants in nutrient-poor environments. While at the ecosystem level, nutrient resorption from senescing leaves has important implications for element cycling (Aerts 1996, Aerts and Chapin 2000). Nutrients which are not resorbed will be circulated through litterfall and must be remineralized to become available again for plant uptake (Nardoto et al. 2006).
When nutrient supply declines relative to plant demand, most plants show the following sequence of events: (1) decrease in vacuolar reserves with little effect on growth, (2) continued reduction in tissue nutrient concentration, especially in older leaves and stems, reduced rates of leaf growth and photosynthesis, increased nonstructural carbohydrate concentrations, senescence of older leaves, and reallocation of reserves to compensate for reduced nutrient status (increased root mass ratio and increased root absorption capacity), (3) greatly reduced photosynthesis and nutrient absorption, dormancy or death of meristems (Lambers et al. 1998).
Translocation or resorption of nitrogen is associated with aging and senescing in tissues. Resorption from senescent leaves reduces nitrogen loss from a whole plant and increases the mean residence time of nitrogen (Hikosaka and
Hirose 2001), although there are no general patterns between nitrogen resorption from senescent leaves and soil nitrogen availability (Tateno and Kawaguchi 2002).
In 1995, coffee (Coffea spp.) and cacao (Theobroma cacao) plantations world-wide totaled 16,700,700 ha (FAO 1996). Plantations of these perennial crops are one of the most important forms of land use and are enormous economic importance for developing countries in the humid tropics (Wood and Lass 1985, Graaff 1986).
As mentioned before that agroforestry systems were a type of land use, the land use change may affect soil quality degradation. Subsequently, soil quality degradation may affect to decrease SOM. On the other hand, SOM content may increase during the time under agroforestry systems of coffee and cacao. For example, over a 10-year period of conversion of sugar cane fields to cacao plantations, SOM increased by 21% under pruned leguminous Erythrina poeppogiana and by 9% under unpruned nonleguminous Cordia alliodora (Beer et al. 1998).
Management practices will affect N2 fixation by leguminous shade trees in
cacao plantations. Plantations may be heavily fertilized with nitrogen and other elements, or not fertilized at all (Wood and Lass 1985). Pruning residues may be left around the trees, chopped and spread on the ground, or exported for fodder and firewood. The ability of shade species to produce large quantities of organic material, as litter and pruning residues, can be more important than N2 fixation
because of the positive effects on soil chemical and physical properties, especially in plantations that are fertilized. Therefore, all of these practices will affect levels of N2 fixation and nitrogen availability in plantation (Nygren and Ramirez 1995,
III. STUDY AREA AND STUDY SITES
Introduction
Towering rainforests, rugged scenery, fresh mountain streams and turbulent rivers, hot springs, unique wildlife, lichen-smothered megaliths, and a rich variety of cultures make LLNP an alluring place for modern-day tourists and scientists. Its importance becomes even more apparent when it is viewed in a geographical and geological context.
LLNP is one of Sulawesi’s most important biological refuges. It contains large areas of relatively untouched terrain and varied habitats, which include lowland and upper montane forests, elfin woodland, fertile valleys, rivers, lakes, and hot springs.
Officially declared a national park on October 5, 1993, its formation amalgamated existing reserves: the Lore Kalamanta Nature Reserve, which was set aside for the protection of Sulawesi’s unique endemic fauna; the Lake Lindu Recreation and Protection Forest, established to protect the catchments area of the Palu Valley’s Gumbasa River irrigation scheme, and to develop tourism; and Lore Lindu Wildlife Reserve. The new park covers an area 217,991 ha. In 1978 it was also declared a Man and Biosphere Reserve by UNESCO. It is globally recognized as a Centre for Plant Diversity and as an Endemic Bird Area by groups such as the IUCN, WWF and Birdlife International.
Lore Lindu has a tropical climate with high humidity. Temperatures vary only a few degrees over the course of the year. Daytime temperatures in lowland area of the park range from 26-32ºC. Highland areas are significantly cooler, as air temperature drops 6ºC (11ºF) with every 1,100 m rise in height. Rainfalls throughout the year, the heaviest period occurring during the northern monsoon which lasts from November to April. There is no pronounced wet and dry season.
Toro valley is three kilometers off the main road and has a fine traditional meeting house. It is a very pretty village surrounded on three sides by the towering hills of the park. As most of the trails are now overgrown from disuse, it is not a good walking area, although it is believed to be the best area for the rare Sulawesi Civet.
Climate
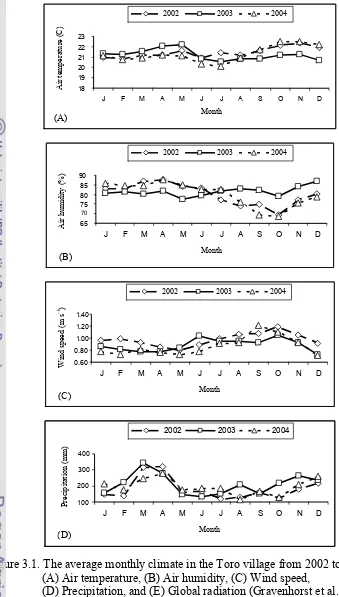
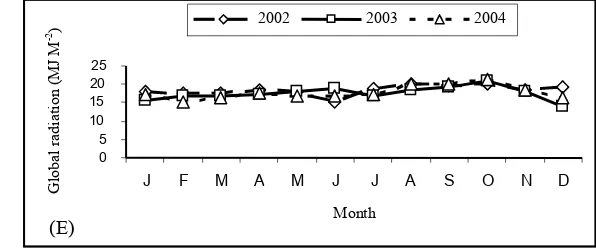
Based on the comprehensive data collected by Automatic Weather Station which was installed since 2001 at Toro village by Gravenhorst et al. (2005) that the averages of relative humidity in Toro village is 85.17%, whereas ANZDEC (1997) reported that RH values are generally in the range 77 to 85% around the Lore Lindu National Park with substantially lower values, 70 to 75% in Palu Valley. While, local wind regimes are more complex, due to the undulating mountainous terrain. At a local level, variable tree height, and the surface roughness of the forest canopy can be expected to disrupt movement of the air. The average of wind speed at the study sites is 0.396 m s-1.
Any variation in temperature in areas so close to the equator, are largely a result of cloud cover and altitude. The maximum daily temperature in Palu, near sea level is 32-33ºC. Higher elevation are, as to be expected, significantly cooler – ambient air temperature dropping around 0.5ºC for every 100 m rise in altitude. At Toro village where research took place the monthly mean temperature is 23.4ºC, whereas the average annual global radiation is 17.57 MJ M-2 (Gravenhorst et al. 2005).
Figure 3.1. The average monthly climate in the Toro village from 2002 to 2004: (A) Air temperature, (B) Air humidity, (C) Wind speed,
(D) Precipitation, and (E) Global radiation (Gravenhorst et al. 2005).
Figure 3.1. (Continued). The average monthly climate in the Toro village: (A) Air temperature, (B) Air humidity, (C) Wind speed, (D) Precipitation, and (E) Global radiation (Gravenhorst et al. 2005).
Study sites
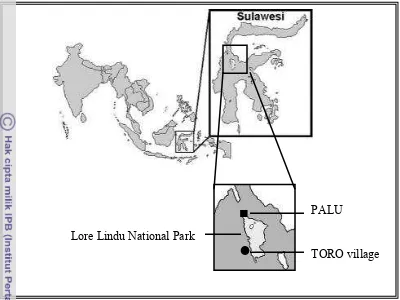
The study area is located in Central Sulawesi, Indonesia ca. 75 km southeast of Palu at the northeastern margin of LLNP (Figure 3.2). The study was conducted at buffer zone at LLNP, Central Sulawesi, Indonesia. The Toro village is characterized in many parts by a mosaic of primary forest, primary less disturbed forest, primary more disturbed forest, secondary forest, and several land use systems with cacao, coffee, maize, and paddy (rice) as the dominating crops (Gerold et al. 2004). Field sites covering in natural forest and in three cacao agroforestry systems were selected in Toro village, Kulawi district, Central Sulawesi, Indonesia. The whole site is located between 120º1’ - 120º3’30”E and 1º29’30” - 1º32’S and the elevation of from 800 m to 1100 m. The average of relative humidity at Toro village is 87.21%, the mean of monthly temperature is 22.88ºC, the average annual global radiation is 17.48 MJ/M2, and the annual precipitation in 2005 recorded in the study sites was 2056 mm.
Figure 3.2. Map of study area, Toro village at the northeastern margin of Lore Lindu National Park, Central Sulawesi, Indonesia.
Actually, study sites was carried out in six land use types including three types of rain forest and three agroforestry systems namely: undisturbed natural forest (wana), lightly disturbed natural forest (pahawa 1), moderately disturbed natural forest (pangale 2), cacao forest garden (pahawa pongko 1), cacao cultivated under mixed canopy cover (pahawa pongko 2), and cacao cultivated under monospecific canopy tree (huma). The detailed of each land use types as follows:
1. Land use rainforest consist of:
Land use type A (wana): low use intensity of forest/undisturbed rainforest. Natural forest with traditional use only, human activities restricted to collecting of medicinal plants and extensive hunting; rattan palms abundantly present.
Land use type B (pangale 1): medium use intensity of forest. Lightly disturbed rainforest. Natural forest with rattan extraction, rattan palms removed.
Land use type C (pangale 2): moderate use intensity of forest /moderately disturbed rainforest. Selectively logged forest, containing small to medium sized gaps, disturbance of ground vegetation, and increased abundance of lianas following the selective removal of canopy trees and rattan.
Y
Z
PALU
TORO village Lore Lindu National Park
1. Land use cacao agroforestry systems consist of:
Land use type D (pahawa pongko 1): cacao forest garden. Cacao cultivated under natural shade trees (remaining forest cover) in the forest margin.
Land use type E (pahawa pongko 2): cacao cultivated under mixed canopy planted shade trees at the forest margin.
Land use type F (huma): cacao cultivated under canopy of monospecific planted shade trees with shade trees more distant the forest margin.
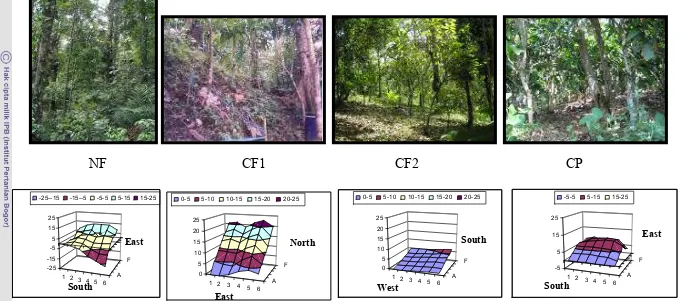
Four different study sites were selected at buffer zone at LLNP (Figure 3.3 and 3.4), i.e., (1) Natural forest with traditional use only (type A - NF), (2) Agroforestry system (cacao) under a remaining forest cover (type D - CF1), (3) Agroforestry system (cacao) under local shade trees (type E - CF2), (4) Agroforestry system (cacao) without forest cover but with planted shade trees (Type F - CP). Profile diagram of study sites shown in the Appendix 1 – 4. The species that dominate on the NF was Palaquium quercifolium, Castanopsis accuminatisima, Ficus trachypison, Lithocarpus celebicus, and Chionanthus laxiflorus. The cacao agroforestry type 1 (CF1) was dominated by Theobroma cacao, Coffea robusta, Arthocarpus vrieseanus, Turpinia sphaerocarpa, and
Horsfieldia costulata. The species that dominate on cacao agroforestry type 2 (CF2) was T. cacao, Erythrina subumbrans, Syzigium aromaticum, Arenga pinnata, and
Figure 3.3. Study sites at Toro village, arrow shows study sites: NF= natural forest, CF1, CF2, and CP = cacao agroforestry systems (Erasmi et al. 2004)
NF
NFNF
NF C
C C
CFFFF1111
C
CC
CFFF2F222
CP CP CP CP
Figure 3.4. Four land use types as study sites, above: vegetation structure, below: topographic plot, NF: natural forest, CF1: cacao
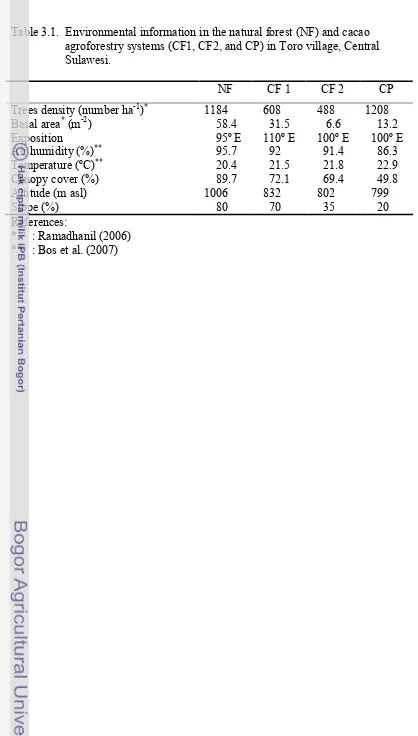
Table 3.1. Environmental information in the natural forest (NF) and cacao agroforestry systems (CF1, CF2, and CP) in Toro village, Central Sulawesi.
NF CF 1 CF 2 CP Trees density (number ha-1)* 1184 608 488 1208 Basal area*(m-2) 58.4 31.5 6.6 13.2 Exposition 95º E 110º E 100º E 100º E Air humidity (%)** 95.7 92 91.4 86.3 Temperature (ºC)** 20.4 21.5 21.8 22.9 Canopy cover (%) 89.7 72.1 69.4 49.8 Altitude (m asl) 1006 832 802 799 Slope (%) 80 70 35 20 References:
* : Ramadhanil (2006) ** : Bos et al. (2007)
CACAO AGROFORESTRY
INTRODUCTION
Large-scale plantation forests have been established in the world to meet the demands for forest products as a result of increased pressure on natural resources caused by increasing human population. However, land deterioration (such as loss of surface soils, depletion of soil nutrients, and soil compaction) may occur when natural forests are converted to plantation of trees (Fleming and Freedman 1998, Okoro et al. 2000, Laurance et al. 2001, Schroth et al. 2002), such as, cacao plantations.
small material of dead animals, fungi or bacteria. Soil organic matter (SOM) derived from litter input, including leaves, twigs, branches, woody debris, fruits and roots, and small material (< 1 mm) of dead animals, fungi or bacteria in the mineral soil (Mund 2004).
Decomposition in agroforestry systems differs from that of in the natural forest and in the agricultural system, because of differences in the types and quality of organic inputs. Litter is a general term for senescent plant parts. Litter differs from green foliage in that much of the soluble carbon compounds and nutrients are translocated out from leaves during senescence, prior to abscission and leaf fall. As a result, the quality and decomposition rates of litter and foliage from the same plant can be quite different (Mafongoya et al. 1998).
The leaf-litter deposition and decomposition are recognized as critical pathways of organic matter and nutrient flux in the tropical forest. The production and decomposition of leaf-litter in the tropical forest are influenced by the seasonality of precipitation and plant composition. During the wet season, conditions for growth and activity of soil microorganisms are improved, thus increasing decomposition rate. The product of litterfall decomposition is facilitating the formation of SOM and return of nutrient into soil (Xuluc-Tolosa et al. 2003). Decomposition of litterfall involves the chemical and physical processes that reduce litter to CO2, water and mineral nutrients (Lambers et al. 1998).
Only about 20% of the nitrogen released from tree pruning or litter is taken up by the current crop (Palm 1995). Much of the remaining 40% to 80% of the applied organic nitrogen is incorporated into SOM (Haggar et al. 1993). Because of the slow release of nitrogen from SOM, organic inputs have a greater residual effect on soil fertility than do inorganic fertilizers (Palm 1995).
content decompose at different rate (Li et al. 2001). Thus, C/N ratio of litter is a good predictor for rate of decomposition, because rate of decomposition often correlates inversely with C/N ratio. Moreover, because of the different decomposition rates of its various compounds, litter quality changes over time, continuously affecting and changing the decomposition process. Therefore, decomposition in alpine forest has the low rate due to high tannin and lignin in litterfall (Blume et al. 1996, Scheffer and Scfachtschabel 1998).
Mean annual decomposition rate constants or decay rate coefficient (k) for temperate and tropical forests have been estimated at k = 0.9 and k = 1.8, respectively (Torreta and Takeda 1999). Within the tropics, there is some evidence of regionality in decay rates coefficient with k > 2 (high) for most African forests and k = 1-2 (medium to high) for forests in Southeast Asia and the Neotropics (Anderson and Swift 1983). Very high (k \4) rates are observed mainly in African tropical forests (Olson 1963), indicating rapid nutrient cycling. However, decay rates coefficient can be low (k< 1) even in tropical areas, depending on litter type, season and altitude (Verhoef and Gunadi 2001). The higher decomposition rates facilitate more rapid nutrient cycling in ecosystems (Sariyildiz et al.2005).
The fine roots (diameter < 2 mm) are component of belowground production in forest (Nadelhoffer 2000). Root distribution was found to be confined to the surface soil with up to 50% of the fine roots occurring in a thick organic layer. This is typical for nutrient-poor environment (Priess et al. 1999). On the other hand, the capacity of a tree to absorb water and nutrients will depend upon, among other factors, fine roots dynamics; i.e. rates of mortality and regrowth of fine roots, and how these vary in time. Fine roots biomass (live fine root) in cacao plantation shaded by Cordia alliodora was always higher over a 15 year period than it was in plantation shaded by Erythrina poeppigiana (Mu]oz and Beer 2001). Although there have been several studies on litter and fine roots dynamics in tropical forest ecosystems, information on litter and fine roots production in natural forest and cacao agroforestry systems in Central Sulawesi is limited.
agroforestry under a remaining forest cover – CF1, (5) Cacao agroforestry under local shade trees – CF2, (6) Cacao agroforestry without forest cover but with planted shade trees - CP. In this work only type (1 - NF), (4 – CF1), (5 – CF2), and (6 - CP) were studied.
The objectives of this study were to determine (1) litterfall dynamics, (2) leaf-litter decomposition, (3) N and C released, and (4) fine roots biomass in the natural forest and cacao agroforestry systems.
MATERIALS AND METHODS
Litterfall production
Ten litter traps 1 m x 1 m, 50 cm high above the ground were installed at 20 subplots on each plot. Litter was collected monthly intervals from the traps for one year (March 2005 – February 2006). The litter was taken to the laboratory and dried to a constant dry weight at 80ºC before being categorized into leaf, woody (small branches and bark), and reproductive parts. The components were weighed separately and total litterfall was obtained by weighing the total dry weight.
Soil surface litter (SSL)
Soil surface litter was taken from each plot by using 50 cm x 50 cm quadrangle. Soil surface litter samples were taken four times in a year. At each collecting time, twenty-five of SSL samples were collected randomly in each plot. The SSL was taken to the laboratory and dried to a constant dry weight at 80ºC.
Leaf-litter decomposition
The decomposition was evaluated by using the litter bag technique. The litter bags (10 cm x 20 cm) were constructed from nylonet (1 mm2opening screen). Five grams of dried fallen intact leaves was placed in each bags. The bags were pinned to the ground under the trees. One litter bag from each plot was harvested each month during three months incubation, twice in 12 months. First period and second period were done from March to June 2005 and September to December 2005 respectively. After three months incubation in each period, the collected litter bags were taken to the laboratory, and dried to a constant dry weight at 80° C to determine the percentage of the mass remaining. Nitrogen and organic carbon content in initial leaf-litter and mass remaining of leaf-litter were determined by the Kjeldahl for nitrogen content, whereas organic carbon content with the Walkley and Black method.
The mass loss over time was fitted with a simple exponential curve. The decay-rate coefficient, k, for the rate of decomposition as outlined in Olson (1963). ln (Xt/XO)= -kt
where Xt is the amount of leaf-litter after time, t, t is the time (month), XO is the
The total amount of nutrient released in relation to total amount of litter produced at each study site was calculated from the amount of litter decomposed from time tOto t and nutrient content associated with decomposed litter at tOand t
time, as follows (Kamaljit et al. 2006) :
YO= XOx initial nutrient concentration
where, YOis amount of nutrients at time tOin litter, XOis amount of litter at time tO.
At time t, amount of remaining litter = Xt.
Thus the nutrient content at time t in the remaining litter (Yt):
Yt= Xtx nutrient content at t
The amount of nutrient released during tOto t time = YO– Yt
Fine roots biomass (living fine root)
Root samples were taken four times in 1 year (March, June, September, and December 2005) with a soil corer (3.5 cm in diameter) from surface mineral soil down to 15 cm soil depth. The soil from core method was used to extract volume-based fine roots samples (< 2 mm in diameter). It was done in each study site with 25 replications at each time sampling, yielding 4 plots x 4 time sampling x 25 replications = 400 samples. The soil samples were soaked in water and cleaned from soil residues using a sieve with a mesh size of 2 mm. Large root fractions (> 2 mm in diameter) were extracted by hand. Only live fine root of trees (roots < 2 mm in diameter) were considered for analysis. The fine root samples were sorted under stereomicroscope for live fine roots (biomass) and dead, tree and non-tree roots, and diameter. Fine roots biomass was dried to a constant dry weight at 70° C to determine dry weight.
Periodic curve fitting
Periodic curve fitting can be applied for periodic data when the observations are equally spaced a complete cycle (daily, weekly, or yearly cycles). Technically, periodic curve referred to as harmonics (Little and Hills 1977). In this study, periodic curve fitting would be applied for data of monthly litterfall and climates (precipitation, temperature, air humidity, and wind speed).
Fitting a periodic curve we need two P values called PUi (^UiY)and PV
(^ViY) where:
Y is monthly litterfall and monthly climates,
Ui is cosCX, Vi is sinCX (X is month, which January was called month 0,
February month number 1, etc., C = 1/12 x 360º).
Periodic curve need PU1, PV1for first degree curve and PU2, PV2for second degree
curve. The equation of first degree curve is
_1= a0+ a1cosCX + b1sin CX
Where a0=^Y/n
a1= 2 PU1/n
b1= 2 PV1/n
The second degree equation is
_2= a0+ a1cosCX + b1sin CX + a2cos2CX + b2sin2CX
Where a2= 2 PU2/n
b2= 2 PV2/n
Periodic curve consists of month (X-axis) and deviation of mean (Y-axis). The deviation of mean is deviation of the second degree values from each parameter.
Data analysis
RESULTS
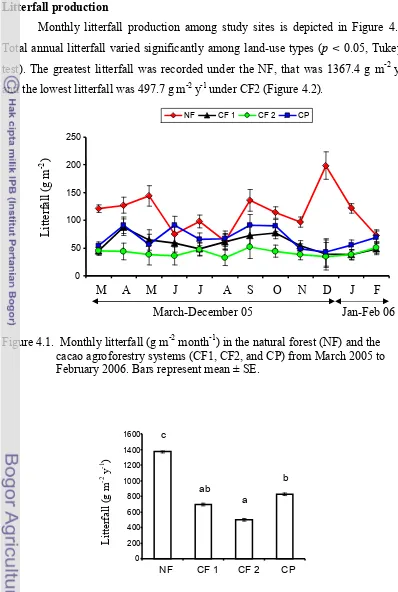
Litterfall production
Monthly litterfall production among study sites is depicted in Figure 4.1. Total annual litterfall varied significantly among land-use types (p < 0.05, Tukey- test). The greatest litterfall was recorded under the NF, that was 1367.4 g m-2 y-1 and the lowest litterfall was 497.7 g m-2 y-1 under CF2 (Figure 4.2).
Figure 4.1. Monthly litterfall (g m-2 month-1) in the natural forest (NF) and the cacao agroforestry systems (CF1, CF2, and CP) from March 2005 to February 2006. Bars represent mean ± SE.
Figure 4.2. Annual litterfall in the natural forest (NF) and cacao agroforestry systems (CF1, CF2, and CP). Data represent mean ± SE. Different letters indicate significantly different (Tukey-test, p< 0.05).