DOI 10.1007/s11027-006-9048-3
O R I G I N A L A R T I C L E
Shifting cultivation in peatlands
Bambang Hero Saharjo
Received: 16 April 2004 / Revised: 10 February 2005 / Accepted: 18 April 2005
C
Springer Science+Business Media B.V. 2006
Abstract Transboundary haze pollution from smoke from land preparation fires has become a perennial problem in Indonesia, especially in the last 10 years during the dry season. Most of that smoke originates from illegal land preparation fires for oil palm and industrial forest plantation as well as from shifting cultivation, which is usually blamed for the smoke. In order to understand the role of fire in shifting cultivation areas dominated by peat soils, research was conducted during the dry season of 2001 on land belonging to the community of Pelalawan village, Pelalawan district, Riau province, Indonesia. The research showed that burning did not affect all peat areas equally. No peat was burned on a fibric site, while burning on a hemic site varied in depth from 6.0 cm to 12.6 cm, and on a sapric site from 15.4 cm to 31.9 cm. Further, on the fibric site only phosphorus increased significantly following burning, while on the hemic only the base saturation increased; on the sapric site, however, both base saturation and phosphorus increased compared to the condition before burning. These data show that if fire is continues to be used for land preparation in peat areas, peat becomes critically endangered.
Keywords Fire . Land management . Land preparation . Peat . Shifting cultivation
1. Introduction
Transboundary haze pollution from smoke from land preparation fires has become a perennial problem in Indonesia, especially in last 10 years during the dry season. Smoke pollution reached a record during the 1997/98 fires, which released more carbon dioxide than the cars and power stations of western Europe release in one year (WWF 1997). In total the fires contributed 22% of the world’s carbon dioxide released in that year, or more than 700 million tonnes, which made Indonesia one of the largest contributors of carbon emissions in the world (UNCHS 1999). The 60–80% majority of fires that contributed to the smoke were set
B. H. Saharjo
Forest Fire Laboratory, Faculty of Forestry, Bogor Agricultural University, PO Box 168, Bogor 16001, West Java, Indonesia
illegally for land preparation for oil palm and industrial forest plantation, while the remainder is believed to have originated from shifting cultivation, which usually gets blamed for the smoke.
A cheap and easy practice, fire has been used for land preparation for shifting cultivation for thousands of years (Goldammer 1993) without causing environmental problems because of the low human population pressure on forest resources. The forest provided a sustainable base of subsistence for indigenous forest inhabitants, and their impact had little effect on overall forest ecosystem stability (Nye and Greenland 1960). The practice of burning makes good sense since it produces free minerals from ash that is rich in organic carbon, phosphorus, magnesium, potassium, and sodium. The amount of nutrients in the soil temporarily increases after burning, but declines rapidly by leaching out during rainy periods (Garren 1943; Jordan 1985; Saharjo 1995). Burning for land preparation is banned by law for companies, but since it is cheap and quick, and companies need to achieve planting targets, it is still widely practiced.
Although burning increases the amount of nutrients in the soil, which temporarily enhances growth performance, it also has negative effects. As has been reported for several parts of Indonesia, peatlands being burned repeatedly for land preparation will significantly reduce in depth. This negative consequence is especially important for cultivators that depend on shifting cultivation on peatlands for a large part of their income. This paper provides facts on the relation between regular peat burning for land preparation and the status of burnt peatlands in the near future, especially in shifting cultivation areas.
2. Material and method
2.1. Research site
Research was carried out between August 2001 and July 2002 on peatlands in the area belonging to the community of Pelalawan village, Pelalawan subdistrict, Pelalawan district, Riau Province. The site is located at 102◦00′E–102◦28′E and 00◦10′N–00◦40′N.
Vegetation analysis showed that shrubs and ferns dominated the research site with mem-bers of species likeShorea macrophylla, Macaranga pruinosa, Ficus sundaica, Stenochlaena palustris, Parastemon uruphyllus, Baccaurea pendula, Nephrolepis flaccigera, and Gleiche-nia linearis. The climate in Pelalawan district is similar to conditions in the rest of Riau province. Generally the site has a tropical climate with annual rainfall ranging between 2500 mm and 3000 mm and daily temperature between 22◦C and 31◦C. According to data from the meteorological and geophysical agency and the Ministry of Transportation, rainfall in calendar year 2001 was 3794.5 mm during 86 rainy days at the site.
Of the site total area, 97.1% was located on a 0%–8% slope, the rest on a 8%–15% slope. The site is less than 10 m above sea level for an average of 2–6 m.
There are three peat decomposition types on the site, namely fibric, hemic, and sapric. Peat of the fibric type has a low level of decomposition and a low percentage of humus, which results in very low nutrition protection capacity. Because of the lack of humid materials, fibric peat is a poor medium for agricultural activity. Fibric peat also has a high porosity. Peat of the hemic type has a moderate level of decomposition and consists of several humic materials – hence its better ability in nutrition protection than fibric peat. Hemic peat is a good medium for agricultural activity as long as it still has a high content of humic materials. Sapric, or mature, peat has a high humus content and excellent ability to protect minerals. Peatland on the site was very acidic, with pH ranging between 3.0 and 3.7.
Peat classification into fibric, hemic, and sapric types was conducted by laboratory analysis and aided by a peat map from PT RAPP. In the laboratory analysis a liquid colour test was used to classify peat. This method uses filter paper watered with Na-pyrophosphate, which is dipped into peat to a depth of 1.25 cm. The colour shown through liquid movement and at the end of it is then checked with Munsell book in order to determine the pyrophosphate index (PI), which assigns avaluenumber and achromanumber. PI≥5 means fibric, PI=4 means hemic, and PI≤3 means sapric (USDA 1975).
2.2. Data sampling
To reach the objective, research was conducted in the field and in the laboratory. Two plots of 400 m2(20×20 m) each, were established each of the fibric, hemic, and sapric sites. To protect them from heat penetration during burning, 1 m deep canals were established surrounding the plots, except the fibric plots.
Before slashing and burning were conducted, environmental conditions were measured, fuel and peat characterized, and the chemical and physical properties of peat measured. Following those activities slashing was conducted, whereby logs with diameters of more than 10 cm were removed from the plots. Slashed logs and branches were separated throughout the plots. During the slashing period (drying processes), fuel characterization was being conducted at different times accompanied by environmental condition monitoring such as for temperature, relative humidity, and wind speed.
Following three weeks of drying the plots were burned again using the ring method. During burning, fire behaviour – rate of fire spread, flame height, flame temperature – was monitored through a handheld camera. Burning was done in the afternoon between 13:00 and 17:00 using a torch made from bamboo filled with gasoline.
2.3. Activities conducted before burning
2.3.1. Fire behaviour
Three subplots of 2 m2(2 m×1 m) in each of the 400 m2plots at the three different peat types were established in order to measure fuel characteristics such as fuel moisture, fuel bed depth, and fuel load. Three samples of 100 g each of materials found in the subplots (litter, leaves, branches, and logs) were taken as samples for moisture content measurement. The samples were and dried in an oven for 48 hours at 75◦C (Clar and Chaten 1954). Fuel moisture content was estimated through dry weight based measurement. Fuel load was estimated through the amount of plant material, both living and dead, found in the subplot, which was collected, separated, and weighted. Fuel bed depth was measured by the average height of the association of living and dead plant materials of various sizes and shapes in the subplots.
2.3.2. Peat chemical and physical properties
Another three random peat samples were taken at 0–20 cm depth before burning. They were collected using a copper cylinder 10 cm in diameter to allow the samples to retain their natural characteristics in laboratory analysis. Peat physical properties analyzed were bulk density (g/cm3), porosity (%), water holding capacity (%), and permeability (cm/hr).
2.4. Activities conducted during burning
Flame temperatures at 0 cm and 1 cm under the peat surface were measured using a CR 10 X data logger from Campbell Scientific Inc. The temperature sensors (thermocouple) were placed in the subplot at two locations. Burning was conducted by ring method and the fires were allowed to propagate naturally.
Rate of fire spread was measured by the average distance perpendicular to the moving flame front per minute, using a stopwatch and through video camera recording. It was difficult to measure the average flame height directly during burning, therefore flame height was calculated through video camera recording.
2.5. Activities conducted after burning
2.5.1. Fire behaviour
Fuel left in the plot was measured by establishing five 1 m2 subplots in every plot. The remaining fuel was weighted and checked. Soon following burning, penetration heat depth was measured by digging five subplots of 400 cm2each in all the plots until 30 cm depth. Fire intensity was calculated using Byram’s equation (Chandler et al. 1983), FI=273 (h)2.17,
where FI is fire intensity (kW/m) and h is flame height (m).
2.5.2. Soil chemical and physical properties
Random peat samples of up to 1 kg with 10 cm depth were taken immediately, 3 months, and 6 months following burning. Peat samples were collected in plastic containers, taken to the laboratory, and analyzed. Soil chemical properties analyzed were pH (H2O), organic-C, available phosphorus, and exchangeable cations calcium (Ca), magnesium (Mg), potassium (K), sodium (Na), base saturation and cation exchange capacity (CEC).
Another three random peat samples were taken at 0–20 cm depth immediately, 3 months, and 6 months following burning. They were collected using a copper cylinder 10 cm in diameter to allow the samples to retain their natural characteristics in laboratory analysis. Peat physical properties analyzed were bulk density (g/cm3), porosity (%), water holding capacity (%), and permeability (cm/hr). These soil chemical and physical properties were analyzed at the laboratory of soil science, Faculty of Agriculture, Bogor Agricultural University, Indonesia.
2.6. Data analysis
A completely random design of variance was used to test for differences among subplots, based on the following model (Steel and Torrie 1981):
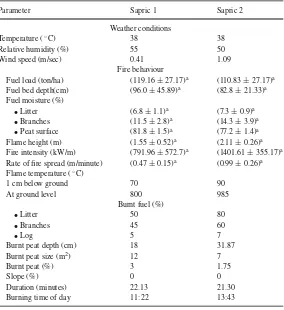
Table 1 Weather conditions and fire behaviour parameters during burning on sapric sites
Parameter Sapric 1 Sapric 2
Weather conditions
Temperature (◦C) 38 38
Relative humidity (%) 55 50
Wind speed (m/sec) 0.41 1.09
Fire behaviour
Fuel load (ton/ha) (119.16±27.17)a (110.83±27.17)a Fuel bed depth(cm) (96.0±45.89)a (82.8±21.33)a Fuel moisture (%)
•Litter (6.8±1.1)a (7.3±0.9)a
•Branches (11.5±2.8)a (14.3±3.9)a
•Peat surface (81.8±1.5)a (77.2±1.4)a
Flame height (m) (1.55±0.52)a (2.11±0.26)a
Fire intensity (kW/m) (791.96±572.7)a (1401.61±355.17)a Rate of fire spread (m/minute) (0.47±0.15)a (0.99±0.26)a Flame temperature (◦C)
1 cm below ground 70 90
At ground level 800 985
Burnt fuel (%)
•Litter 50 80
•Branches 45 60
•Log 5 7
Burnt peat depth (cm) 18 31.87
Burnt peat size (m2) 12 7
Burnt peat (%) 3 1.75
Slope (%) 0 0
Duration (minutes) 22.13 21.30
Burning time of day 11:22 13:43
(p≤0.05)
where Ymn is the fuel and fire behaviour parameter at subplot m in replication n; U the mean of the treatment population sampled; Tm the treatment used, i.e., slashing, drying, burning; and Emn a random component. To detect significant difference of fuel and fire behaviour parameters among subplots (p≤0.05), the Duncan test was used (Steel and Torrie 1981).
3. Results and discussions
3.1. Results
3.1.1. Sapric
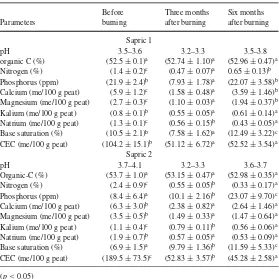
Table 2 Sapric peat chemical properties following burning in sapric sites
Before Three months Six months
Parameters burning after burning after burning
Sapric 1
pH 3.5–3.6 3.2–3.3 3.5–3.8
organic C (%) (52.5±0.1)a (52.74±1.10)a (52.96±0.47)a Nitrogen (%) (1.4±0.2)c (0.47±0.07)a 0.65±0.13)b Phosphorus (ppm) (21.9±2.4)b (7.93±1.78)a (22.07±3.58)b Calcium (me/100 g peat) (5.9±1.2)c (1.58±0.48)a (3.59±1.46)b Magnesium (me/100 g peat) (2.7±0.3)c (1.10±0.03)a (1.94±0.37)b Kalium (me/100 g peat) (0.8±0.1)b (0.55±0.05)a (0.61±0.14)a Natrium (me/100 g peat) (1.3±0.1)c (0.56±0.15)b (0.43±0.05)a Base saturation (%) (10.5±2.1)b (7.58±1.62)a (12.49±3.22)c CEC (me/100 g peat) (104.2±15.1)b (51.12±6.72)a (52.52±3.54)a
Sapric 2
pH 3.7–4.1 3.2–3.3 3.6–3.7
Organic-C (%) (53.7±1.0)a (53.15±0.47)a (52.98±0.35)a Nitrogen (%) (2.4±0.9)c (0.55±0.05)b (0.33±0.17)a Phosphorus (ppm) (8.4±6.4)a (10.1±2.16)b (23.07±9.70)c Calcium (me/100 g peat) (6.3±3.0)b (2.38±0.82)a (2.64±1.46)a Magnesium (me/100 g peat) (3.5±0.5)b (1.49±0.33)a (1.47±0.64)a Kalium (me/100 g peat) (1.1±0.4)c (0.79±0.11)b (0.56±0.06)a Natrium (me/100 g peat) (1.9±0.7)b (0.57±0.05)a (0.53±0.09)a Base saturation (%) (6.9±1.5)a (9.79±1.36)b (11.59±5.33)c CEC (me/100 g peat) (189.5±73.5)c (52.83±3.57)b (45.28±2.58)a (p≤0.05)
Table 3 Physical properties following burning in sapric sites
Parameters Before burning Three months after burning Six months after burning Sapric 1
Bulk density (g cm−3) (0.16±0.02)a (0.19±0.04)a (0.18±0.006)a Porosity (%) (88.57±1.24)a (85.72±3.11)a (86.90±0.41)a Water holding capacity (%) (25.08±9.62)a (30.56±4.73)b (28.01±10.98)a Permeability (cm hr−1) (33.21±25.06)c (10.18±4.54)b (2.72±2.53)a
Sapric 2
Bulk density (g cm−3) (0.16±0.01)a (0.17±0.02)a (0.21±0.03)b Porosity (%) (88.81±0.82)a (85.95±2.98)a (85.24±2.29)a Water holding capacity (%) (28.62±7.19)a (32.03±4.28)b (32.95±4.59)b Permeability (cm hr−1) (10.95±6.21)b (23.1±9.2)c (0.95±0.12)a (p≤0.05)
N, P (sapric 1), Ca, Mg, K, Na, and base saturation (sapric 1) at three months and N, Ca, Mg, K, N, and CEC at six months following burning had decreased significantly, while base saturation had increased compared with conditions before burning (Table 2).
Water holding capacity increased at three months following burning where permeability (sapric 2) had decreased, while at six months following burning permeability had decreased where porosity (sapric 2) and water holding capacity had increased significantly compared with conditions before burning (Table 3).
Table 4 Weather conditions and fire behaviour parameters during burning in hemic sites
Parameter Hemic 1 Hemic 2
Weather condition
Temperature (◦C) 36 39
Relative humidity (%) 55 48
Wind speed (m/sec) 0.41 0.90
Fire behaviour
Fuel load (ton/ha) (39.5±8.0)a (51.8±5.7)b
Fuel bed depth (cm) (71.8±4.28)a (101.6±9.09)b Fuel moisture (%)
•Leaves (11.92±3.52)a (12.35±1.87)a
•Branches (21.64±6.65)a (24.54±7.01)a
•Peat surface (81.8±1.5)b (77.2±1.4)a
Flame height (m) (2.9±0.3)a (3.6±0.4)b
Rate of the spread (m/minute) (1.1±0.2)a (1.9±0.2)b Fire intensity (kW/m) (2949.9±547.3)a (5050.9±1052.4)b Flame temperature (◦C)
1 cm below ground 100 130
At ground level 900 1100
Burnt fuel (%)
•Litter 90 95
•Branches 50 75
Burned peat depth (cm) (7.16±0.9)a (12.6±1.3)b
Burned peat size (m2) 4.7 13
Burned peat % 1.75 3.25
Slope (%) 0 0
Plot size (ha) 0.04 0.04
Duration (minutes) 18.0 9.3
Burning time of day 16:30 13:05
(p≤0.05)
3.1.2. Hemic
Flame height at the hemic sites varied from 2.9 m to 3.6 m. The rate of fire spread varied from 1.1 m/minute to 1.9 m/minute and resulted in flame temperatures at the peat surface from 900◦C to 1100◦C and from 100◦C to 130◦C at 1 cm below the peat surface (Table 4). These high flame temperatures reflect the high fire intensity ranging from 2949.5 kW/m to 5050.9 kW/m. Burnt peat depth varied from 7.16 cm with 1.75% peat affected to 12.6 cm with 3.25% peat affected (Table 4).
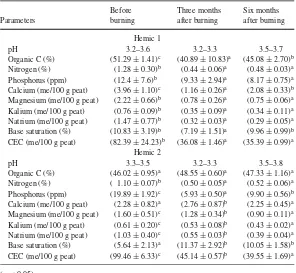
Table 5 Peat chemical properties following burning in hemic sites
Before Three months Six months
Parameters burning after burning after burning
Hemic 1
pH 3.2–3.6 3.2–3.3 3.5–3.7
Organic C (%) (51.29±1.41)c (40.89±10.83)a (45.08±2.70)b Nitrogen (%) (1.28±0.30)b (0.44±0.06)a (0.48±0.03)a Phosphorus (ppm) (12.4±7.6)b (9.33±2.94)a (8.17±0.75)a Calcium (me/100 g peat) (3.96±1.10)c (1.16±0.26)a (2.08±0.33)b Magnesium (me/100 g peat) (2.22±0.66)b (0.78±0.26)a (0.75±0.06)a Kalium (me/100 g peat) (0.76±0.09)b (0.35±0.09)a (0.34±0.11)a Natrium (me/100 g peat) (1.47±0.77)b (0.32±0.03)a (0.29±0.05)a Base saturation (%) (10.83±3.19)b (7.19±1.51)a (9.96±0.99)b CEC (me/100 g peat) (82.39±24.23)b (36.08±1.46)a (35.39±0.99)a
Hemic 2
pH 3.3–3.5 3.2–3.3 3.5–3.8
Organic C (%) (46.02±0.95)a (48.55±0.60)a (47.33±1.16)a Nitrogen (%) ( 1.10±0.07)b (0.50±0.05)a (0.52±0.06)a Phosphorus (ppm) (19.89±1.92)c (5.93±0.50)a (9.90±0.56)b Calcium (me/100 g peat) (2.28±0.82)a (2.76±0.87)b (2.25±0.45)a Magnesium (me/100 g peat) (1.60±0.51)c (1.28±0.34)b (0.90±0.11)a Kalium (me/100 g peat) (0.61±0.20)c (0.53±0.08)b (0.43±0.02)a Natrium (me/100 g peat) (1.03±0.40)c (0.55±0.03)b (0.39±0.04)a Base saturation (%) (5.64±2.13)a (11.37±2.92)b (10.05±1.58)b CEC (me/100 g peat) (99.46±6.33)c (45.14±0.57)b (39.55±1.69)a (p≤0.05)
Table 6 Physical properties following burning in hemic sites
Parameters Before burning Three months after burning Six months after burning Hemic 1
Bulk density (g cm−3) (0.22±0.05)a (0.20±0.01)a (0.22±0.006)a Porosity (%) (84.53±3.22)a (85.72±3.11)a (84.05±0.42)a Water holding capacity (%) (28.73±6029)a (32.77±3.93)b (28.67±2.01)a Permeability (cm hr−1) (6.57±0.94)a (6.09±2.98)a (6.18±3.28)a
Hemic 2
Bulk density (g cm−3) (0.06±0.04)a (0.19±0.02)a (0.19±0.006)a Porosity (%) (88.57±2.58)a (85.95±2.98)a (86.67±0.41)a Water holding capacity (%) (20.43±2.67)a (30.61±2.41)b (28.75±1.30)b Permeability (cm hr−1) (12.47±2.23)c (0.23±0.006)a (4.86±2.19)b (p≤0.05)
3.1.3. Fibric
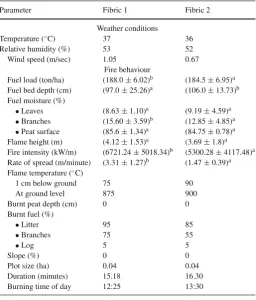
Flame height in fibric sites varied from 3.69 m to 4.12 m. The rate of fire spread varied from 1.47 m/minute to 3.31 m/minute and resulted in flame temperatures at the peat surface from 875◦C to 900◦C and from 75◦C to 90◦C at 1 cm below the peat surface (Table 7). The fire intensity in fibric sites was quite high varying from 5300 kW/m to 6721 kW/m. Following burning it was found that no peat had burned.
Table 7 Weather conditions and fire behaviour during burning in fibric sites
Parameter Fibric 1 Fibric 2
Weather conditions
Temperature (◦C) 37 36
Relative humidity (%) 53 52
Wind speed (m/sec) 1.05 0.67
Fire behaviour
Fuel load (ton/ha) (188.0±6.02)b (184.5±6.95)a Fuel bed depth (cm) (97.0±25.26)a (106.0±13.73)b Fuel moisture (%)
•Leaves (8.63±1.10)a (9.19±4.59)a
•Branches (15.60±3.59)b (12.85±4.85)a •Peat surface (85.6±1.34)a (84.75±0.78)a Flame height (m) (4.12±1.53)a (3.69±1.8)a Fire intensity (kW/m) (6721.24±5018.34)b (5300.28±4117.48)a Rate of spread (m/minute) (3.31±1.27)b (1.47±0.39)a Flame temperature (◦C)
1 cm below ground 75 90
At ground level 875 900
Burnt peat depth (cm) 0 0
Burnt fuel (%)
•Litter 95 85
•Branches 75 55
•Log 5 5
Slope (%) 0 0
Plot size (ha) 0.04 0.04
Duration (minutes) 15.18 16.30
Burning time of day 12:25 13:30
(p≤0.05)
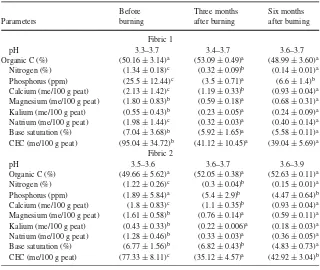
N, P (fibric 1), Ca, Mg, K, Na, base saturation (fibric 1), and CEC at three months following burning, and N, P (fibric 1), Ca, Mg, K, Na, and CEC at six months following burning had decreased significantly compared with conditions before burning (Table 8).
Three months following burning bulk density had increased, while porosity (fibric 1) and permeability had decreased, and at six months following burning bulk density (fibric 2) and water holding capacity (fibric 2) had increased where permeability had decreased significantly (Table 9) compared with conditions before burning (Table 9).
3.2. Discussions
The sapric site with the highest peat decomposition level had deeper peat burns – varying from 18 cm for 12 m2to 31.87 cm for 7 m2– than the fibric site with the lowest peat decomposition level, which had no evidence of peat burns. The hemic sites – with higher fire intensity (2949.9–5050.9 kW/m) and higher aboveground flame temperature (900◦C–1000◦C) than the sapric sites – showed less peat destruction (7.16 cm depth for 4.7 m2to 12.6 cm depth for 13 m2). A burning log buried in one of the sapric sites likely caused this difference.
Table 8 Chemical properties following burning in fibric sites
Before Three months Six months
Parameters burning after burning after burning
Fibric 1
pH 3.3–3.7 3.4–3.7 3.6–3.7
Organic C (%) (50.16±3.14)a (53.09±0.49)a (48.99±3.60)a Nitrogen (%) (1.34±0.18)c (0.32±0.09)b (0.14±0.01)a Phosphorus (ppm) (25.5±12.44)c (3.5±0.71)a (6.6±1.4)b Calcium (me/100 g peat) (2.13±1.42)c (1.19±0.33)b (0.93±0.04)a Magnesium (me/100 g peat) (1.80±0.83)b (0.59±0.18)a (0.68±0.31)a Kalium (me/100 g peat) (0.55±0.43)b (0.23±0.05)a (0.24±0.09)a Natrium (me/100 g peat) (1.98±1.44)c (0.32±0.03)a (0.40±0.14)a Base saturation (%) (7.04±3.68)b (5.92±1.65)a (5.58±0.11)a CEC (me/100 g peat) (95.04±34.72)b (41.12±10.45)a (39.04±5.69)a
Fibric 2
pH 3.5–3.6 3.6–3.7 3.6–3.9
Organic C (%) (49.66±5.62)a (52.05±0.38)a (52.63±0.11)a
Nitrogen (%) (1.22±0.26)c (0.3±0.04)b (0.15±0.01)a
Phosphorus (ppm) (1.89±5.84)a (5.4±2.9)b (4.47±0.64)b Calcium (me/100 g peat) (1.8±0.83)c (1.1±0.35)b (0.93±0.04)a Magnesium (me/100 g peat) (1.61±0.58)b (0.76±0.14)a (0.59±0.11)a Kalium (me/100 g peat) (0.43±0.33)b (0.22±0.006)a (0.18±0.03)a Natrium (me/100 g peat) (1.28±0.46)b (0.33±0.03)a (0.36±0.05)a Base saturation (%) (6.77±1.56)b (6.82±0.43)b (4.83±0.73)a CEC (me/100 g peat) (77.33±8.11)c (35.12±4.57)a (42.92±3.04)b (p≤0.05)
Table 9 Physical properties after burning in fibric sites
Parameters Before burning Three months after burning Six months after burning Fibric 1
Bulk density (g cm−3) (0.13±0.02)a (0.20±0.01)b (0.10±0.006)a Porosity (%) (90.95±1.09)b (85.48±1.09)a (92.62±0.42)b Water holding capacity (%) (32.01±6.90)b (30.72±7.92)b (27.38±0.94)a Permeability (cm hr−1) (8.93±4.59)c (6.28±5.95)b (4.13±2.36)a
Fibric 2
Bulk density (g cm−3) (0.11±0.02)a (0.15±0.04)b (0.14±0.01)b Porosity (%) (91.90±1.09)a (89.52±2.70)a (90.24±0.82)a Water holding capacity (%) (24.69±1.51)a (23.08±0.45)a (30.99±1.20)b Permeability (cm hr−1) (20.39±4.32)c (3.59±2.69)b (0.88±0.83)a (p≤0.05)
and intensity of postfire precipitation (Chandler et al. 1983). Soil properties may also change in response to heat and increased exposure (Ralston and Hatchell 1971). The results of soil chemical and physical properties analysis at different levels of peat decomposition showed that in the sapric sites phosphorus (sapric 2) and base saturation were increased significantly at six months following burning while other parameters had decreased. Similarly the hemic sites showed increased base saturation (hemic 2), and the fibric sites increased phosphorus (fibric 2), six months after the burning with a decrease in other parameters. The decrease of calcium, magnesium, potassium, and sodium following burning may have been caused by leaching
and runoff as a result of vegetation destruction (Toky and Ramakhrisnan 1981; Saharjo and Makhrawie 1998), while the increase in nutrients resulted from the presence of ash (Griffith 1943; Saharjo 1999). Losses of nutrients until six months following burning are likely the result of leaching and surface runoff caused by rain several weeks after burning. Losses of organic matter and nutrients can continue long after a fire event through erosion, leaching, and volatilization. The presence or absence of duff, humus, and other unincorporated organic materials on the forest floor and the amounts consumed are of key importance in determining how the soil is affected (Brown and Davis 1973), and Saharjo (1995) has shown that even if there were changes in soil chemical properties following burning in the shifting cultivation area, they did not improve soil fertility.
Changes in soil chemical properties will also affect the soil physical properties because the mean effect of heating was destruction of the structure in the surface layer. The soil of the burnt area is no longer protected from the beating action of raindrops and it becomes dispersed and compact so that finally soil permeability will decrease (Fuller et al. 1955), as was found in all burnt sites in this study. Beside destroying the litter layer, heat also destroyed insects and other micro-organisms that channel the soil, resulting in reduction of soil porosity (Kittredge 1938), as was found also in the sites burnt for this study. Results of this research showed that in sapric sites bulk density and water holding capacity (sapric 2), in hemic sites water holding capacity (hemic 2), and in fibric sites bulk density (fibric 2) and water holding capacity (fibric 2) increased significantly, while other parameters had decreased at six months following burning compared with conditions before burning.
These facts show that using fire for land preparation, especially in peat areas with different levels of decomposition, by shifting cultivators and recently by companies, will destroy the peat, which will finally minimize their income. Furthermore the impact of burning of peat depends on the level of peat decomposition. Burnt peat, as mentioned above, will never return to the original state because peat depth decreases every time a fire is used for land preparation. The situation becomes dangerous when fuel use is not selective and no special treatment is used during burning. As long as fire is used, whether by shifting cultivators or, recently, by companies, the future of peat is uncertain. It is predicted that if fire is continued to be used in peat areas without any treatment to prevent peat destruction, then in a few short years peat will be totally lost, as has occurred in South Sumatra where 3 m deep peat has vanished in 20 years’ time.
4. Conclusion
Results of this research show that burning will cause more damage to more highly decomposed – hemic and sapric – peat than less highly decomposed – fibric – peat. The burn depth in sapric peat varied from 18 cm for a 12 m2area to 31.87 cm for a 7 m2area, while in hemic peat it varied from 7.16 cm depth for a 4.7 m2area to 12.6 cm over a 13 m2. In fibric no burnt peat was found.
At six months following burning only phosphorus (sapric 2 and fibric 2) and base satu-ration (hemic 2) were significantly increased. In physical properties bulk density (sapric 1 and fibric 1) and water holding capacity were increased while permeability was decreased significantly compared with conditions before burning.
AcknowledgementsThe author thanks PT Riau Andalan Pulp and Paper for its research collaboration and funding assistance.
References
Brown AA, Davis KP (1973) Forest Fire: Control and Use, 2nd ed., McGraw-Hill, New York, pp 658 Chandler C, Cheney P, Thomas P, Trabaud L, Williams D (1983) Fire in Forestry, Vol. 1: Forest Fire Behavior
and Effects. John Wiley and Sons, New York, pp 450
Clar CR, Chaten LR (1954) Principles of Forest Fire Management, McGraw Book Company Inc, New York DeBano LF, Neary DG, Ffolliott PF (1998) Fire’s Effects on Ecosystems. John Wiley and Sons, New York,
pp 319
Garren KH (1943) Effects of fire on vegetation on the southern United States. Botanical Review 9(9):617–654 Goldammer JG (1993) Fire management. In: Pancel L (ed) Tropical Forestry Handbook Vol. 2, pp 1221–1267 Griffith AL (1943) The Effect of Burning on the soil as Preliminary to Artificial Regeneration. Indian Forestry
Bulletin Forest Research Institute Dehra, pp 130
Jordan CF (1985) Nutrient Cycling in Tropical Forest Ecosystem. John Wiley and Sons, New York, pp 190 Nye PH, Greenland DJ (1960) The Soil Under Shifting Cultivation. Tech Comm, 51, Commonwealth Bureau
of Soils, UK
Ralston CW, Hatchell GE (1971) Effects of prescribed burning on physical properties of soil. in Prescribed Burning Symposium USDA For. Serv Southeastern For Exp Sta, pp 68–84
Saharjo BH (1995) The changes in soil chemical properties following burning in a shifting cultivation area in South Sumatra. Wallaceana 75:23–26
Saharjo BH (1999) The effects of fire on the properties of soil inAcacia mangiumplantations in South Sumatra, Indonesia. Journal of Tropical Forest Science 11(2):459–469
Saharjo BH, Makhrawie (1998) The changes in soil chemical properties after fire in four-year-oldAcacia mangiumandEucalyptus urophyllaplantations. Tropical Ecology 39(1):97–102
Steel RG, Torrie JH (1981) Principles and Procedures of Statistics: A Biometrical Approach, 2nd ed., McGraw-Hill, New York, pp 633
Toky OP, Ramakhrisnan P (1981) Run-off and infiltration losses related to shifting agriculture (jhum) in northeastern India. Environmental Conservation 8:313–321
UNCHS (1999) Inter-Agency Report on Indonesian Forest and Land Fires and Proposal for Risk Reduction in Human Settlements, UNCHS (Habitat), UNDP, UNHD, and ADPC
USDA (1975) A Basic System of Soil Classification for Making and Interpreting Soil Survey, S.C.S. USDA Handbook No.436. Washington DC, pp 754
WWF (1997) The Year the World Caught Fire, WWF International Discussion Paper by Nigel Dudley, Switzerland