Economic Valuation of Emission Impact Reduction by
Using Alternative Path in Yogyakarta Urban Area,
Indonesia
E. Gravitiani1 and A. Failassuffudien2
1. Environmental Economy, Gadjah Mada University, Yogyakarta 55281, Indonesia
2. Transportation Economy, Faculty of Economy, Janabadra University, Yogyakarta 55284, Indonesia
Received: November 20, 2009 / Accepted: January 15, 2010 / Published: February 20, 2010.
Abstract: The urban economic development needs transportation facilities. People move form one location to the other rapidly. The amount of vehicle increases, it also increases lead content in the air. The human health cost increases as lead content in the air increases. The reduction of lead content for 10 percent, it gives economic value as much as Rp. 11.828.365.993,- (US$ 985,697.17). And if lead content decreases for 25 percent, it yields economic benefit as much as Rp. 34.509.073.173, - (US$ 2,875,765.10). The analysis of benefit uses exposure-response function method. Analysis of people awareness for keeping the environment uses contingent valuation method survey and willingness to pay. People awareness to keep their environment and to decrease lead content is not good enough, despite the fact that there is some increase of awareness, for example the awareness of using alternative path- through ring road on peak hours.
Key words: Economic valuation, lead (plumbum), emission, exposure-response, willingness to pay, alternative path.
1. Background
Physical and economic development and conservation should be implemented simultaneously. Despite the agglomeration of its social-economy development, Yogyakarta urban area grows rapidly [1]. Consequently, the economic activities need urban transportation facilities for people movement. Migration decreases the amount of Yogyakarta population. In 1990, the amount of Yogyakarta people is 412.059 and in 2006, it is 433.112 [2]. This phenomenon shows migration of approximately 30.000 people to and from Yogyakarta in 16 years. Most people who live in urban area do their activities in Yogyakarta City. Commuter phenomenon gives
E. Gravitiani, female, Ph.D., main research field: environmental economy. E-mail: [email protected].
A. Failassuffudien, male, master, main research fields: transportation economy and faculty of economy. E-mail: [email protected].
influences on traffic density on peak hours. It covers Jalan Kaliurang; Jalan Bantul; Jalan Janti and Jalan Godean. Air pollution is getting worse.
Lead content in the air is dangerous for human being. It will destroy human body particular neuron system, blood system, kidney, heart system, and reproduction system [3-4]. Children are the most vulnerable. Higher lead content in human blood will damage the brain and it influences the children IQ. Dixon (1996, p. 156) says, pollution in urban area has negative influences to human health, productivity, environmental, and freshness [5]. Everyone has ‘willingness to pay’ to get clean environment. Rich people have higher ability to pay than poor ones.
2. Research Problems
emission has negative impact. Based on background, the research problem is:
“Lead from emission gives negative impact in Yogyakarta urban area. Whether people are aware in emission reduction by using alternative path, especially in peak hours?”
3. Research Objectives
The objective of this study is identification and analysis of people’s willingness to use the alternative path in peak hours. It can reduce the traffic jam and lead content. The other objective is to estimate the benefit of lead content reduction by using alternative path.
4. Literature Review
4.1 Air Pollution
Air is non-economic goods. It is atmosphere around the earth and has important function to mortal. Air has ability to absorb pollutant in certain level, but if pollutant is over limit, there is air pollution. Environment change in air pollution is because of nature process and human activities, so the air quality decreases. Sources of air pollution are moving source in the vehicle, and non-moving source in the industry and household. Emission occur atmosphere diffusion and chemical reaction which are decrease air quality. It happens because of the increase of lead content. Traffic density in urban area will increase lead content in the air high. Lead from emission stain environment is 88 per cent of total lead in the air.
The definition of air pollution (Government Regulation Indonesia No 41/1999: Air Pollution Controlling) is: Human activities which caused the pollutant go into air ambient and decrease the air quality in certain level. Sources of air pollution are divided in to two moving sources, instead industrial and household activities, and non-moving source, instead emission. Pollutants are solid and liquid.
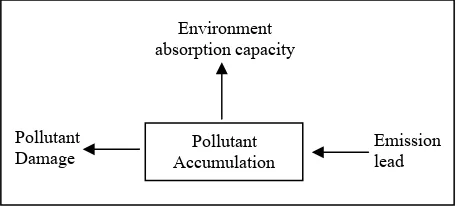
Pollutant is classified by ascendancy area, vertical and horizontal area. Horizontal area is source of local
Fig. 1 Emission and Pollution Damage. Source: Tietenberg, 1998: 225
pollutant damage at emission source inspite of regional pollutant at wider area from emission source. Vertical area is damage of pollutant consentration at surface, it is called surface pollutant, and atmosphere is global pollutant [8]. Fig. 1 shows vertical and horizontal pollutant area.
Lead content in the air of urban area is from emission. High traffic density makes high lead content in the air. Lead from emission pollutes environment for 88 per cent of total lead in the air [9]. Wright study shows area that has traffic density of 1,200 vehicles/hour, it containts lead in 100 m distances from the road edge.
Transportation is major pollution’s contributor in urban area [10]. Shrap and Jenning’s study concludes that, emission is related to speed of vehicle, the highest emission happen at the lowest vehicle speed at the traffic jam. It happens on peak hours in Yogyakarta, 07.00-09.00 in the morning and 15.00-17.00 in the afternoon. The commuters go to study and to work into Yogyakarta city in the morning and go back home in the afternoon for six days a week in average. This phenomenon happens in bordered area of Yogyakarta City, Jl. Godean (in the west), Jl Kaliurang (in the north), Jl Janti (in the east), and Jl Bantul (in the south).
4.2 Economics of Moving Source Pollution
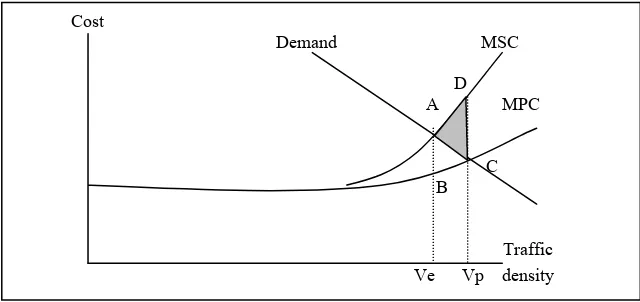
Traffic density is influenced by road capacity; road flow; and time of trip [11]. It causes marginal social cost. Externality will happen if someone decides to pass crowded road, needs more time, and it has impact to another people. Ratio of traffic volume efficiency on
Fig. 2 In-efficiency on traffic volume. Source : Lee, 1999.
road capacity (Ve) is marginal benefit, equal marginal social cost. Traffic density (Vp) triggers in-efficiency in internalization external cost, shown in ACD triangle on Fig. 2 [12].
Vehicle is high source of air pollution. This is in-efficient because vehicle doesn’t give full pollution cost payment. Transportation subsidies and brings failure of internalization external cost. Traffic density is determinated by road capacities, road volume, and movement time. It causes marginal social cost and marginal private cost. Externality happens if people pass the crowded road and need more time to pass, and it gives impact to another people.
Economic valuation is defined as a contribution to people willingness. Marginal value is related with the change of uses. Based on the theory of market value, the relation between price, buyer’s marginal benefit, and seller’s marginal cost can be minutely. If price increases, quantity of goods decreases, vice versa. Non-market value theory says environmental goods are non market values. It is assumed as public goods which are consumed by everyone [13-14].
4.3 Economic Valuation of Air Pollution
Basic technique of economic valuation is services and household relationship. Utility function is the assumption of services and environment relation, it is:
U = Y0.5 - E0.5 (1)
where U is utility, Y is household income, and E is impact. The equation shows in certain level of income, utility is derivated as the decreasing of environmental quality.
Econometric model which is used to analyze WTP is ordered probit model, with multinominal-choice and ordinal for dependent variables [15-16]. This model is discrete choice to analyze data from Contingent Valuation survey. Linear model can be used, where WTP* is linear function of independent variable.
WTPi = 0 if WTPi* ≤μo WTPi = 1 if μo < WTPi* ≤μ1 WTPi = 2 if μ1 < WTPi* ≤μ2
...
WTPi = j if WTPi* > μj-1 (2) Where, WTPi* = index (unobservable) to determinate WTP max for object I; β’ = coefficient, effect of change of x to WTP’s probability; xi = independent variables, characteristic of observed object; ε = error term
5. Research Method
This study analyzes the increase of vehicle related with lead content in the air. Exposure response function is a method to analyze the benefit if lead content in the air is decreased [17], simultaneously with strategies implication through community role. The strategy is using alternative path in peak hours.
Cost
Demand MSC D
A MPC
C B
5.1 Data and Variables
Gathering the primary data is by using survey method through direct interview with respondent questionaire. The primary data are income, distance from respondent’s house to their school or office by using alternative path, time, cost and gender.
Secondary data are taken from related institutions in Yogyakarta City. There are Statistical Bureau; Environmental Impact Controlling Office; Traffic and Highway Services; Forestry Services, Regional Development Planning Board; and also other research institutions and laboratories. The secondary data are lead content and ambient; polluted area; traffic density with assumption: the more vehicles on certain roads the more lead pollution is. Data used for economic valuation are Purchasing Power Parity (PPP), the comparison of Gross National Product per capita (GNP/capita) Indonesia and America, and exchange rate US$ to Rupiah from Indonesian Bank Report. The PPP is used because there is productivity in Indonesia and America [18-19]. The formula is:
PPP =
Where, PPP = purchasing power parity; GNP/cap Ind = Gross National Product per capita Indonesia; GNP/cap US = Gross National Product per capita America.
5.2 Population and Sample
Selected population of this study is people who live in urban area and do their activities in Yogyakarta City. They are commuter. Sample method of commuter is cluster sampling, based on their willingness to use the alternative path on peak hours; where they live in urban area and where they study or work in Yogyakarta City. The sample formula is [20-21]:
(
)
where: n = sample size; p = proportion of success from sample; q = proportion (1-p); Z½α = coefficient
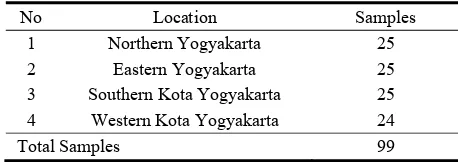
Table 1 The amount of sample.
No Location Samples
1 Northern Yogyakarta 25
2 Eastern Yogyakarta 25
3 Southern Kota Yogyakarta 25 4 Western Kota Yogyakarta 24
Total Samples 99
Source: primary data, edited, 2008.
of confidence; ω = tolerance of error from population average on left limit (L) and right limit (R), so ω = L + R.
The amount of samples is 99, the assumption is p = 95% and q = 5%; α=5% and Z½α= 1,96; L=R=5% so ω=10%. It is shown on Table 1.
5.3 Analysis Tools
5.3.1. Exposure-Response Method
Health impact (y) is function of change of health impact and change of lead pollutant in the air (ΔC). The estimation of health impact change is using exposure-response (ER) functions [17, 22]. The formula is:
I = Y. Yb. CPopW. Pop (5) where: I = the impact; Y = coefficient ER-function (percent of impact change per-unit pollutant);Yb = degree of health impact (impact /100.000 people); CPopW = the amount of people who is exposed the impact (people); Pop = total population (people).
5.3.2. Contingent Valuation Method (CVM)
CVM is the direct survey method on certain population of their willingness to pay (WTP) and willingness to accept (WTA). CVM is used to see the alternative path in peak hours, to analyze how much money that they are willing to pay to reduce lead content in the air and to keep the environment in order that impact can be minimized [23]. CVM has two benefits compared to indirect method. First, CVM can get two value, use value and non-use value. Second, the answer of WTP or WTP question can be corrected directly by monetary in the change.
and the dependent variable is quantitative variable, which is:
WTPaj = f (JT, BiT, WT, Inc, DJK) (6) Where, WTPaj = willingness respondent to pay to use the alternative path; JT = distance of using the alternative path; BiT = cost of using the alternative path; WT = time of using the alternative path; Inc = income; DJK = gender, dummy variable, 1 = man; 0 = woman.
5.3.3. Spatial Approach
Spatial approach is used to map lead content in the air in five years, sample, the amount of vehicle, crowded area and its alternative path. Data of traffic density in peak hours are gathered from Highway Services Yogyakarta Regency. Simulation of alternative path is done by using the alternative paths that indicates low of lead content and low of traffic density.
6. Results
Location of this study is agglomeration of Yogyakarta, 14 districts in Yogyakarta City, 4 districts in Sleman Regency, and 1 district in Bantul Regency. The amount of sample is 99 respondents who are using the alternative path.
6.1 Lead Content Reduction
Variables used to estimate lead content reduction are coefficient of ER-function, Yogyakarta population, health impact, and the number of 10 per cent and 25 per cent lead reduction, which is shown on Table 2. Ten percent reduction lead content in the air in Yogyakarta City can avoid 51.639 negative impacts and for 25 per cent can avoid 121.863 negative impacts. The benefit of 10 per cent lead content reduction is Rp. 14.591.526.504,- (US$ 985,697.17) and 25 per cent lead reduction, the benefit is Rp. 34.509.073.173,- (US$ 2,875,765.10).
6.2 Willingness to Pay
Variables distance, journey cost, journey time, and income influence the probability of respondent’s willingness to pay to use alternative path in peak hours
for lead and traffic jam reduction. WTP max is willingness of respondent to use the alternative path on peak hours. Respondent who has WTP max less than Rp 5.000,- (WTP=0) is 14.14 per cent; 47,47 per cent has WTP max Rp 5.000,- up to less than Rp 10.000 (WTP=1). Respondent who has WTP max Rp 10.000,- up to less than Rp 15.000 (WTP=2) is 20.20 per cent; Rp 15.000,- up to less than Rp 20.000 (WTP=3); and 9,09 per cent has WTP max more than Rp 20.000,- (WTP=4); 1 US$ equal to Rp 10.000.
The first step to analyze using ordered probit model is estimating all independent variables in model with ordinary least square to indicate the variables are significant or not. The un-significant variables are tested by redundant variables and the result is:
Redundant Variables: DJK
F-statistic 0.749652 Probability 0.388815 Log likelihood
ratio 0.794817 Probability 0.372647
The ratio log likelihood is 0.794817 with probability 0.372647 or 37.2647%, it is bigger than F-satistic value, so the variable(s) is out from model.
Second step is ordered probit model regression. There are four variables that influence the rank order probability of WTP, i.e. distance; cost; time; and income, it is shown on Table 3.
Interpretation of this model is using marginal effect, and it needs previous calculation of predicted value by retires average value of each independent variable to latent index (β’x). This value is used to estimate predicted probability for each group of WTP by counting probability of normal standart cumulative density function (CDF). Estimation of group WTP’s is shown on Table 4.
Table 2 Benefit estimation of 10 percent and 25 percent lead reduction in the air in Yogyakarta City.
Benefit
10 percent 25 percent
Impacts
Rp US$ Rp US$
Incremental IQ 573,636,621 47,803 1,434,091,553 119,507.63
Hypertension 54,672,652,248 4,556,054 136,681,630,620 11,390,135.89
Heart disease 1,343 0 3,357 0.28
Premature mortality 138,618,614 11,552 346,546,534 28,878.88
Total benefit 55,384,908,826 4,615,409 138,462,272,065 11,538,522.67 Source: Secondary data, edited, 2008
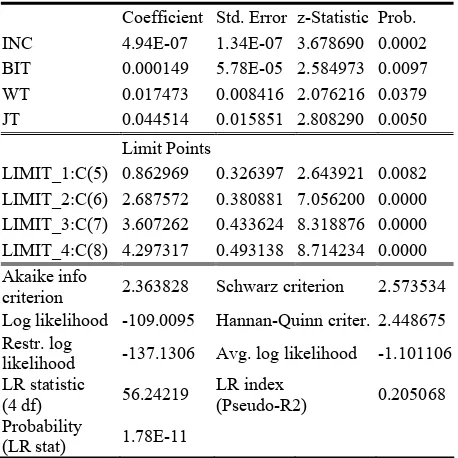
Table 3 Regression Ordered Probit Model.
Coefficient Std. Error z-Statistic Prob.
INC 4.94E-07 1.34E-07 3.678690 0.0002 BIT 0.000149 5.78E-05 2.584973 0.0097 WT 0.017473 0.008416 2.076216 0.0379 JT 0.044514 0.015851 2.808290 0.0050
Limit Points
LIMIT_1:C(5) 0.862969 0.326397 2.643921 0.0082 LIMIT_2:C(6) 2.687572 0.380881 7.056200 0.0000 LIMIT_3:C(7) 3.607262 0.433624 8.318876 0.0000 LIMIT_4:C(8) 4.297317 0.493138 8.714234 0.0000 Akaike info
criterion 2.363828 Schwarz criterion 2.573534 Log likelihood -109.0095 Hannan-Quinn criter. 2.448675 Restr. log
likelihood -137.1306 Avg. log likelihood -1.101106 LR statistic
a. Method : Maximum Likelihood – Ordered Probit; b. Sample: 99; c. Observation covered = 99 sample; d. Order indicators = 5; e. Convergent = 11 times iteration; f. Covariant Matrix by second derivatives.
Table 5 shows marginal effect, the influence of independent variables to probability of respondent’s WTP. Multicolinierity is detected by software Eviews 5.0., autocorrelation by correlogram and heterosceda- sticity by generalized residual method and Park test.
The results of the entire test indicate that there are not classical assumption problems on the model.
6.5 Spatial Analysis
Road capacity survey is done in 276 monitoring points in Yogyakarta City. The aim of the survey is to detect the potency of air pollution and traffic jam in peak hours and off-peak hours. High level traffic density happen in peak hours are such as in Jalan Monjali (northern Yogya), Jalan Solo (eastern Yogya) in front of Carrefour supermarket, Jalan Wates and Jalan Godean (western Yogya) in front of Giant supermarket and Jalan Bantul (southern Yogya). There
is vehicles accumulation in certain major roads. Survey result is shown on Fig. 3, 4, 5 and 6.
7. Discussion
Traffic volume influences lead content. It has tendency on high level if traffic density happen. Traffic management is needed to arrange traffic density through diversion of density path to alternative path and using ring-road.
The diversion of transportation mode, from private vehicle to public transportation, is needed. Road capacity in Yogyakarta is not proportional with the increases of private vehicle every year. The example of implementation traffic management is by constructing parking area inside Yogyakarta City with very high
level of tariff and parking area outside Yogyakarta City
Ə Ə Ə
Table 4 Estimation of Group WTP’s probability of respondent.
WTP Group WTP Probability
1 Prob (WTP=0) = Prob (WTP < Rp 5.000) 0.0921
2 Prob (WTP=1) = Prob (Rp 5.000 ≤ WTP < Rp 10.000) 0.1913 3 Prob (WTP=2) = Prob (Rp 10.000 ≤ WTP < Rp 15.000) 0.2644 4 Prob (WTP=3) = Prob (Rp 15.000 ≤ WTP < Rp 20.000) 0.2432
5 Prob (WTP=4) = Prob (WTP ≥ Rp 20.000) 0.209
Source: Analysis result, 2008
Table 5 Marginal effect: The influence of independent variables to probability of respondent’s WTP. Probability of respondent WTP No Independent variables
(WTP=0) (WTP=1) (WTP=2) (WTP=3) (WTP=4)
1 Inc 4.55E-08 9.45E-08 1.31E-07 1.20E-07 1.03E-07
2 BiT 1.37E-05 2.85E-05 3.94E-05 3.62E-05 3.11E-05
3 WT 1.61E-03 3.34E-03 4.62E-03 4.25E-03 3.65E-03
4 JT 4.10E-03 8.52E-03 1.18E-02 1.08E-02 9.30E-03
Source: Analysis result, 2008
Fig. 3 Traffic flows in Yogyakarta City in the morning.
Fig. 4 Traffic flows in Yogyakarta City in the afternoon.
Density Ratio 0,81< 0,61-0,80 0,41-0,60 0,21-0,40 0,00-0,20
D
Fig. 5 Traffic flows in Yogyakarta urban area in the morning.
Fig. 6 Traffic flows in Yta urban area in the afternoon.
with lower level of tariff. People have choices to drive their car and to ride their motorcycle to downtown and park on very high tariff level of parking area, or park on outside Yogyakarta with lower tariff level. People, who park their car or motorcycle on outside Yogyakarta, go to downtown by public transportation or bicycle.
References
[1] P.M. Todaro, Economic Development in The Third World, 7th edition, Addison Wesley, Longman Limited, London, 2000.
[2] B. Statistical, DIY Dalam Angka, Statistical Bureau DIY Province, Yogyakarta, Indonesia, 2007.
[3] C. Gallasi., B. Ostro., F. Forastiere, S. Cattani, M. Martuzzi,, R. Bertollini, Exposure to PM10 in the Eight Major Italian Cities and Quantification of Health Effects, World Health Organization, European Centre for Environmental and Health, Rome Division, Italy, 2000. [4] K. Lvovsky, Economic costs of air pollution with special
reference to India, South Asia Environment Unit of the World Bank, Prepared for the National Conference on Health and Environment Delhi, India, 1998, pp. 7-9. [5] J.A. Dixon, Economic Analysis of Environmental Impacts,
Earthscan Publications Ltd, London, 1994.
[6] Salt Lake City-County, Governing the Motor Vehicle Emission, Inspection/Maintenance Program for Control of Air Contaminant Emissions from Motor Vehicles, Under
Authority of Section 26A-1-121 Utah Code Annotated, 1953, as amended, USA, 1998.
[7] The Mexico Air Quality Management Team, Improving air quality in metropolitan Mexico City: An economic valuation, Washington, D.C.: The World Bank, 2002, Working Paper No. 2785.
[8] T. Tietenberg, Environmental Economics and Policy, 2nd edition, Addison Wesley, USA, 1998.
[9] P.H. Wright, N.J. Ashford, R.J.Jr. Stammer, Transport- ation Engineering Planning and Design, Fourth Edition, John Wiley & Son, New York, 1999.
[10] M.L. Davis, D.A. Cornwell, Introduction to Environment Engineering, 2nd Edition, McGraw-Hill, New York, 1995. [11] K. Lvovsky, G. Hughes, D. Maddison, B. Ostro, D. Pearce,
Environmental costs of fossil fuels: a rapid assessment method with application to six cities, Environment Department Paper No. 78. Washington, D.C.: World Bank, 2000.
[12] J.A. Lee, Natural Resources and Environmental Economic, 2nd Edition, Pearson Education Limited, London, 1999. [13] M. Common, Environmental and Resources Economics:
An Introduction, 2nd Edition, Addison Wesley Longman Publishing, New York, 1996.
[14] G. Garrod, K.G. Willis, Economic Valuation of the Envir- onment, Edward Elgar, UK, 1999.
[15] W.N. Evans, Ordered Probit, available online at: http://www.bsos.umd.edu/econ/evans(1999).
[16] W.H. Greene, Econometric Analysis, MacMillan Publishing Company, New York, 1991.
[17] H. Cesar, Economic Valuation of Improvement of Air Quality in the Metropolitan Area of Mexico City, Institute for Environmental Studies (IVM) W00/28 + W00/28 Appendices (http://www.vu.nl/ivm), Vrije Universiteit,
Amsterdam, 2000.
[18] World Bank, World Development Report 1992, Oxford University Press, New York, 1992.World Bank,
[19] The Quality of Growth, Oxford University Press, New York, 2001.
[20] Trochim, William M, The Research Methods Knowledge Base, 2nd Edition, available online at: http://trochim.- human.cornell.edu/kb/index.htm, 2002.
[21] C.J. Watson, P. Ballingsley, D.J. Croft, D.V. Hundsberger, Statistic for Management and Economics, Prentice Hall, Inc, Englewood Cliffs, NJ, USA, 1993.
[22] G.S. Eskeland, The net benefits of an air pollution control scenario for Santiago, in: World Bank, Chile, Managing environmental problems: economic analysis of selected issues, Washington, D.C., The World Bank, Report No. 13061-CH, 1994, pp. 91-120.