THE DEVELOPMENT OF VOCATIONAL
INTEREST INSTRUMEN FOR CAREER
EXPLORATION
OF JUNIOR HIGH SCHOLL STUDENTS
Yudhi Satria Restu Artosandi
Faculty of Psychology, Universitas Muhammadiyah Surakarta
Abstract
Compulsory education has been implemented around the world despite of the variety of law
and objectives. It is presumed that students’ career path can be preferred since they are
engaged in this level of education, particularly in junior high school. In fact, most of students
at this level of education undergo serious obstacle in exploring their preference. A few
instruments or tools are actually available and relevant which can help the students in junior
high school to make decision on their next education. It is so impotant to design vocational
interest instruments that can provide data of counceling process for education consultation in
general and junior high school in particular. Holland Theory is a pioneer in assessing the
environments of colleges and universities and their influence on students. It has been a
central development of knowledge on nonacademic accomplishments. This study aimed to
establish a vocational interest instrument based on Holland Theory for junior high school
students. It involved junior high schools students and vocational students of Surakarta as the
respondent. Structural Equation Modelling (SEM) was used to identify the validity and
reliability of this instrument. The yield showed the relevance of Holland Theory with
empirical evidence which indicated its suitability to design vocational insterest instrument.
Therefore, the instrument developed in this study is valid and reliable to be applied and it is
capable in providing recomendation for the next specified education.
Keywords: vocational, instrest instrument, junior high school, Holland theory.
Presenting Author’s biography
Yudhi Satria Restu Artosansi, lecturer at pshycology faculty of
Muhammadiyah University Solo (UMS), graduated from economic
science of UPN Vetereran Univerity and psychological science of
Gadjah Mada University. Post graduated program speciality in
industrial and oorganization psychology of Gadjah Mada Post Graduate
Progam and now still study at Doctoral Program speciality in
measurement and evaluation education of Yogyakarta State University
(UNY). Also active as consulting of human resources development in
many bussiness organization and in instruments development.
1.
Research
Backgroundbe used to provide measurement to help the student optimally. There is a need for practical measurement that could serve as a tool for teachers to offer education consultant and initial counseling for their students. This measurement tool should be able to capture general information regarding with the suitability between student’s characteristic and occupation preferences. One of prevailing measuring tools for career development is a theory from Holland which is developed based on Hexagonal theory that could help education practitioners in conducting counseling for career development.
Based on Holland theory, an instrument for vocational interest can be established. It will explore the students’ interest and asses the career preference based on their experiences and interaction with their surroundings, thus, it will be beneficial for the students. The research aimed: 1) to establish an instrument of vocational interest based on Holland typology to support career exploration of the students in junior high school, 2) to establish the validation of vocational interest instrument based on Holland typology to support career exploration of the students in junior high school, 3) to provide guidelines for the use and interpretation of vocational interest instrument, 4) to provide interest typology for the students of senior high school and vocational high school which can be a standard reference of recommendation for higher education.
2.
Theoretical Review
a. Basic Assumption of Holland Personality Theory
The main focus of Holland theory is on the comprehension of vocational behavior to create a practical way to help the society, young, adult, and even senior citizens in starting their career, both in educational world or in working world (Louis, 2010). It emphasizes the concept of interest as the base of the formation of one’s personality, as well as the personal competence, educational behavior, and social behavior and personality.
This theory is established based on four assumptions (Holland, 1997, p. 2-4) as follows: First, every person could be categorized based on to what extent they approach to one of the six personality types; Second, there are six environment models where each environment is dominated by a certain personality type and each environment has description of physical state, problems, and provide a certain opportunity and chance; Third, humans tend to look for an environment suitable to be used as the media in developing their expertise and capabilities, expressing attitude and value, and acquiring the correct and proper problem solution based on their characteristics. The combination of a certain personality and the suitable environment model will cause a harmony and occupational homogeneity, thus a person could perform self-development in a certain occupational environment and feels the satisfaction for it. Fourth, attitude is the embodiment of interaction between personality and environment. The suitability between individual and environment will determine the level of major conformity and stability of education and determining the satisfaction and achievement level.
b. Personality Types
Type is produced by type, meaning that even though parents’ attitude have minimum and complex contribution for children’s interest development (Roe, 1956; Roe and Siegelman, 1964 in Holland, 1997 : 5), the assumption remains that parents’ types will present activity environments towards their children based on the parents’ types. Shortly, personality types according to Holland is the interaction result between hereditary factors and environment; and the interactions influence the preferences of certain types of activities, which will direct the individuals to certain attitude types. The summary of the six personalities is as follows:
a. Realistic type prefers on activities that will need explicit, orderly, and systemized manipulation towards objects, tools, machines, and animals. The implementation of this concept means that individuals with this type tend to dislike social or educational activities.
The examples of occupations that will fulfill the needs of investigative type is chemists or physicists.
c. Artistic type prefers diverse, free, and unsystematic activities in order to produce artistic products such as painting, drama, prose. It dislikes systematic, orderly, and routine activities.
d. Social type prefers activities that will involve other people in the emphasis on helping, teaching, or providing social services. It dislikes routine and systemized activities involving objects and material objects.
e. Enterprising type prefers activities that involve manipulation of other people in order to acquire economic satisfaction and organizational goals. It dislikes systemized, abstract, and scientific activities.
f. Conventional type prefers activities with explicit, orderly, systemized data manipulation in order to provide contribution for organization’s goals. It dislikes uncertain, free, and unsystematic activities.
3.
Research Methodology
Operationally, this research follows the following steps:
1. Conducting introductory research, by doing literature and research review on the satisfaction level of students, parents, and teachers in the vocational process conducted by senior high schools.
2. Developing research design, complemented by frameworks on the initial step.
3. Developing research instrument.
4. Developing instrument of vocational interest used to determine the majoring process in senior high schools. The creation of interest measurement tools is predicted to be implemented in the determination of students’ major.
a. Process and describe the findings of the introductory research. The data acquired of the introductory research are basic data of empirical studies, especially the ones related to the administration of majoring commonly done by senior high schools.
b. Studying the report of the administration of majoring process in some senior high schools, to be used as reference for the development of conceptual model.
c. Reviewing some theories and concepts to be used as references in the development of measurement instrument of vocational interest as the author’s framework of thinking.
d. Creating drafts for measurement instrument of vocational interest based on empirical and conceptual studies.
e. Conducting limited discussion with some practitioners regarding the soon-to-be-developed measurement instrument of vocational interest.
f. Revising drafts for measurement instrument of vocational interest to the supervisory teacher and the expert of education.
5. Conducting validation for measurement instrument of vocational interest towards colleagues, supervisory teacher, and the experts in interest development field.
6. Revising measurement instrument of vocational interest based on the suggestions given by experts and program organizers of majoring process in senior high school.
8. Perfecting the instrument, through the data processing and analysis, and revising the formulas. The stage of refinement of data model is acquired through post-test result, field notes, discussion result, interview result, and documentation.
9. Compiling research report, as the final activity of research and development process.
10. Dissemination and distribution of instrument to be directly implemented to senior high schools.
This study was conducted in several senior high schools in Surakarta, Boyolali, Pacitan and Purwokerto with total of 900 respondents. It was a qualitative research using structural equation model (SEM). It is preferred since it is combination between confirmatory factor analysis and path analysis (Hadi, 2009). The calibration of structural equation model is by using Lisrel program with strictly confirmatory model to determine one constructed model and collecting empirical data to test the existing model. It is similar with a research conducted by Wong and Wong (2009) that implemented CFA to test the suitability of the model and the underlying theories.
The content validity of Vocational Interest Indonesian Version (VIIV) is analyzed through exploratory factor on 60 items with eigen values = 1 and loading factor = 0.4. The calibration of model suitability towards RIASEC typology theory is by using Structural Equations Modeling approach to correlate with the main dimension. Comparison with RIASEC typology is conducted by examining the compatibility between the developed models in instrument VIIV with hexagonal model of structural hypothesis of Holland’s theory, while the adjacent types have high correlation and contrasting types, indicated by far distance between both types in hexagonal model, have low correlation. In addition, the indication of goodness of fitused in the research to test the compatibility between VIIV with RIASEC model is by using RMSEA Steiger-Lind, Noncentrality index from McDonald, Population Gamma Index, Joreskog GFI and AGFI and Chi-squared goodness of fittest. If RMSEA criteria used is less than 0.05, then it indicates as highly fit; if it is between 0.05 – 0.08, it shows that it is fit; 0.08 – 0.10 shows medium fit; and if the value is bigger than 0.10, it shows misfit (Darcy & Tracey, 2007). GFI value is the indication of variances, which is measured from the model and GFI index is on between 0 (for badfit) to 1 (for perfect fit).
The reliability indicator reflected from square multiple correlations (R2) with general requirement ≥ 0.40, which shows variance proportion of each indicator that could be explained by its underlying factor. The higher R2 value, the higher reliability indicator will be (Ghozali and Fuad, 2005). The good reliability criteria according to Hair et al. (1998) are composite reliability (CR) > 0.70 and the value of variance extracted (VE) > 0.50.
4. Results
The data for experiment collection process was conducted towards senior high school students in some schools in Surakarta region. The schools were derived from random sampling selection of schools in Surakarta, Pacitan, Purwokerto and Boyolali, and there were 215 respondents. It was conducted on 1 May 2014. The validation of instrument was conducted by testing all dimensions of total six Holland typology dimensions in vocational interest measurement tool. The first step is testing Realistic dimension, which the findings could be seen in the following part.
1. CFA with Realistic dimension
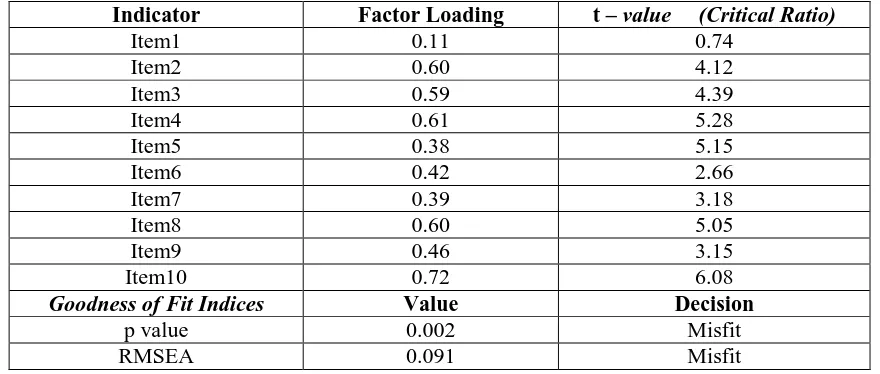
Figure 5. Result of Standardized Solution with Realistic Dimension
The model on Figure 5 shows the size of loading factor in each indicator towards its latent variable.
Table 3
Evaluation of Factor Loading and Criteria of Overall Measurement Model Fit
Realistic (R) Dimension
Indicator Factor Loading t – value (Critical Ratio)
Item1 0.11 0.74
Item2 0.60 4.12
Item3 0.59 4.39
Item4 0.61 5.28
Item5 0.38 5.15
Item6 0.42 2.66
Item7 0.39 3.18
Item8 0.60 5.05
Item9 0.46 3.15
Item10 0.72 6.08
Goodness of Fit Indices Value Decision
p value 0.002 Misfit
RMSEA 0.091 Misfit
Figure 6. Result of Standardized Solution Realistic Dimensional Measurement Model(Revised Model)
Figure 7. Result of t-value Realistic Dimensional Measurement Model(Revised Model)
The model (in the picture) shows the amount of loading factor of each indicator towards its respective latent variables. The amount of loading factor of each indicator is presented in the following table.
Table 4
Evaluation of Factor Loading and Criteria of Overall Measurement Model Fit
Realistic (R) Dimension (Revised Model)
Indicator Factor Loading t – value (Critical Ratio)
Item1 0.16 1.29
Item2 0.45 3.84
Item3 0.49 4.17
Item7 0.29 2.46
Item8 0.54 4.59
Item9 0.41 3.50
Goodness of Fit Indices Value Decision
p value 0.62385 Fit
RMSEA 0.0000 Fit
Figure 6, figure 7, and table above present that by omitting three items, it could produce good fitsince p = 0.62385 (p > 0.05) and RMSEA = 0.0000 (RMSEA < 0.05) (Darcey & Tracey in Louis, 2010). Generally, if the t value is observed carefully, all items will be bigger than 1.96 except for item 1, which means that the indicator will conform to Realistic theory concept in RIASEC model. Therefore, it is better to omit item 1 in the use of this dimension because the t value is < 1.96.
2. CFA withInvestigative dimension
Measurement model of confirmatory factor analysis with Investigative(R) dimension is shown through the following picture:
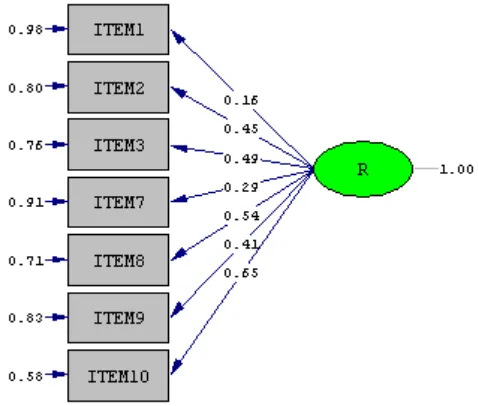
Figure 8. Result of Standardized Solution Investigative Dimension
The model on Figure 8 shows the size of loading factor in each indicator towards its latent variable. The size of loading factor of each indicator is presented in the data of table 5:
Table 5
Evaluation Factor Loading and Criteria of Overall Measurement Model Fit
Investigatic (I) Dimension
Indicator Factor Loading t – value (Critical Ratio)
Item11 0.13 1.09
Item12 0.61 4.77
Item13 0.05 0.48
Item14 0.80 7.35
Item15 0.68 6.76
Item16 0.32 2.62
Item17 0.69 6.63
Item18 0.50 4.38
Item19 0.31 2.39
Item20 0.67 5.58
Goodness of Fit Indices Value Decision
p value 0.000 misfit
RMSEA 0.119 misfit
item13, item16, and item19; however, most of them are significant (t > 1.96) except for item11 with t-value = 0.74 and item13 with t-t-value = 0.48. Observed from the result, the developed model is seen as misfit, which means zero hypothesis is rejected, which also means that the hypothesized model is dissimilar with the empirical data. Since the model is misfit (p < 0.05), it is important to do model modification. The suggested modification is by looking at the modification indices, which provide information on the correlation between indicators of a latent construct. Based on the output, there is a correlation among the error variance on item14, item15, item16, item18, and item19. The correlation between error variance informs that the indicators are strongly inter-correlated and explains one similar value related to Investigative dimension. If they are observed, item14, item15, item16, item18,and item19 turn out having opposing sentence meaning, but all of them are still the indicators of the similar dimension. If the five items are omitted from the model, the result could be seen in the following picture.
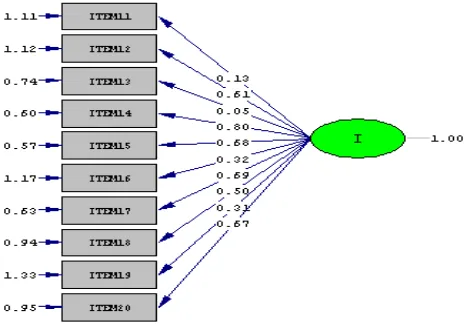
Figure 9. Result of Standardized Solution Investigative Dimensional Measurement Model
(Revised Model)
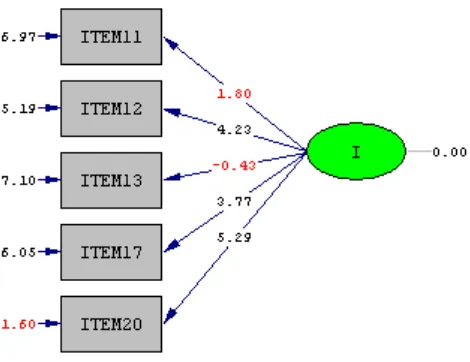
Figure 10. Result of t-value Investigative Dimensional Measurement Model
(Revised Model)
The model (in the picture) shows the amount of loading factor of each indicator towards its respective latent variables. The amount of loading factor of each indicator is presented in table 6:
Table 6
Investigatic (I) Dimension (Revised Model)
Indicator Factor Loading t – value (Critical Ratio)
Item11 0.21 1.80
Item12 0.54 4.23
Item13 -0.05 -0.43
Item17 0.46 3.77
Item20 0.81 5.29
Goodness of Fit Indices Value Decision
p value 0.6619 Fit
RMSEA 0.0000 Fit
Figure 9, figure 10, and table 6 above present that by omitting five items, it could produce good fitsince p = 0.6619 (p > 0.05) and RMSEA = 0.0000 (RMSEA < 0.05) (Darcey & Tracey in Louis, 2010). Generally, if it is observed carefully, all items will have t value bigger than 1.96 except for item13, which means that the indicator will conform to Investigative theory concept in RIASEC model. Therefore, it is better to omit item 1 in the use of this dimension because the t value is < 1.96.
3. CFA with Artistic dimension
Measurement model of confirmatory factor analysis with Artistic (A) dimension is shown through the following picture:
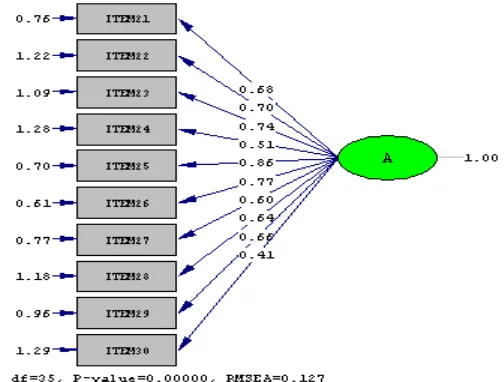
Figure 11. Result of Standardized Solution Artistic Dimension
The model on Figure 11 shows the size of loading factor in each indicator towards its latent variable. The size of loading factor of each indicator is presented in the data of table 7:
Table 7
Evaluation of Factor Loading and Criteria of Overall Measurement Model Fit
Artistic (A) Dimension
Indicator Factor Loading t – value (Critical Ratio)
Item21 0.678 6.289
Item22 0.703 5.352
Item23 0.743 5.867
Item24 0.512 3.968
Item25 0.863 7.688
Item26 0.773 7.514
Item28 0.637 4.996
Item29 0.658 5.601
Item30 0.410 3.223
Goodness of Fit Indices Value Decision
p value 0.000 misfit
RMSEA 0.127 misfit
The result of statistic measurement on figure 11 and table 7 shows that all indicators of Artistic dimensional measurement have factor loading bigger than 0.5, except item30 which have factor loading = 0.410; however, all of them are significant (t > 1.96).Observed from the result, the developed model is seen as misfit, which means zero hypothesis is rejected, which also means that the hypothesized model is dissimilar with the empirical data. Since the model is misfit (p < 0.05), it is important to do model modification. The suggested modification is by looking at the modification indices, which provide information on the correlation between indicators of a latent construct. Based on the output, there is a correlation among the error variance on item21, item22, item 23, item28, and item29. The correlation between error variance informs that the indicators are strongly inter-correlated and explains one similar value related to Artistic dimension. If they are observed, item21, item22, item23, item28, and item29 turn out having opposing sentence meaning, but the five of them are still the indicators of the similar dimension. If the five items are omitted from the model, the result could be seen in the following picture.
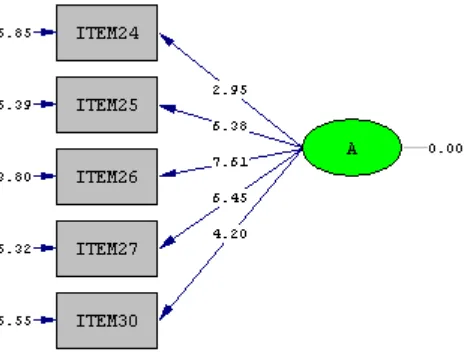
Figure 12. Result of t-value Artistic Dimensional Measurement Model(Revised Model)
The model (in the picture) shows the amount of loading factor of each indicator towards its respective latent variables. The amount of loading factor of each indicator is presented in table 8:
Table 8
Evaluation of Factor Loading and Criteria of Overall Measurement Model Fit
Artistic (A) Dimension (Revised Model)
Indicator Factor Loading t – value (Critical Ratio)
Item24 0.33 2.95
Item25 0.66 6.38
Item26 0.77 7.61
Item27 0.66 6.45
Item30 0.45 4.20
Goodness of Fit Indices Value Decision
p value 0.2058 Fit
RMSEA 0.0066 mediocre fit
Figure 11, figure 12, and table 8 above show that by omitting five items, it could produce good fit since p = 0.2058 (p > 0.05) and RMSEA = 0.0066 (RMSEA < 0.08) (Darcey & Tracey in Louis, 2010). Generally, if the t value is observed carefully, all items will have t value bigger than 1.96, which means that the indicator will conform to Artistic theory concept in RIASEC model.
4. CFA with Social dimension
Measurement model of confirmatory factor analysis with Social(S) dimension is shown through the following picture:
Figure 13. Estimation Result of Social Dimension
The model on Figure 13 shows the size of loading factor in each indicator towards its latent variable.
Table 9
Evaluation of Factor Loading and Criteria of Overall Measurement Model Fit
Social (S) Dimension
Indicator Factor Loading t – value (Critical Ratio)
Item32 0.531 6.362
Item33 0.459 4.142
Item34 0.658 7.084
Item35 0.618 6.053
Item36 0.428 3.975
Item37 0.826 9.740
Item38 0.756 9.392
Item39 0.557 4.942
Item40 0.547 4.519
Goodness of Fit Indices Value Decision
p value 0.000 misfit
RMSEA 0.150 misfit
The result of statistic measurement on figure 13 and table 9 shows that all indicators of Social dimensional measurement have factor loading bigger than 0.5, except item31, item33, and item36 which have factor loading < 0.50; however, all of them are significant (t > 1.96).Observed from the result, the developed model is seen as misfit, which means zero hypothesis is rejected, which also means that the hypothesized model is dissimilar with the empirical data. Since the model is misfit (p < 0.05), it is important to do model modification. The suggested modification is by looking at the modification indices, which provide information on the correlation between indicators of a latent construct. Based on the output, there is a correlation among the error variance on item31, item32, item 33, item35, item37, and item38. The correlation between error variance informs that the indicators are strongly inter-correlated and explains one similar value related to Social dimension. If they are observed, item31, item32, item33, item35, item37, and item38 turn out having opposing sentence meaning, but the six of them are still the indicators of the similar dimension. If the six items are omitted from the model, the result could be seen in the following picture.
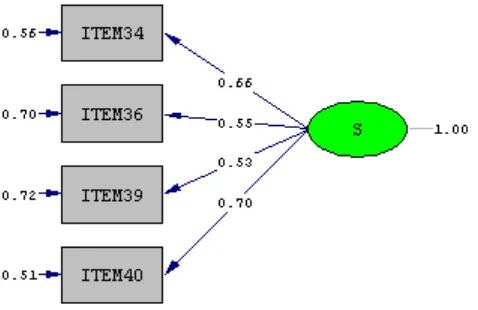
Figure 15. Result of t-value Social Dimensional Measurement Model (Revised Model)
The model (in the picture) shows the amount of loading factor of each indicator towards its respective latent variables. The amount of loading factor of each indicator is presented in the following table:
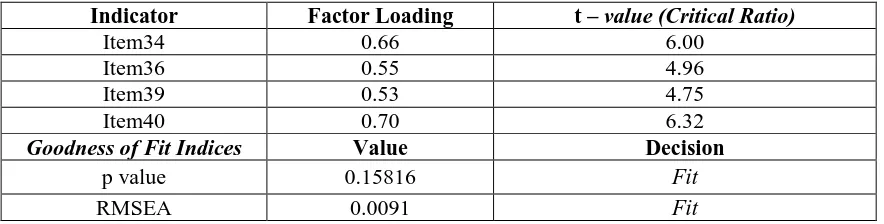
Table 10
Evaluation of Factor Loading and Criteria of Overall Measurement Model Fit
Investigatic (I) Dimension (Revised Model)
Indicator Factor Loading t – value (Critical Ratio)
Item34 0.66 6.00
Item36 0.55 4.96
Item39 0.53 4.75
Item40 0.70 6.32
Goodness of Fit Indices Value Decision
p value 0.15816 Fit
RMSEA 0.0091 Fit
Figure 14, figure 15, and table 10 above show that by omitting six items, it could produce good fits ince p = 0.15816 (p > 0.05) and RMSEA = 0.091 (RMSEA < 0.05) (Darcey & Tracey in Louis, 2010). Generally, if the t value is observed carefully, all items will have t value bigger than 1.96, which means that the indicator will conform to Social theory concept in RIASEC model.
5. CFA with Enterprising dimension
Figure 16. Estimation Result of Enterprising Dimensional Measurement Model
The model on Figure 16 shows the size of loading factor in each indicator towards its latent variable. The size of loading factor of each indicator is presented in the data of table 11:
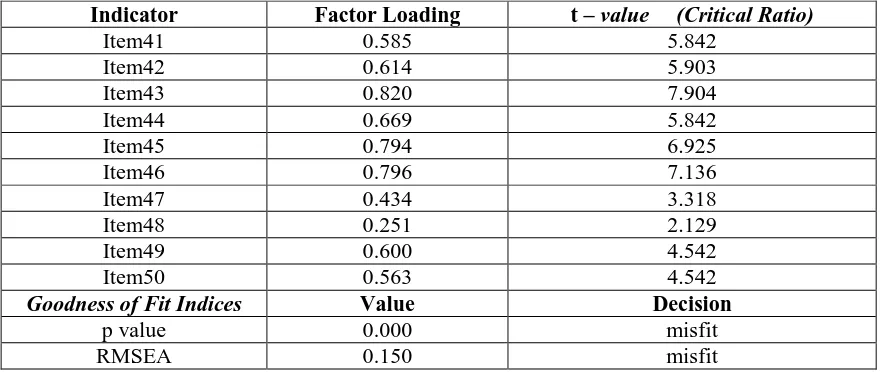
Table 11
Evaluation of Factor Loading and Criteria of Overall Measurement Model Fit
Enterprising (E) Dimension
Indicator Factor Loading t – value (Critical Ratio)
Item41 0.585 5.842
Item42 0.614 5.903
Item43 0.820 7.904
Item44 0.669 5.842
Item45 0.794 6.925
Item46 0.796 7.136
Item47 0.434 3.318
Item48 0.251 2.129
Item49 0.600 4.542
Item50 0.563 4.542
Goodness of Fit Indices Value Decision
p value 0.000 misfit
RMSEA 0.150 misfit
the six of them are still the indicators of the similar dimension. If the six items are omitted from the model, the result could be seen in the following picture.
Figure 17. Result of Standardized Solution Enterprising Dimensional Measurement Model (Revised Model)
Figure 18. Result of t-value Enterprising Dimensional Measurement Model (Revised Model)
The model (in the picture) shows the amount of loading factor of each indicator towards its respective latent variables. The amount of loading factor of each indicator is presented in the following table:
Table 12
Evaluation of Factor Loading and Criteria Overall Measurement Model Fit
Enteprising (E) Dimension (Revised Model)
Indicator Factor Loading t – value (Critical Ratio)
Item41 0.57 4.57
Item44 0.45 3.85
Item46 0.84 5.69
Item48 0.21 1.83
Goodness of Fit Indices Value Decision
p value 0.0936 Fit
RMSEA 0.116 Misfit
(Darcey & Tracey in Louis, 2010). Generally, if the t value is observed carefully, all items will have t value bigger than 1.96 except for item48, which means that the indicator will conform to Enterprising theory concept in RIASEC model. Therefore, if the model is to be used, it is better to omit item48 off the model.
6. CFA with Conventional dimension
Measurement model of confirmatory factor analysis with Conventional(C) dimension is shown through the following picture:
Figure 19. Estimation Result of Conventional Dimensional Measurement Model
The model on Figure 19 shows the size of loading factor in each indicator towards its latent variable. The estimated result of the parameter is presented in the following table 13:
Table 13
Evaluation of Factor Loading and Criteria Overall Measurement Model Fit
Conventional (C) Dimension
Indicator Factor Loading t – value (Critical Ratio)
Item51 0.456 3.491
Item52 0.526 5.074
Item53 0.0673 0.609
Item54 0.644 6.527
Item55 0.637 5.936
Item56 0.416 4.476
Item57 0.540 4.401
Item58 0.722 6.860
Item59 0.742 7.832
Item60 0.649 5.849
Goodness of Fit Indices Value Decision
p value 0.00006 misfit
RMSEA 0.109 misfit
Observed from the result, the developed model is seen as misfit, which means zero hypothesis is rejected, which also means that the hypothesized model is dissimilar with the empirical data.Since the model is misfit (p < 0.05), it is important to do model modification. The suggested modification is by looking at the modification indices, which provide information on the correlation between indicators of a latent construct. Based on the output, there is a correlation among the error variance on item52, item57, item58, and item59. The correlation between error variance informs that the indicators are strongly inter-correlated and explains one similar value related to Conventional dimension. If they are observed, item52, item57, item58,and item59 turn out having opposing sentence meaning, but the four of them are still the indicators of the similar dimension. If the four items are omitted from the model, the result could be seen in the following picture.
Figure 20. Result of Standardized Solution Conventional Dimensional Measurement Model (Revised Model)
Figure 21. Result of t-value Conventional Dimensional Measurement Model (Revised Model)
The model (in the picture) shows the amount of loading factor of each indicator towards its respective latent variables. The amount of loading factor of each indicator is presented in table 14:
Table 14
Conventional (C) Dimension (Revised Model)
Indicator Factor Loading t – value (Critical Ratio)
Item51 0.46 4.09
Item53 0.16 1.09
Item54 0.64 5.90
Item55 0.61 5.60
Item56 0.54 4.87
Item60 0.62 5.68
Goodness of Fit Indices Value Decision
p value 0.16837 Fit
RMSEA 0.065 Mediocre fit
Figure 20, figure 21, and table 14 above present that by omitting six items, it could produce good fitsince p = 0.16837 (p > 0.05) and mediocre fit on RMSEA = 0.065 (RMSEA < 0.08) (Darcey & Tracey in Louis, 2010). Generally, if the t value is observed carefully, all items will have t value bigger than 1.96 except for item53, which means that the indicator will conform to Conventional theory concept in RIASEC model. Therefore, if the model is to be used, it is better to omit item53 off the model.
Therefore, new instrument is designed by involving items not correlated to its error variance, which will result the following:
Figure 24. Result of Standardized Solution RIASEC Dimensional Measurement Model
The result presented in figure 24 shows that p = 0.26972 and RMSEA = 0.029, which indicates that the model is fit, because fit model will have value of p > 0.05 and RMSEA < 0.05 (Darcey & Tracey in Louis, 2010). This also indicates that the conformity of empirical data and RIASEC typology model used as its theoretical concept is on level of good fit.
Table 15. Correlation and Error Standard between Dimensions
R I A S E C
R 1.00
I 0.84 (0.07) 12.17 1.00 A 0.56 (0.10) 5.83 0.88 (0.05) 16.01 1.00 S 0.59 (0.09) 6.56 0.85 (0.06) 15.14 0.73 (0.06) 11.31 1.00 E 0.57 (0.10) 6.02 0.77 (0.07) 10.96 0.77 (0.06) 12.37 0.82 (0.05) 15.24 1.00 C 0.76 (0.07) 10.24 0.82 (0.06) 12.88 0.63 (0.08) 7.59 0.74 (0.07) 11.26 0.66 (0.08) 8.43 1.00
The above table shows the coefficient correlation between two pair of dimensions symbolized by a letter as an example of coefficient correlation between pair of R and I = 0.84 with error standard 0.07. This coefficient correlation could show the compatibility level with hexagonal model in RIASEC typology developed by Holland. Generally, it could be seen that there are correlation differences between the adjacent letters and correlation between the apart letters in the hexagonal model, as presented in the following picture:
Figure 25. Coefficient Correlation between Couples in Hexagonal Model of Vocational Interest Instrument
It could be seen that in Figure 25 there is a correlation between the adjacent pairs commonly have bigger coefficient compared to the detached pairs. This is according to hexagonal model on Holland theory, which states that correlation between personality type and between environment models is presented into a diagram called Hexagonal Model (Holland, 1997). This model describes various
R
C
E
S
A
I
0.84
0.56
0.57
0.59
0.76
0.85
0.88
psychological distance among personality types and environment models, the closer the distance (based on the lines in the model) between two personality types, the closer both types will be in its psychological meaning; and the farther the distance (based on the lines in the model), the farther both types will be in its psychological meaning.
Hexagonal model with each correlation power can be used as the base in making categorization in determining individual’s interest to certain occupations. Each pair of the six personality types consists of personality category and attitude tendency and will be realized in occupational interest, hobby, life goals and values, self-conviction, problem solving style, competence, and personality characteristics (Low & Rounds, 2001). The first order of orientation towards certain occupational environment is the main and foremost life style, the second order of orientation towards the other occupational environments and serves as the second life style for someone, henceforth.
These dimensional pairs will be matched by using Occupational Classification System, which categorizes 500 occupations into six occupational categories; they are Realistic Occupations, Investigative Occupations, Artistic Occupation, Social Occupations, Enterprising Occupations, and Conventional Occupations (Winkel & Hastuti, 2005: 637). The classification is included in The Occupations Finder that also includes code numbers of Dictionary of Occupational Titles. The produced classification system will be categorized by validation by conducting discussion with the experts in majoring process to compile a designed standardization for vocational interest classification, into the selected field of study in majoring process such as Sciences, Social Sciences, Language, and Arts. This is conducted to help students to know themselves and to determine the major they see fit, which will be undertaken in the process of higher education.
5.
Conclusion
This study examined the effectiveness of Holland Theory which was evidenced to be suitable as a basic theory for designing vocational interest instrument. This instrument was considered to valid and reliable in measuring the vocational insterest of the students of junior high school. Subsequently, the data yielded by the instrument providing advice, suggestion, recommendation for the students particularly for choosing speciality of their next education level. It is expected that this instrument will be useful for the teacher and counselor in junior high school to give assistance to their students.
REFERENCES
[1] D.G.J. Louis. The Development of an Interest Inventory Using Holland’s RIASEC Typology.The International Journal of Educational and Psychological Assessment.April 2010, Vol. 4. 2010.
[2] J. L. Holland. Making vocational choices: A theory of vocational personalities and work environments (3rded.). Odessa, FL: Psychological Assessment Resources. 1997.
[3] M.U.A. Darcy & T.J.G. Tracey. Circumplex Structure of Holland's RIASEC Interests Across Gender and Time. Journal of Counseling Psychology, Volume 54, Issue 1, January 2007, Pages 17-31. 2007.
[4] J.F. Jr. Hair, R.E. Anderson, R.L. Tatham & W.C. Black, Multivariate Data Analysis, (5thed). Upper Saddle River, NJ: Prentice Hall. 1998.
[5] K.S. Low & J. Rounds. Comprehensive Handbook of Personality and Psychopathology. New York: John Wiley & Sons, Inc. 2001.
[6] W.S Winkel & H. Sri. Bimbingan dan Konseling di Institusi Pendidikan . Jakarta: PT. Grasindo. 2005.
[8] A.S. Al-Miskry, A.R. Bakar, & O. Mohamed. Gender Difference and Career Interest Among Undergraduates: Implication for Career Choices. European Journal of Scientific Researc.Vol.26 No.3 (2009), pp.465-469. 2009.
[9] P.I. Armstrong, W. Allison & J. Rounds. Development and Initial Validation of Brief Public Domain RIASEC marker Scales.Journal of Vocational Behavior.73, 287-299. 2008.
[10] K. Arrington. “Middle Grades Career Planning Programs”.Journal of Career Development.Vol. 27.2. http://jcd.sagepub.com, diakses 15 Januari 2013. 2000.
[11] S. Azwar. Penyusunan Skala Psikologi. Yogyakarta: Pustaka Pelajar. 2012.
[12] Bullock, E.E., Andrews, L., Braud, J., & Reardon, R.C. Holland’s Theory in an International Context: Applicability of RIASEC Structure and Assessments. Career Planning and Adult Development Journal. Winter 2009/2010; 25, 4; Proquest Education Journals, pg. 29. 2009. [13] W. R. Borg & M. D. Gall. Educational Research: An Introduction. New York & London:
Longman. 1983.
[14] K.Y. Chan. The Relation between Vocational Interests and the Motivation to Lead. Journal of Vocational Behavior.Vol 57, 226–245 (2000). 2000.
[15] E. Cowger, I . Chauvin & M.J. Miller. An “Inverse” Validation of Holland’s Theory.College Student Journal; September 2009; 43, 3; Proquest Education Journals, pg. 807. 2009.
[16] R.V. Dawis. Handbook of Industrial and Organizational Psychology. Delhi: Jaico Publishing House. 1998.
[17] G.P. De Bruin. The Relationship Between Personality Trait and Vocational Interest. Journal of Industrial Psychology, 28(1), 49-52. 2002.
[18] Depdiknas. Undang-undang No. 20 tahun 2003 tentang Sistem Pendidikan Nasional,
_________. (2006) Panduan Penilaian Penjurusan Kenaikan Kelas dan Pindah Sekolah, Jakarta: Direktorat Pendidikan Menengah Umum. 2003.
[19] C.P. Deng, P.I. Armstrong, J. Rounds. The fit of Holland’s RIASEC model to US Occupation. Journal of Vocational Behavior, 71 (2007) 1-22. 2009.
[20] D.S. Dimakakou, K. Mylonas, & K. Argyropoulou. Holland’s Hexagonal Personality Model for Sample of Greek University Students. International Journal of Educational and Vocational Guidance. Vol: 8, 111-125. 2008.
[21] J. Farh, & F.T.L. Leong. Cross-Cultural Validity of Holland’s Model in Hong Kong.Journal of Vocational Behavior. Volume 52, 425-440. 1998.
[22] K.A. Feldman, C.A. Ethingto & J.C. Smart. A Further Investigation of Major Field and Person-Environment Fit.The Journal of Higher Education.Nov/Dec 2001; 72, 6; Proquest Education Journals, pg. 670. 2001.
[23] J. Feist & G.J. Feist. Theories of Personality. New York: The McGram Hill Companies, Inc. [24] Friedenberg, L. Psychological Testing: Design, Analysis and Use. New York: Schuster
Publishing Company. 2006.
[25] A. Furnham, J. Zang & T. Chamorro-Premuzic. The Relationship Between Psychometric & Self Estimated, Intellegence, Creativity, Personality& Academic Achievement. Imagination, Cognition, & Personality.Vol. 25(2) 119-145, 2005-2006. 2005.
[26] R. K. Gable, Instrument develompment in affective domain. Boston: Kluwer-Nijhoff Publishing. 1986.
[27] L.R. Gay, Educational Research: Competencies for analysis and application (2nded.). Columbus : Charles E Merrill Publishing. 1981.
[28] G.D. Gottfredson & M.L. Johnstun. John Holland’s Contributions: A Theory-Ridden Approach to Career Assistance. The Career Development Quarterly, December 2009; 58, 2; Proquest Education Journals, pg. 99. 2009.
[29] J.H. Greenhaus & G.A. Callanan, (ed). Encyclopedia of Career Development.Vol. 1. London: Sage Publication, Inc. 2006.
[30] D.T. Hall. Career In and Out of Organizations. Los Angeles: Sage Publications Inc. 2002. [31] R. Hambleton & J. Rodgers. Item bias review.PARE Vol 4 Number 6. 1995.
[32] R. Hogan & R. Blake. John Holland’s Vocational Typology and Personality Theory. Journal of Vocational Behavior, 55, 41–56. 1999.
[34] I. Irawati. Penjurusan Antara Minat Dan Obsesi Orang Tua. . Artikel.
http://www.kabarindonesia.com/berita.php?pil=13&dn=20080704174933. 2008.
[35] J.R.K. Kagaari. Evaluation of Effects of Vocational Choice and Practical Training on Students’ Employability.Journal of European Industrial Training. Vol 31 No. 6, pp. 449-471. Emerald Group Publishing Limited. 2007.
[36] E.K. Kathryn & B. K. Lee You Do What Yaou Are: The Relationship Between the Scale of Creativity Attributes and Behavior and Vocational Interest. Journal of Instructional Psychology.Vol 36 .p. 79. 2009.
[37] I.S. Kirsch , & T. G. John. Construct Validity of Functional Reading Tests. Journal of educational measurement, Vol. 17, No. 2. 1980.
[38] E. Komandyahrini. Hubungan Self Efficacy dengan Kematangan dalamMemilih Karir Siswa Program Percepatan Belajar.Jurnal Keberbakatan dan Kreativitas, 2 (1), 1-12. 2008.
[39] L.M. Larson & F.H. Borge. Convergence of Vocational Interests and Personality: Examples in an Adolescent Gifted Sample. Journal of Vocational Behavior; 60, pg. 91–112. 2002.
[40] J. Leeson & R.C. Reardon. Using The RIASEC Schema in Expressed Vocational Assessment: An Australian Experience. Career Planning and Adult Development Journal; Winter 2009/2010; 25, 4; Proquest Education Journals, pg. 59. 2009.
[41] F.Y. Lubis. Pengembangan Alat Ukur Minat Untuk Pengembangan Karir Pada Lulusan Sekolah Menengah Atas. Laporan Penelitian. Tidak dipublikasikan. 2008.
[42] Djemari Mardapi. Penilaian Pendidikan Karakter.Bahan Tulisan Penilaian Pendidikan Karakter UNY. Tidak Diterbitkan. 2010.
[43] R.R. McCrae, & T. C. Paul Discriminant validty of NEO PIR facet scale.Educational and psychology measurement. 52,1, 229- 237. 1992.
[44] M.A. McDaniel, & A.F. Snell. Holland’s Theory and Occupational Information.Journal of Vocational Behavior. 55, 74-85. 1999.
[45] M.J. Miller, T. P. Spinger, J.T. Tobacyk, & D. Wells. Congruency Between Occupational Daydreams and SDS Scores Among College Students. College Student Journal.38, halaman. 57. 2004.
[46] M. J. Miller & T.A. Miller. Theoretical Application of Holland’s Theory to Individual Decision-Making Styles: Implications for Career Counselors. Journal of Employment Counseling.Mar 2005; 42, 1; ProQuest Education Journals pg. 20. 2005.
[47] M.J. Miller, W.J. Scaggs & D. Wells. The Relevancy of Holland’s Theory to a Nonprofessional Occupation. Journal of Employment Counseling.Jun 2006; 43, 2; ProQuest Education Journals pg. 62. 2006.
[48] R.O. Mueler. Basic principles of strucrtural equation modeling. New York: Springer. 1996. [49] JJ. Muro & T. Kottman. Guidance and Counseling in the Elementary and Middle Schoolas.
Madison: Wm C. Brown Com. Inc. 1995.
[50] S. H. Osipow. Theories of Career Development . Englewood Cliffs: Prentice Hall, Inc. 1983. [51] W. Patton, M. McMahon. Career Development and Systems Theory: A New Relationship.
Pacific Grove, CA: Brooks/ Cole Publishing. 1999.
[52] R.C. Reardon, E.E. Bullock & K.E. Meyer. A Holland Perspective on the U.S. Workforce from 1960 to 2000. The Career Development Quarterly, 55(3), 262-275. 2007.
[53] R.C. Reardon & J.G. Lenz. Holland’s Theory and Career Assesment. Journal of Vocational Behavior, 55, 102-113. 1999.
[54] P.J. Rottinghaus, A.R. Gaffey, F.H. Borgen & C.A. Ralston. Deverse Pathways of Psychological Majors: Vocational Interests, Self-Efficacy, and Intentions The Career Development Quarterly. 55, 1, pg. 85. 2006.
[55] Santrock, Life-Span Development: Perkembangan Masa Hidup. Edisi Kelima. Jilid II. Jakarta: Erlangga. 2002.
[56] Y. Satria. Survey tentang Perencanaan Karir Siswa Kelas 3 SMP di Kota Solo. Laporan Penelitian Reguler (tidak diterbitkan). Fakultas Psikologi UMS. 2013.
[57] M.L. Savickas & A.R. Spokane. Vocational Interest. Palo Alto: Davies-Black Publishing. 1999. [58] M.L. Savickas & B.J. Taber. Individual Differences in RIASEC Profile Similarity Across Five
[59] L. Seligman. Developmental career counseling and assessment (2nded).Thousand Oaks: Sage Publishing. 1994.
[60] G.J. Skulmoski, T. H. Francis & K. Jennifer. Delphi method for graduate research.Journal of information technology education.Volume 6.Diunduh pada tanggal 28 Desember 2011 dari
http://www.fepto.eu/storage/files/articole/Delphi%20method%20for%20Graduiate%20research .pdf
.
2007.[61] J.C. Smart & P.D. Umbach. Faculty and Academic Environments: Using Holland’s Theory to Explore Differences in How Faculty Structure Undergraduate Courses. Journal of College Student Development; Mar/Apr; 48, 2; ProQuest Educatuonal Journals pg. 183. 2007.
[62] J.C. Smart, C.A. Ethington, P.D. Umbach, and L.M. Rocconi. Faculty Emphases on Alternative Course-Specific Learning Outcomes in Holland’s Model Environments: The Role of Environmentat Consistency. Journal of Res High Education.50 : 483-501. 2009.
[63] R.S. Sharf. Applying Career Development Theory to Counseling (4th Ed.). CA: Thomson-Brooks/Cole, Belmont. 2006.
[64] R.E. Snow. Individual Differences and the Design of Educational Programs in Journal of Psychology, Vol 1, Dec. 1986, 22-35. 1986.
[65] E. Susiati. Hubungan antara Self Efficacy dengan Kematangan Karir Siswa. Tesis magister, tidak diterbitkan, UPI Bandung. 2008.
[66] J.R. Studer. The Professional School Counselor: An Advocate for Student. Belmont, CA: Thomson Brooks/Cole. 2005.
[67] Taveira, Maria Do Ceu & M. Moreno, R. Luisa “Guidance Theory and Practice: The Status of Career Exploration”. British Journal of Guidance and Counseling.Vol. 31.2. http://proquest.-umi.com/pqdweb, diakses 15 Januari 2013. 2003.
[68] W.U. Tien. Vocational interest and career maturity of Male High School Students talented in Mathematics and Science. Journal of Vocational Behavior.National Science Council Production. 10(3), 137-143. 2009.
[69] D.M. Tokar, A.R. Fisher & L.M. Subich. “Personality and Vocational Behavior: A Selected Review of the Literature”, 1993 – 1997. Journal of Vocational Behavior. 53. 115 – 153. http://jcd.sagepub.com, diakses 25 Januari 2013. 1998.
[70] K.D. Toomey, E.M. Levinson & E.J. Palmer. A Test of Holland’s Theory of Vocational Personalities and Work Environments.Journal of Employment Counseling. Vol. 46, p. 82. 2009. [71] Unesco. Handbook on Career Counselling.Published in 2002 by the United Nations
Educational, Scientific and Cultural Organization 7, place de Fontenoy, 75352 Paris 07 SP. 2002.
[72] M. T . Wicaksono. Pengantar Bimbingan dan Konseling Karier . Jakarta: Bumi Aksara. 2009. [73] Witko, Kim, Bernes, Kerry B., Magnusson, Kris, & Bardick, Angela D.2005. “Senior High
School Career Planning: What Students Want”. Journal of Educational Enquiry.Vol. 6.1. http://proquest.umi.com/pqdweb, diakses 21 Januari 2013. 2005.
[74] I. Wijayanti. Penjurusan, Antara Minat dan Obsesi Orang Tua, Artikel.www.smam6paciran.com. 2010.