Wireless Network Visualization in 3D Virtual
Environment Framework
H.A. Sulaiman, M.A. Othman, M.M. Ismail, M.H. Misran
Centre for Telecommunication Research and Innovation (CeTRi)Faculty of Electronic and Computer Engineering Universiti Teknikal Malaysia Melaka
76100 Durian Tunggal, Melaka asyrani@utem.edu.my, azlishah@utem.edu.my,
muzafar@utem.edu.my, harris@utem.edu.my
Abstract—Simulating a signal propagation of wireless cognitive network has been widely accepted by researchers in order to come out with three-dimensional (3D) representation data display. Instead of using primitive way to understand the behavior of signal propagation, 3D visualization of wireless networking could also help researchers to study the limitation and exploration of wireless cognitive network deeply. In this paper, we would like to address the requirement and the potential of using 3D representation to visualize properly the wireless cognitive network. We also performed preliminary test of our 3D visualization system using OpenGL graphic library to visualize the propagation of signal travelling in specific room with several medium. The test has been conducted in order to understand the requirement of wireless cognitive network in 3D visualization before the actual system is built.
Keywords-signal propagation; wireless cognitive network, visualization, virtual environment
I. INTRODUCTION
The process of designing the wireless system in closed-area place such as office buildings and shopping complex still remains the big challenge [1-2]. The wireless network planning much be carefully planned before the placement of access point or router. However, prediction of signal propagation in different environments is somehow quite hard to be implemented in various type of environments eventhough it using the same topology of wireless network planning. The ultimate goal of propagation modelling is to find the suitable and fairness way of acceptable performance of based on their signal strength. From the 3D visualization of propagation modeling, if the simulation can simulate the effective and efficient ways of router and access point placement, the outcome can become much more better where it can dramatically decrease cost of using too many router and access points. If it is not, then the entire network must be redesigned and rebuilt in order to fit the requirement set up by the various constraint.
In general, the fundamental task of propagation modeling is to find the suitable location of router and access point carefully, so it can covered most of the area within the buildings according to user needs. The problem may exists later on after we realize the quantity of routers that needs to be installed
inside or outside the building. The longerity of the router life is depend based on cost contraint. Regrettably, the problem is not always traight as it depends on various constraint of the building itself or rather the office management on construction site and equipment used. Given that there is many different parameters that always keep on changing, simplex approximation based on just finding the suitable place and numbers of router are not enough. Modern building are build by different types of materials that later on will be equiped with new office furniture which definitely bring huge impact to wireless network performance. The attenuation, refelections, multipath and other wireless network phenomena will increase the chance of using too much time just to modify the previously installed router.
The advantages of wireless network, e.g. no cables scattered through the compound, simple installation and the ability of the signal to be transmitted through doors and walls, has make it become popular everywhere [3-5]. Unfortunately, the process of wireless network design and deployment still remain a big challenge [6]. Although proper prediction of signal propagation based on site-specific information and positioning of access points/routers have been carried out during planning stage, the performance of the designed wireless network is still not satisfy. This might due to the neglects of density and location of users within the wireless network during the design of signal propagation prediction phase. However, in real situation, this information is really useful in assisting the network to be re-optimized (maximize the Received Signal Strength (RSS) and throughput of a particular user at a specific location). An intelligent network, with the ability to self-access and optimize according to the actual situation in the network, is needed to satisfy the needs of the users.
II. 3DVISUALIZATION
The increasing requirement for 3D software has tremendously becoming one of the common interest among researcher to develop a 3D visualization tools in order to provide very efficient monitoring system for either individual or commercial purpose. System such as wireless networking [1-2, 7], health monitoring system, and other industrial related system that provides us with stunning 3D graphics tools to visualize most objects or environments. These tools helped them to understand better of the current situation without doing much works compared to the past time. In term of efficiency, it could produce one of the alternatives solutions to specific problems.
The current market for 3D visualization is extensively in rapid development where most of the country that produced game is increasing. Most of today games provide a unique environment using 3D visualization that will be capable of recreation of the real world on the regular personal computer. Game such as GTA IV, Modern Warfare 2, Midtown Madness, and thousands more produce very realistic virtual environment where become de factor of company to develop First Person Shooters (FPS) graphics engine. Almost every game, new technique of computer graphics is being introduced by provided new capabilities, allowing the birth of new 3D graphic tool that add various novel effects, such as particle effects, fog, colored lightning, as well as increase texture and polygon detail. Many games featured large outdoor environments, vehicles, advanced physics and many more.
Additionally, 3D graphic tool is continue to produce a very realistic object creation where almost all objects can be destructible based on predefine physics environments. This object can be deform, destroy, and response in physically way just like the real world behavior. This is also brought many researchers to put attention on collision detection between those object. The result of collision of the object will bring the physic response towards the object. Unreal 3 engine which is the most advanced 3D graphic tool for today market has become widely use among commercial use by various company in order to produce their own games. Their software have multiple and lot of functionality in order to create powerful virtual world with less storage requirement.
Figure 1: Screenshot form demo of Unreal 3 3D graphic tool; source: Epic Games Inc.
A foretaste of the look of the newest technologies is visible on the Figure 1, where the real-time rendered scene from the Unreal 3 3D graphic tool [2] is presented. As a result, this research intends to use the 3D graphic tool in order to visualize the corresponding wireless network in purpose of academic research and creation of realistic condition of wireless network in real world [8-10]. The general aim of this research is to come out with a 3D visualization of wireless network using 3D graphic tool that provide a realistic user experience while minimizing the time constraint in order to adjust the signal propagation.
III. WIRELESS COGNITIVE NETWORK OF 3DVISUALIZATION
The design of wireless system for wide area coverage where it consists at least 3 main points for router placement still remains the open problems for researchers to come out with good solution in terms of performance. Prediction of signal propagation from various sources of wireless router is very essential in order to main good quality of signal strength [11-14]. Consider there is wireless network install in a very big building where most people will be using wireless signal to surfing to the internet. Most of the users seems does not aware that the system that they are using is sometimes quite slow compare to its true performance of wireless networking [15]. If the management of the building does not carefully planning the allocation of those visitors or users that are currently using their internet access, most router that far from user will be abandon due to users mostly probably seat at the very convenience place to surf to the internet. This increase the problem of too many users accessing one router while other routers is not been use.
The main goal of propagation modeling or graphical modeling of wireless networking based on real-time data from router is to determine the effectiveness and the best coverage that can be simulated in virtual environment using 3D graphics. It simply to enhance the system so the monitoring of wireless networking will be more tolerated toward the user requirements. Hence, this research intends to increase the capability of monitoring wireless networking system in closed-area where most data is coming from both non and real time data in order to simulate the environment and adjust the entire network when it requires using artificial intelligence technique. This technique is called as wireless networking visualization using 3D graphical views based on real-time data application. The primary focus of this research is to helps increase the quality signal strength of wireless networking system without additional cost of using too much router on the same place.
Finally, complete content and organizational editing before formatting. Please take note of the following items when proofreading spelling and grammar:
IV. PLATFORM
• Pre-design: The process of building a prototype where user be able to see the possible wave propagation before actual system is built;
• Radio planning: Where user is designed and implemented the system;
• Optimization: Performed optimization or improvement over the previous 3D visualization method of wireless cognitive network;
• Evaluation, Analysis of real time data where the data that is received will be investigated its efficiency and reliability.
These areas can become flexible between each other and some areas are quite hard to find the difference. With multiple functions that might have in 3D visualization tool that will be developed, user is able to use them to conduct a research and data collection. For example, user can conduct radio coverage analysis, collect real-time data of signal propagation, check the quality of signal strength within specific areas, check for service availability and compare the measurement of signal prediction. Some extra functions might be implemented in the future or as extra features such as visualization of packet loss, determine the accuracy of triangulating location, and reporting any impact of signal propagation using mobile application.
V. IMPLEMENTATION OF 3DENVIRONMENTS
The implementation of 3D wireless network for our visualization system especially wireless networking design starts by integrating the environments. By using 3D grid system, we could define our environment according to user requirement that can be adjusted into suitable size of the room. The size of the grid itself also can be defined by user. Figure 3 shows the corresponding grid system in 2D dimension and Figure 4 shows the 3D view.
Figure 3 2D Grid System in 3D Visualization
Figure 4 3D Grid System in 3D Visualization
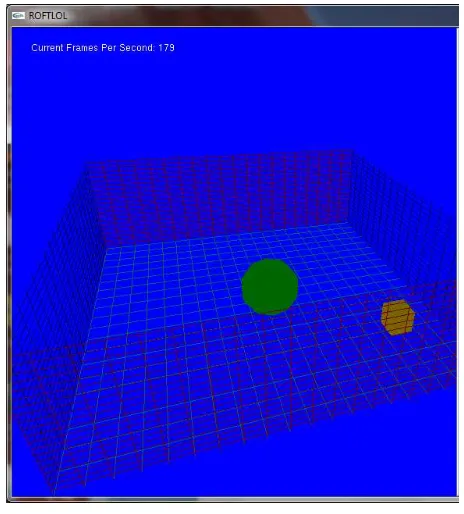
From the Figure, we have developed our environment using OpenGL and C++ programming. The next implementation starts by inserting few routers and PCs according to the user requirement. In this implementation, however, we put only one router and one PC for visualization purpose only. The box represents the PC location that can be changed while the sphere represents the router. Figure 5 depicts the whole environments with some menu to change the location of the router.
Figure 5 Implementation of router and PC location within the 3D environment.
Figure. 2 3D Visualization of Urban environment by ElHakim that could represent wireless networking in 3D environment [2].
For the router algorithm for signal propagation, the following algorithm and formula will be inserted into our program in order to visualize the condition of wireless networking. The theoretical pattern of wireless networking system is depicts at figure 6.
Where
• where Gt and Gr = Antenna Gain of Transmitting and Receiving
• λ = wavelength
• R = distance
Figure 6 Signal propagation coverage [16]
VI. CONCLUSION AND FUTURE WORK
This research is still in ongoing process where we will continue with analysis of wireless networking using our 3D visualization system. With the above system come into the development process, we believed that our tool is suitable to use in order to visualize the wireless networking more interactively. The construction of purpose system is still carried out by our researcher to provide very efficient tool either for individual use or commercialization use.
ACKNOWLEDGEMENT
We would like to thank for Universiti Teknikal Malaysia Melaka for the Short Term Grant for Vot S00903.
REFERENCES
[1] Y. Wang, et al., "2D/3D Web Visualization on Mobile Devices," in Web Information Systems – WISE 2006. vol. 4255, K. Aberer, et al., Eds., ed: Springer Berlin / Heidelberg, 2006, pp. 536-547.
[2] R. ElHakim and M. ElHelw, "Interactive 3D visualization for wireless sensor networks," The Visual Computer, vol. 26, pp. 1071-1077, 2010. [3] A. Ephremides, "Wireless networking," in Computers and
[4] K. Pahlavan, et al., "Trends in local wireless networks," Communications Magazine, IEEE, vol. 33, pp. 88-95, 1995.
[5] O. Spaniol, "The evolution of wireless networking: conformance or conflict with the OSI reference model?," in Personal, Indoor and Mobile Radio Communications, 1994. Wireless Networks - Catching the Mobile Future., 5th IEEE International Symposium on, 1994, pp. 786-793 vol.3. [6] J. Colandairaj, et al., "Understanding wireless networked control
systems through simulation," Computing & Control Engineering Journal, vol. 16, pp. 26-31, 2005.
[7] E. L. Mal\, et al., "Interactively combining 2D and 3D visualization for network traffic monitoring," presented at the Proceedings of the 3rd international workshop on Visualization for computer security, Alexandria, Virginia, USA, 2006.
[8] M. Marciniak, "Towards broadband global optical and wireless networking," in Transparent Optical Networks, 2004. Proceedings of 2004 6th International Conference on, 2004, pp. 13-16 vol.2.
[9] L. Jin-Shyan, "An experiment on performance study of IEEE 802.15.4 wireless networks," in Emerging Technologies and Factory Automation, 2005. ETFA 2005. 10th IEEE Conference on, 2005, pp. 8 pp.-458. [10] S. Weinstein, "Future wireless networks and R∧D agendas," in
Emerging Technologies: Frontiers of Mobile and Wireless
Communication, 2004. Proceedings of the IEEE 6th Circuits and Systems Symposium on, 2004, pp. I-11 Vol.1.
[11] Y. Yu, et al., "SNAMP: A Multi-sniffer and Multi-view Visualization Platform for Wireless Sensor Networks," in Industrial Electronics and Applications, 2006 1ST IEEE Conference on, 2006, pp. 1-4.
[12] H. Yuxi, et al., "The Implementation of Wireless Sensor Network Visualization Platform Based on Wetland Monitoring," in Intelligent Networks and Intelligent Systems, 2009. ICINIS '09. Second International Conference on, 2009, pp. 224-227.
[13] S. S. Fisher, "Environmental media: accessing virtual representations of real-time sensor data and site-specific annotations embedded in physical environments," in Virtual Systems and Multimedia, 2001. Proceedings. Seventh International Conference on, 2001, pp. 407-418.
[14] D. Goldsmith, et al., "Augmented Reality Environmental Monitoring Using Wireless Sensor Networks," in Information Visualisation, 2008. IV '08. 12th International Conference, 2008, pp. 539-544.
[15] G. Wei, et al., "View-Based 3D Model Transmission via Mesh Segmentation," in Multimedia and Expo, 2007 IEEE International Conference on, 2007, pp. 1311-1314.

![Figure 6 Signal propagation coverage [16]](https://thumb-ap.123doks.com/thumbv2/123dok/573523.67945/4.595.52.307.71.561/figure-signal-propagation-coverage.webp)
