International Journal of Computer Trends and Technology (IJCTT) – volume 5 number 2–Nov 2013
ISSN: 2231-2803
http://www.ijcttjournal.org
Page 80
Deployment and Evaluation of a Multi-Hop
Wireless Network
Fakrulradzi Idris
#1, Norlezah Hashim
*2 #1Lecturer, Faculty of Electronics and Computer Engineering, Universiti Teknikal Malaysia Melaka (UTeM), Malaysia
*2Teaching Engineer, Faculty of Engineering Technology, Universiti Teknikal Malaysia Melaka (UTeM), Malaysia
Abstract— Multi-hop wireless network uses two or more wireless hops to send information from source to destination. This paper presents the design and deployment of multi-hop wireless network testbed in Universiti Teknikal Malaysia Melaka (UTeM). While using the testbed to provide additional WiFi coverage around the cafeteria area in UTeM Industrial Campus, real-time measurements of various key parameters are carried out. This paper also provides some technical details of the testbed implementation as well as performance evaluation of network coverage, signal strength and connectivity. Performance of network throughput and effect of difference channel allocations are also presented.
Keywords— Multi-hop wireless network, testbed, network performance.
I. INTRODUCTION
Multi-hop wireless networks (MWN) utilize multiple wireless nodes to provide coverage to a large area by forwarding and receiving data wirelessly between the nodes. Multi-hop wireless networks offer an extremely cost effective and easily deployable access alternative. Potential examples of this is for municipal networks, building networks, in malls, hotels, and apartment blocks, where wireless links are used as relays between individual consumer devices and a wired point of presence, eliminating the need for expensive wiring and maintenance.
Research works on multi-hop wireless networks have been extensive whether using simulator such as Network Simulator 2 [1] and OPNET [2] or network testbed [3]-[7]. Although simulation is an important approach for network protocol design, multi-hop networks are more complicated in a real scenario. Real world test bed implementations for multi-hop wireless networks are very significant and will provide strong support applications such as VoIP and video streaming.
In this paper, the design, deployment and evaluation of multi-hop wireless network testbed in Universiti Teknikal Malaysia Melaka (UTeM) will be discussed. In this project, we focus on the deployment scenario which is specific to campus environment. Results on the network connectivity, coverage and effect of throughput with different frequencies for this network are presented.
The rest of the paper is organized as follows: Section 2 briefly describes multi-hop wireless networks, followed by testbed implementation for the MWN in section 3. Test methodologies are described in Section 4. The results obtained
are discussed in Section 5. Finally, the conclusions of the study are given in Section 6.
II. MULTI-HOP WIRELESS NETWORKS
In multi-hop wireless networks, there are at least one or more intermediate nodes along the path that received and forward packets from source to destination. Multi-hop wireless networks have several benefits such as can extend the coverage and improve connectivity. Data transmission over multiple short links might require less transmission power and more energy efficient than that required over long links [8] Multi-hop wireless networks can be deployed in a cost effective way and required less deployment of network cables. For a dense multi-hop networks, there are many paths available in which can increase the robustness of the network.
In wireless multi-hop network, nodes do not need for common infrastructure and can communicate with each other using wireless channels. The communication between nodes can be achieved by forwarding or relaying each other’s packets.
III.TESTBED IMPLEMENTATION
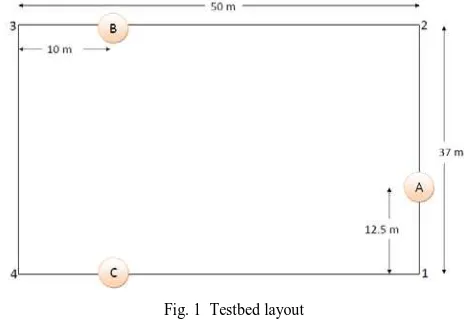
The testbed [9] location is at UTeM Industrial Campus cafeteria. Fig. 1 shows the layout of the cafeteria and the location of access points.
Fig. 1 Testbed layout
International Journal of Computer Trends and Technology (IJCTT) – volume 5 number 2–Nov 2013
ISSN: 2231-2803
http://www.ijcttjournal.org
Page 81
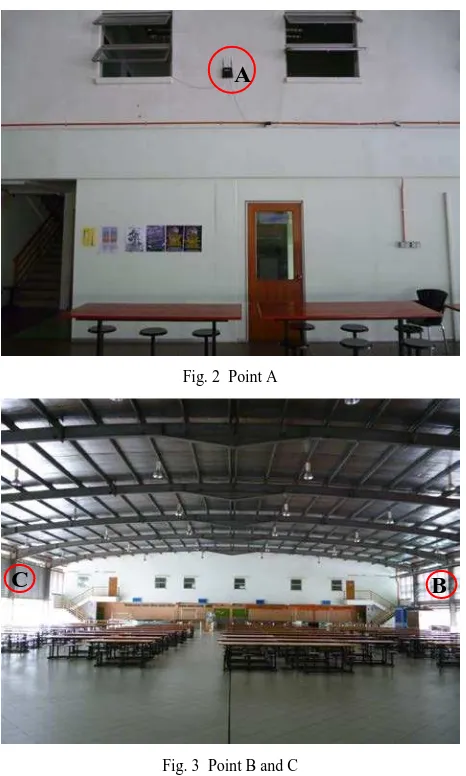
Fig. 2 Point A
Fig. 3 Point B and C
Each MAR is located at specific distance in order to widen the coverage of wireless network. The network configuration of the testbed is shown in Fig. 4.
Fig. 4 Network configuration
Inside each MAR, there are two wireless radio interfaces which are designated as ath0 and ath1. MAR_A is connected to Internet via Ethernet interface and act as the gateway. In MAR_A, ath0 is assigned to use channel 1 so that it can be connected to the second network interface of MAR_B that is ath1 which is also using channel 1. Then, the first channel of
MAR_B is assigned to be in channel 6 and connected to the second network interface, ath1 of MAR_C that is also assigned to be in channel 6. The MAR_B will enable the connection between MAR_C and MAR_A thus creating the multi-hop network. The configuration of each access point is performed using telnet application in Ubuntu 11.04 operation system. Transmit power of each access point was set to maximum value of 16dBm.
IV.METHODOLOGY
Before making any measurement, several configurations for signal strength, connectivity, channel profile and throughput test need to be implemented in order to get desired result.
A. Coverage Test Setup
After all the MARs were deployed, coverage test are performed by walking around the testbed area and using laptop equipped with Ekahau HeatMapper [11]. Overall parameter for testbed area is 50m x 37m.
B. Signal Strength Measurement Setup
In order to measure the Received Signal Strength Indication (RSSI) for each deployed MAR, inSSIDer [12] is used. InSSIDer can be used to monitor the RSSI value for 2.4GHz or 5GHz channel. Using this software, we can observe the condition of the channel in the testbed area, whether overlapping or not. Based on Fig.1 there are 4 points for test location. The laptop installed with inSSIDer is left for a while at each of the location in order to get stable measurement of RSSI value.
C. Connectivity Test Setup
The easiest way to test the connectivity of the network is by using 2 laptops which one act as a client and the other as a server. For first test, the ping test between laptop and access point will be done to ensure there are connectivity in the multi-hop network. A Laptop is connected wirelessly to MAR_C and ping test to MAR_A and to MAR_B are performed. The multi-hop network will be successfully established if there are connectivity between MAR_A and MAR_C. Besides that, ping test from client to client and also from client to server will be done. The server is always stationary and connected to MAR_A.
D. Throughput Measurement Setup
The TCP throughput measurements are performed using the Iperf [13] traffic generator and measurement tool. Using a dedicated script, Iperf could be launched from Ubuntu terminal application. The results for throughput will be taken from the average value of throughput automatically measured by Iperf. The client node send TCP windows packet of 16Kbytes to the server node which is connected to MAR_A. The location for server node is fixed while the client node is positioned accordingly to create 1, 2 or 3 hops. In our definition, single hop configuration occur when a client node connected to MAR_A, 2 hops is when client node connected to MAR_B and while 3 hops occur when the client node connected to
A
International Journal of Computer Trends and Technology (IJCTT) – volume 5 number 2–Nov 2013
ISSN: 2231-2803
http://www.ijcttjournal.org
Page 82
MAR_C. The setup for this throughput measurement is shown in Fig. 5.
Fig. 5 Throughput test setup
V. RESULTS
A. Coverage
The deployed multi-hop network was able to provide coverage over the cafeteria area and it surrounding. The coverage map at the cafeteria was captured using Ekahau HeatMapper. The software indicates the signal coverage of the access point by heat color. The signal is excellent at area where dark green color is shown while the coverage is poor at area by indicated by red color. In the cafeteria, the minimum heat color shown by the software is in light green, approximately between -50dBm to -60dBm.
B. Signal Strength
The signal strength of each MAR was measured at four points as in Fig. 1. At point 1, the RSSI readings recorded were between -56dBm to -61dBm while at point 2, the reading were between -57dBm to -61dBm. Meanwhile at point 3 where the nearest MAR is MAR_B, the highest signal recorded was -34dBm while the signal strength of MAR_A and MAR_B were between -53dBm to -56dBm. At point 4, the RSSI value were between -50dBm to -60dBm. Overall, the measured RSSI were in the good magnitude which is sufficient to support the highest data rate (54Mbps) or modulation and coding scheme of WiFi (64QAM3/4).
C. Connectivity
We performed ping test between the MARs to ensure the packet can be routed from one to another. The average round trip time from MAR_A to MAR_B is 2.116ms, which is very small since both MARs only one hop distance. Meanwhile, the average round trip time from MAR_A to MAR_C is 4.226ms. The round trip time increased because MAR_A needs to forward the packets through MAR_B before reaching MAR_C. For both ping tests, there is no packet loss occurred.
Next we performed ping test from client to client. A fix client is connected to MAR_A and located about 3m away. Then, ping test is done from clients associated with MAR_B and MAR_C to the client associated with MAR_A. From the
observation, the time interval is slightly changed as the packet transmitted from client associated with different MARs to a fixed client. Similar to the previous test, there is no packet loss occurred.
D. Throughput Performance
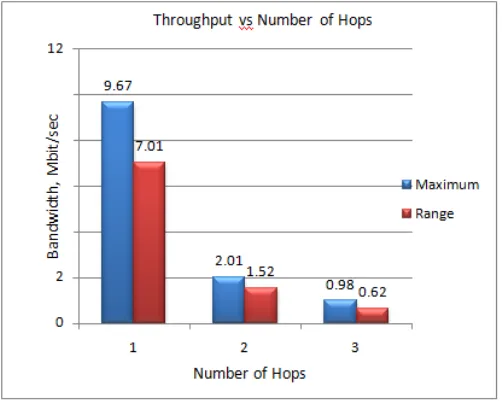
Fig. 6 shows two types of throughput measurement for this wireless multi-hop network.
Fig. 6 Throughput performance
For maximum possible throughput, the client is located at close proximity to the MAR. The throughput is inversely proportional to the number of hops. The throughput value drops for more than 50% as the number of hops increased. For range throughput test, in which the client move 25m – 30m away from the MARs, the throughput value are decreasing due to the weaker signal strength received. Compared to maximum throughput test, the throughput value for first hop, two hops and three hops decreased approximately 27%, 24% and 37% respectively. From this percentage, it is indicated that the distance of a client from the MARs affected the throughput for this multi-hop network.
E. Effect of different channel allocation
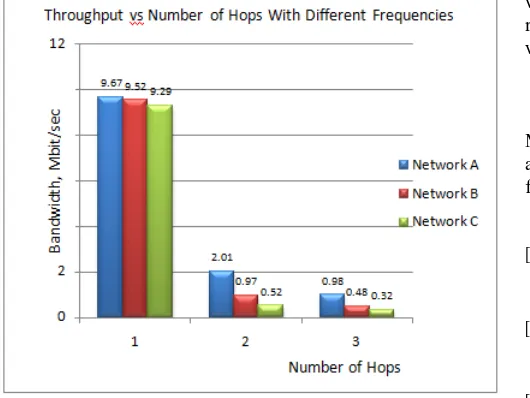
Fig. 7 shows the throughput performance when different channels were assigned to the MARs as in Table I.
TABLEI CHANNEL ASSIGNMENT
MARs
Network
Channel
A B C
MAR_A 1 2 7
MAR_B 6 5 8
International Journal of Computer Trends and Technology (IJCTT) – volume 5 number 2–Nov 2013
ISSN: 2231-2803
http://www.ijcttjournal.org
Page 83
Fig. 7 Throughput for different channel allocation
Similar with previous test, the throughput performance for the multi-hop network using different channel allocation experienced a significant decrease as the number of hop are increased.
For two hops configuration, the packet forwarding from MAR_A to MAR_B introduces additional delays which cause the throughput to decrease. It is also shows that the three hops configuration experience lower throughput because MAR_B need to relay the traffics to client associated with MAR_C.
The lowest throughput recoded for each number of hop configuration for Network C since adjacent frequencies are used. The larger overlapping channel gives a huge impact to the throughput value. The radio frequency (RF) overlapping between MARS affects the performance of the multi-hop network.
VI.CONCLUSIONS
In this work, we have deployed a multi-hop wireless network testbed and analyze its performance. The results show that three MARs are sufficient to provide the signal strength required for the highest data rate (54Mbps). However, the highest throughputs are obtained when non-overlapping channel 1, 6 and 11 are used. For future work, MARs equipped with two radio interfaces; 2.4GHz and 5GHz will be used to reduce the interference from channel overlapping as
well as to increase the throughput of the network. The 5GHz radio can be used as backhaul connection between MARs while the 2.4GHz radio can be used for user access.
ACKNOWLEDGMENT
The authors would like to acknowledge Universiti Teknikal Malaysia Melaka (UTeM) for funding this work. We would also like to thank Mohd Zul Azri and Mohamad Faris Rahmat for supporting this work.
REFERENCES
[1] Bing Qi; Fangyang Shen, "Propagation Models for Multi-hop Wireless Networks in Ns-2 Simulator," Information Technology: New
Generations (ITNG), 2011 Eighth International Conference on , vol.,
no., pp.701-706, 11-13 April 2011.
[2] Srivatsa, A.M.; Jiang Xie, "A Performance Study of Mobile Handoff Delay in IEEE 802.11-Based Wireless Mesh Networks,"
Communications, 2008. ICC '08. IEEE International Conference on ,
vol., no., pp.2485-2489, 19-23 May 2008.
[3] Hamidian, A.; Palazzi, C.E.; Chong, T.Y.; Navarro, J.M.; Korner, U.; Gerla, M., "Deployment and Evaluation of a Wireless Mesh Network,"
Advances in Mesh Networks, 2009. MESH 2009. Second International Conference on , vol., no., pp.66-72, 18-23 June 2009.
[4] Benyamina, D.; Hafid, A.; Gendreau, M., "Wireless Mesh Networks Design — A Survey," Communications Surveys & Tutorials, IEEE , vol.14, no.2, pp.299-310, Second Quarter 2012.
[5] Xiang Zhang; Wenyong Wang; Lisheng Huang, "Testbed for Multi-Hop Ad hoc Network in IEEE 802.11 Wireless Environment," Wireless
Communications Networking and Mobile Computing (WiCOM), 2010 6th International Conference on , vol., no., pp.1,5, 23-25 Sept. 2010.
[6] Serrano, P.; Bernardos, Carlos J.; de la Oliva, A.; Soto, I., "Lessons learned from the deployment of a multihop IEEE 802.11g testbed using COTS devices," Wireless Conference (EW), 2010 European , vol., no., pp.667,674, 12-15 April 2010.
[7] Winkler, M.; Palazzo, C.; Bartolozzi, M., "TCP Throughput Measurements and Analysis in Wireless Multi-Hop Networks,"
Communications and Vehicular Technology in the Benelux, 2007 14th IEEE Symposium on , vol., no., pp.1,6, 15-15 Nov. 2007.
[8] Torsten Braun, Andreas Kassler, Maria Kihl, Veselin Rakocevic, Vasilios Siris, Geert Heijenk, “Multihop Wireless Networks,” Traffic and QoS Management in Wireless Multimedia Networks, Lecture Notes in Electrical Engineering Volume 31, 2009, pp 201-265. [9] Rahmat, F.; Idris, F.; Azri, M.; Kanathasan, V.; Sarimin, N.; Mohamad,
M.H., "Performance analysis of VoIP in Multi-hop Wireless Network,"
Applied Electromagnetics (APACE), 2012 IEEE Asia-Pacific Conference on , vol., no., pp.51,55, 11-13 Dec. 2012.
[10] The MIMOS website. Available: http://www.mimos.my
[11] The Ekahau website. Available:
http://www.ekahau.com/products/heatmapper/overview.html
[12] The MetaGeek website. Available: