Artificial Immune System based on Hybrid and
External Memory for Mathematical Function
Optimization
David F. W. Yap*
Faculty of Electronic and Computer Engineering, Universiti Teknikal Malaysia Melaka (UTeM), Hang Tuah Jaya,76100 Durian Tunggal, Melaka, Malaysia.
S. P. Koh, S.K.Tiong College of Engineering, Universiti Tenaga Nasional (UNITEN), Km 7, Kajang-Puchong Road, 43009 Kajang, Selangor
Darul Ehsan, Malaysia.
Abstract—Artificial immune system (AIS) is one of the nature-inspired algorithm for optimization problem. In AIS, clonal selection algorithm (CSA) is able to improve global searching ability. However, the CSA convergence and accuracy can be further improved because the hypermutation in CSA itself cannot always guarantee a better solution. Alternatively, Genetic Algorithms (GAs) and Particle Swarm Optimization (PSO) have been used efficiently in solving complex optimization problems, but they have a tendency to converge prematurely. Thus, a hybrid PSO-AIS and a new external memory CSA based scheme called EMCSA are proposed. In hybrid PSO-AIS, the good features of PSO and AIS are combined in order to reduce any limitation. Alternatively, EMCSA captures all the best antibodies into the memory in order to enhance global searching capability. In this preliminary study, the results show that the performance of hybrid PSO-AIS compares favourably with other algorithms while EMCSA produced moderate results in most of the simulations.
Keywords-component: clonal selection, antibody, antigen, affinity maturation, mutation.
I. INTRODUCTION
Optimization problem has been a challenge to many researchers in order to find the best local searching method. This problem also leads to a branch of knowledge which is the evolutionary computing. The methods were greatly influenced by nature. Few decades ago, many methods have been developed, for instance, GA, PSO or Artificial Immune System (AIS). In this study, the hybrid CSA and modified CSA are evaluated in comparison to conventional CSA and other evolutionary algorithms such as PSO and GA. These algorithms are described in the following paragraphs.
PSO was originally proposed by Kennedy and Eberhart [1]. The PSO is inspired from social behavior of individual organisms living together in groups [2]. Each individual in a group imitates other groups that are better, in order to improve its own group.
GA was inspired from a set of chromosome where each chromosome represents an individual solution (genes). The GA uses a search technique where genes in the population are improved across generation through a set of operation. During
each generation, the genes go through the process of selection, cross-over and mutation [3].
AIS is one of the nature-inspired approach in solving the optimization problem. The AIS is greatly reinforced by the immune system of a living organism such as human and animal. In humans, the immune system is responsible in maintaining stability of the physiological system such as protection from pathogens. In AIS, CSA is able to improve global searching ability as it uses the principle of clonal expansion and affinity maturation as the main forces of the evolutionary process [4]
In this research, the hybrid PSO-AIS and EMCSA are studied to improve the performance of diversity and convergence that are responsible in finding the global solution of single objective function. The ease of implementation is sustained in both of the proposed algorithms.
II. PSO, GA AND AIS ALGORITHMS
Particle Swarm Optimization
The PSO algorithm starts with a group of random particles that searches for optimum value for each updated generation. The ith particle is denoted as Xi = (xi1 , xi2 , xi3, ..., xin). During
generation updating, each particle is updated by ensuing two best values. These values are the best solution (mbest) and the global best value (gbest) that has been obtained by particles in the population at particular generation. With the inclusion and inertia factor ω, the velocity equations are shown in Eqs. (1) and (2).
1 1 () ( ) 2 () ( )
i i i i i i
v+ =vω α+ ⋅rnd ⋅ mbest −x +α ⋅rnd ⋅ gbest −x (1)
1
i i i
x+ =x +v (2)
Where rnd() is a random number between 0 and 1, α1and α2
are learning factors to control the knowledge and the neighbourhood of each individual respectively. The PSO algorithm is described in the following steps.
Step Process
1 Generate initial random particle swarms assigned with its random position and velocity
2 Compute the fittest value of N particles according to fitness function 3 Update values of the best position of each particle and the swarm
4 Update the position and velocity for each particle according to equation 1 and 2
5 Repeat steps 3 and 4 until pre-defined stopping condition is achieved
Genetic Algorithm
As described earlier, GA uses three main processes i.e. selection, crossover and mutation to improve genes through each generation. The selection process uses the objective function to assess the quality of the solution. Then, the fittest solutions from each generation are kept. The function of crossover generates new solutions given a set of selected members of the current population. In the crossover process, genetic material between two single chromosome parents is exchanged. After that, mutation triggers sudden change in the chromosomes unexpectedly. However, the mutation process is expected to avoid genes from trapping in local minima by adding random variables. The GA algorithm is described in the following steps.
Step Process
1 Generate initial random population of individuals
2 Compute the fittest value of each individual in the current population
3 Select individuals for reproduction
4 Apply crossover and mutation operators
5 Compute the fittest value of each individual
6 Select the best individuals to generate new population
7 Repeat steps 3 to 6 until pre-defined stopping condition is achieved
Artificial Immune System
The biological immune system has been modeled into AIS for engineering application. In AIS, CSA was inspired from the fact that only antibodies (Abs) that are able to recognize antigens (Ags) are selected to proliferate. The selected Abs then enters the affinity maturation process. The algorithm was verified to be capable to solve complex problem such as multi-modal and combinatorial optimization [5].
The clonal selection theory describes how Abs detects the Ags and proliferates by cloning. As shown in Fig. 1, the immune cells will reproduce against the Ags. The new cloned cells are then differentiated into plasma cells and memory cells. The plasma cells produce Absand go through mutation process to promote genetic variation. The memory cells are responsible for future Ags invasion. Finally, the selection mechanism keeps the Abs with the best affinity to the Ags in the next population [4]. The CSA pseudocode is described in the following steps.
Step Process
1 Generate an initial random population of antibodies, Abs
2 Compute the fittest value of each Ab according to fitness function
3 Generate clones by clonning all cells in the Ab population
4 Mutate the clone population to produce a mature clone population
5 Evaluate the affinitiy value for each clone population
6 Select the best Ab to compose the new Ab population
7 Repeat steps 2 to 6 until a pre-defined stopping condition is achieved
Figure 1. Clonal Selection Principle [4]
Hybrid PSO-AIS
AIS have the advantage to prevent the population from being trapped into local optimum. Besides, PSO has the ability to improve itself but tend to converge prematurely [6]. Therefore, the combination between PSO and AIS (PSO-AIS) is expected to improve the global search ability and avoid being trapped in local minima even though the population size is relatively small. Hence, the hybrid PSO-AIS pseudocode is described in the following steps.
Step Process
1 Select the best particles from PSO to be half of AIS initial population, N1
2 Generate randomly other half of initial population of Abs,N2 3 Combine N1and N2 and compute fittest values of each Ab
4 Generate clones by cloning all cells in Ab population
5 Mutate the clone population to produce a mature clone population
6 Evaluate the affinity value for each clone in the population
7 Select the best Ab to compose the new Ab population
8 Repeat steps 4 to 7 until pre-defined stopping condition is achieved
EMCSA
times [7, 8], and the hypermutation process cannot always guarantee that the next generation will provide better solution. The stochastic factor (randomization) at times can even produce worse result from previous solution. Therefore, N
number of the best Abs from the previous generation are kept in the external memory database and then combined with the initial random Abs of the next generation to compose a new population for that next generation. Thus, the good Abs of every generation that are stored in the database will keep on growing until the last generation. Finally, on the last generation, all the good Abs that are kept in the database from the previous generations are combined with the Abs of the last generation. Moving forward, when new Ags are required to be detected, the external memory database would be very useful to speed up the performance. The pseudocode of EMCSA is shown as below.
Step Process
1 Generate an initial random population of antibodies, Abs
2 Combine Abs with Abext (if any)
3 Compute the fittest value of each Ab according to fitness function
4 Generate clones by clonning all cells in the Ab population
5 Mutate the clone population to produce a mature clone population
6 Evaluate the affinitiy value for each clone population
7 Select the best Ab, N, to compose the new Ab population 8 Save a range of good Abs Next into external memory, Abext
9 Repeat steps 1 to 8 until a pre-defined stopping condition is achieved
All methods described above are evaluated using nine mathematical test functions. The termination criteria for all methods will be met if minimum error value is achieved or maximum number of evaluation allowed is exceeded.
III. EXPERIMENTS ON TEST FUNCTION
The computing platform used for the experiment is AMD Phenom 9600B Quad-Core CPU running at 2.30 GHz, 2GB of RAM and Windows Vista Enterprise operating system. Each algorithm is evaluated based on 500 iterations. The minimum error is set as 1e-25. The population size P0is set to 20.
In the EMCSA, a total of five antibodies, Abext, from every
iteration would be stored into the external memory. However, the maximum number of antibodies that can be kept in the memory is fixed to only 50 antibodies. Thus, whenever the memory size have reached 50 antibodies, the worst five would be removed from the memory and replaced with the current Abext. This is repeated until a pre-defined stopping condition is
achieved.
The CSA, EMCSA, PSO, PSO-AIS and GA algorithms are evaluated using nine benchmark functions (objective functions) which are described as follows.
1. Rastrigin’s Function (TF1) :
Rastrigin’s function is mathematically defined as follows.
(
)
(
2)
1
1
( ) 10 cos 2 10
n
i i
i
f x x πx
=
=
∑
− + (3)where −5.12≤xi ≤5.12, i = 1. . . ,n
and global minimum is located at the origin and its function value is zero.
2. De Jong’s Function (TF2):
De Jong’s function is mathematically defined as follows.
2 2
1
( ) n
i i
f x x
=
=
∑
(4)where −5.12≤xi ≤5.12, i = 1. . . ,n
and global minimum is located at the origin and its function value is zero.
3. Axis Parallel Hyper-ellipsoid Function (TF3):
Axis parallel hyper-ellipsoid function is mathematically defined as follows.
2 3
1
( ) n
i i
f x i x
=
=
∑
i (5)where −5.12≤xi ≤5.12, i = 1. . . ,n
and global minimum is located at the origin and its function value is zero.
4. Rosenbrock’s Function (TF4):
Rosenbrock’s function is mathematically defined as follows.
(
)
(
)
1
4
1
2 2
2 1
( ) 100
1
n
i
i i i
f x
x
x
x
−
=
+
=
∑
i−
+
−
(6)where −2.048≤ xi ≤2.048, i = 1. . . ,n
and global minimum is located at the origin and its function value is zero.
5. Sum of Different Power Function (TF5):
Sum of different power function is mathematically defined as follows.
( )
5
1
1 ( )
n
i i i
f x
x
=
+
=
∑
(7)where − ≤1 xi ≤1, i = 1. . . ,n
and global minimum is located at the origin and its function value is zero.
6. Rotated Hyper-ellipsoid Function (TF6):
6
1
2
1
( ) n
i i
j j
f x
x
= =
=
⎛
⎜
⎞
⎟
⎝
⎠
∑
∑
(8)where −65.536≤xi ≤65.536, i = 1. . . ,n
and global minimum is located at the origin and its function value is zero.
7. Moved Axis Parallel Hyper-ellipsoid Function (TF7):
Moved axis parallel hyper-ellipsoid function is mathematically defined as follows.
2 7
1
( ) 5
n
i i
f x i x
=
=
∑
i (9)where −5.12≤xi ≤5.12, i = 1. . . ,n
and global minimum is located at the origin and its function value is zero.
8. Griewangk Function (TF8):
Griewangk’s function is mathematically defined as follows.
8
1
2
1
( )
cos
1
4000
n
i
n
i i
i
f x
x
x
i
= =
=
−
⎛ ⎞
⎜ ⎟
+
⎝ ⎠
∑
∏
(10)where −600≤xi ≤600, i = 1. . . ,n
and global minimum is located at the origin and its function value is zero.
9. Ackley Function (TF9):
Ackley’s function is mathematically defined as follows.
( )
9
2
1 1
1 1
0.2 cos 2
( ) 20 20
n n
i i
i i
x x
n n
f x e e
e
π
= =
−
= + −
∑
−
∑
(11)where −32.768≤xi ≤32.768, i = 1. . . ,n
and global minimum is located at the origin and its function value is zero.
IV. RESULT AND DISCUSSION
The results for the test functions are shown in Fig. 2 to 10 and Table I. For Rastrigin’s function, Fig. 2 shows that PSO suffers from premature convergence while GA and CSA are comparable in giving the fitness value. On the other hand, PSO-AIS and EMCSA performed moderately.
0 50 100 150 200 250 300 350 400 450 500 100
101 102
Number of evaluations
B
e
s
t F
it
n
es
s
(av
e
rage)
Best value : 2.10917 CSA
CSA UMCSA PSO PSO-AIS GA
Figure 2. Algorithms evaluation on Rastrigin’s function
0 50 100 150 200 250 300 350 400 450 500 10-8
10-6 10-4 10-2 100 102
Number of evaluations
B
e
s
t F
it
nes
s
(av
e
rage)
Best value : 6.13799e-007 CSA
CSA UMCSA PSO PSO-AIS GA
Figure 3. Algorithms evaluation on Dejong’s function
0 50 100 150 200 250 300 350 400 450 500 10-8
10-6 10-4 10-2 100 102
Number of evaluations
B
e
s
t F
it
nes
s
(av
e
rage)
Best value : 5.86174e-007 CSA
CSA UMCSA PSO PSO-AIS GA
Figure 4. Algorithms evaluation on Axis Parallel Hyper-ellipsoid function
CSA EMCSA PSO PSO-AIS GA
CSA EMCSA PSO PSO-AIS GA
0 50 100 150 200 250 300 350 400 450 500 100
101 102 103
Number of evaluations
B
e
s
t F
it
n
es
s
(av
e
rage)
Best value : 2.29104 PSO-AIS
CSA UMCSA PSO PSO-AIS GA
Figure 5. Algorithms evaluation on Rosenbrock function
0 50 100 150 200 250 300 350 400 450 500 10-8
10-6 10-4 10-2 100 102
Number of evaluations
B
e
s
t F
it
nes
s
(av
e
rage)
Best value : 4.60299e-007 CSA
CSA UMCSA PSO PSO-AIS GA
Figure 6. Algorithms evaluation on Sum Differential Power function
0 50 100 150 200 250 300 350 400 450 500 10-5
10-4 10-3 10-2 10-1 100 101 102
Number of evaluations
B
e
s
t F
it
n
es
s
(av
e
rage)
Best value : 1.81298e-005 CSA
CSA UMCSA PSO PSO-AIS GA
Figure 7. Algorithms evaluation on Rotated Hyper-ellipsoid function
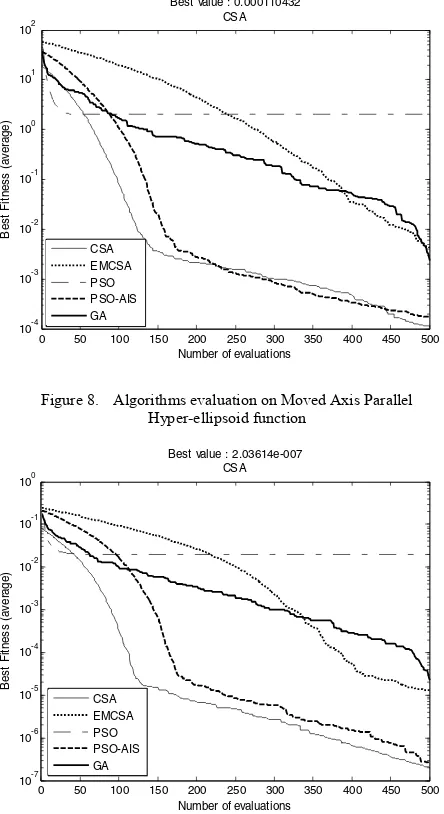
For fitness function of Figures 3, 4, 6, 7, 8 and 9, PSO again suffers from premature convergence while PSO-AIS and CSA are comparable in performance. The EMCSA only achieved moderate performance among all the algorithms.
Figure 5 shows that PSO-AIS outperformed other algorithms. The EMCSA is second best, followed by CSA. GA and PSO performed poorly where these algorithms converge very slowly.
0 50 100 150 200 250 300 350 400 450 500 10-4
10-3 10-2 10-1 100 101 102
Number of evaluations
B
e
s
t F
it
n
es
s
(av
e
rage)
Best value : 0.000110432 CSA
CSA UMCSA PSO PSO-AIS GA
Figure 8. Algorithms evaluation on Moved Axis Parallel Hyper-ellipsoid function
0 50 100 150 200 250 300 350 400 450 500 10-7
10-6 10-5 10-4 10-3 10-2 10-1 100
Number of evaluations
B
e
s
t F
it
n
es
s
(av
e
rage)
Best value : 2.03614e-007 CSA
CSA UMCSA PSO PSO-AIS GA
Figure 9. Algorithms evaluation on Griewangk function
The Ackley function in Fig. 10 shows that GA outperformed all other algorithms, followed by CSA. The rest of the algorithms, PSO, PSO-AIS and EMCSA performed poorly.
CSA EMCSA PSO PSO-AIS GA
CSA EMCSA PSO PSO-AIS GA CSA
EMCSA PSO PSO-AIS GA
CSA EMCSA PSO PSO-AIS GA
0 50 100 150 200 250 300 350 400 450 500 10-2
10-1 100 101
Number of evaluations
B
e
s
t F
it
n
es
s
(av
e
rage)
Best value : 0.0173093 GA
CSA UMCSA PSO PSO-AIS GA
Figure 10. Algorithms evaluation on Ackley function
Table I shows the mean and standard deviation value for nine test functions used, to evaluate the algorithms performance. The CSA outperformed all other algorithms in almost all of the test functions except TF4 and TF9. The algorithms that performed the best in TF4 and TF9 are PSO-AIS and GA respectively.
V. CONCLUSION
A hybrid PSO-AIS algorithm and an external memory-based clonal selection AIS algorithm were proposed. From initial simulation work done on both of the algorithms, the performance of PSO-AIS is comparable to CSA while EMCSA only achieved moderate performance among all the algorithms compared. More work would be done in tweaking certain parameters in EMCSA such as the memory allocation factor, best memory selection criteria or the number of best memory to be taken into consideration, in order to improve the performance of the algorithm.
Table I. Mean and Standard Deviation for each of the algorithm based on the given transfer function
Function CSA EMCSA PSO PSO-AIS GA
Mean Std Dev Mean Std Dev Mean Std Dev Mean Std Dev Mean Std Dev
TF1 2.10917 1.51617 5.58652 1.56830 12.1057 5.61802 4.8883 1.09404 2.1186 1.18767
TF2 6.1E-07 4.8E-07 9.5E-06 7.4E-06 0.11565 0.07709 8.2E-07 6.3E-07 0.00019 0.00014
TF3 5.9E-07 3.9E-07 1.56E-05 2.03E-05 0.12653 0.0811 6.9E-07 4.6E-07 0.00015 7.1E-05
TF4 4.48752 1.38984 4.00733 2.18162 11.414 3.75693 2.29104 1.304 6.05602 2.18913
TF5 4.6E-07 1.5E-07 2.9E-05 2.8E-05 0.13601 0.08611 7.4E-07 5.4E-07 0.00017 6.6E-05
TF6 1.8E-05 1.3E-05 0.0029 0.0016 1.7223 2.46831 3E-05 3.3E-05 0.00293 0.00165
TF7 0.00011 0.00011 0.0023 0.00075 1.9966 1.08895 0.00017 0.00033 0.00239 0.00075
TF8 2E-07 1.3E-07 1.24E-05 1.17E-05 0.0194 0.02263 2.6E-07 2.1E-07 2.2E-05 1.6E-05
TF9 0.12283 0.36299 1.6293 0.70439 1.33007 0.8346 1.47366 0.85525 0.01731 0.00304
ACKNOWLEDGMENT
The authors would like to thank Universiti Teknikal Malaysia Melaka and The Ministry of Higher Education Malaysia for the financial support under PJP/2009/FKEKK (20D) S614 and Fundamental Research Grant Scheme No. FRGS/2010/FKEKK/TK03/1 – F0085 respectively.
REFERENCES
[1] J. Kennedy and R. Eberhart, 1995. Particle Swarm Optimization. Proc. IEEE Int. Conf. Neural Networks, 4:1942-1948.
[2] J. Kennedy and R. Eberhart, 1995. Swarm Intelligence. 1st Edition. ,
Academin Press., San diego. CA.
[3] C. Emmeche, 1994. Garden in the Machine: The Emerging Science of Artificial Life. Princeton University Press, New Jersey, USA. [4] L. N. De Castro and J. Timmis, 2002. Artificial Immune System: A
New Computational Approach. Springer-Verlag, NewYork.
[5] A. Acan and A. Unveren, “A Memory-Based Colonization Scheme for Particle Swarm Optimization,” IEEE Congress on Evolutionary Computation, pp. 1965-1972, 2005.
[6] J. Vesterstrom and R. Thomsen, “A Comparative Study of Differential Evolution, Particle Swarm Optimization, and Evolutionary Algorithms on Numerical Benchmark Problems,” pp. 1980-1987.
[7] S. M. Garret, “How Do We Evaluate Artificial Immune System”, Evoluationary Computation, vol. 13, pp. 145-178.
[8] F. M. Burnet, 1969. The Clonal Selection Theory of Acquired Immunity. Cambridge University Press.
![Figure 1. Clonal Selection Principle [4]](https://thumb-ap.123doks.com/thumbv2/123dok/598820.71532/2.595.362.489.189.352/figure-clonal-selection-principle.webp)