EVALUATION PERFORMANCE OF EQUITY FUNDS BY SHARPE,
TREYNOR, JENSEN, MODIGLIANI, SORTINO, AND EROV
(Case Study Equity Funds Listed in Securities and Exchange
Commission (BAPEPAM) Period 2010
–
2012)
By:
Arfian Fidya Utama ID: 109081100003
MANAGEMENT DEPARTMENT INTERNATIONAL CLASS PROGRAM FACULTY OF ECONOMICS AND BUSINESSES STATE ISLAMIC UNIVERSITY SYARIF HIDAYATULLAH
i
EVALUATION PERFORMANCE OF EQUITY FUNDS BY SHARPE,
TREYNOR, JENSEN, MODIGLIANI, SORTINO, AND EROV
(Case Study Equity Funds Listed in Securities and Exchange
Commission (BAPEPAM) Period 2010
–
2012)
THESIS
Submitted to faculty of Economics and Business in Partial Recruirements for Acquiring the Bachelor Degree of Economics
By:
Arfian Fidya Utama ID: 109081100003
MANAGEMENT DEPARTMENT INTERNATIONAL CLASS PROGRAM FACULTY OF ECONOMICS AND BUSINESSES STATE ISLAMIC UNIVERSITY SYARIF HIDAYATULLAH
iii
CURRICULUM VITAE
PERSONAL DATA
Name : Arfian Fidya Utama
Date of Birth : Tangerang, March 26th 1991 Address : JL. Inpres VI / 29 RT/RW 001/001
Gaga,Larangan, Kota Tangerang
Religion : Islam
Phone : 0813-8641-5623
Email : [email protected]
EDUCATIONAL BACKGROUND 1. 1996 – 1997 : TK Al- fiah
2. 1997 – 2003 : SDN Kreo 4
3. 2003 – 2006 : SMP Negeri 11 Tangerang
4. 2006 – 2009 : SMA Hang Tuah 1 Jakarta
iv
ABSTRACT
The aim of the research is about the performance evaluation on equity funds based on Sharpe, Treynor, Jensen, Modigliani (M2), Sortino, and EROV measurement, it is also to explain the performance of equity funds (or investment funds) so it can be a consideration factor in the investment decision. To invest on equity funds, investors should be compare composition of knowing their investment policy and measurement of their performances.
The methods of measurement used in evaluating equity funds performances are 6 methods of Risk-Adjusted Ratio Performance Measures, they are The Sharpe Measurement (RVAR), The Treynor Measurement (RVOL), Jensen's Differential Return (Alpha), Modigliani (M2), Sortino, and Exceess Return on VaR (EROV). Coefficient determination is used to know which equity fund has the best diversification. The sample is in 44 mutual funds with 3 years periods from 2010 to 2012. Benchmark for equity funds is needed to be a performance comparison is JCI. The results based on 6 methods shows the different appraisals and ranks. However, in general, there's only one equity fund that has the best or optimal performance, which Is Panin Dana Maksima.
v
ABSTRAK
Tujuan dari penelitian ini adalah tentang evaluasi terhadap kinerja reksa dana saham berdasarkan Sharpe, Treynor, Jensen, Modigliani (M2), Sortino, dan pengukuran EROV, juga untuk menjelaskan kinerja reksa dana saham (atau dana investasi) sehingga dapat menjadi faktor pertimbangan dalam pengambilan keputusan investasi. Untuk berinvestasi di reksa dana saham, investor harus membandingkan mengetahui kebijakan komposisi investasi dan pengukuran kinerja mereka.
Metode pengukuran yang digunakan dalam mengevaluasi reksa dana saham adalah 6 metode Risk-Adjusted Pengukuran Kinerja, mereka adalah Sharpe (RVAR), Treynor (RVOL), Jensen (Alpha), Modigliani (M2), Sortino, dan Exceess Return On VaR (EROV). Koefisien determinasi digunakan untuk mengetahui reksa dana saham mana yang memiliki diversifikasi terbaik. Sampel adalah 44 reksa dana dengan periode 3 tahun 2010-2012. Benchmark untuk reksa dana saham yang dibutuhkan untuk menjadi perbandingan kinerja IHSG.
Hasil berdasarkan 6 metode menunjukkan penilaian yang berbeda dan jajaran. Namun, secara umum, hanya ada satu reksa dana saham yang memiliki yang terbaik atau optimal kinerja yang adalah Panin Dana Maksima.
viii
LIST OF CONTENNT
COVER PAGE IN ... i
SHEET STATEMENT AUTHENTICITY SCIENTIFIC WORKS ... ii
CURICULUM VITAE ... iii
ABTSRACT ... iv
ABSTRAK ... v
PREFACE ... vi
LIST OF CONTENT ...viii
LIST OF TABLE ... xi
LIST OF PICTURE ... xii
LIST OF APPENDIX ... xiii
CHAPTER I INTRODUCTION 1.1 Background ... 1
1.2 Problem Formulation ... 10
1.3 Purpose of The Research ... 10
1.4 The Benefits of This Research ... 11
CHAPTER II LITERATURE REVIEW 2.1 Investment... 13
2.1.1 Understanding Mutual Funds ... 13
2.1.2 Type of Investment ... 14
ix
2.2. Mutual Funds ... 16
2.2.1 Understanding Mutual Funds ... 16
2.2.2 Form, Nature, and Types Mutual Funds ... 18
2.2.2.1 Mutual Funds Based on Legal Forms ... 18
2.2.2.2 Mutual Funds Based on Character... 18
2.2.2.3 Mutual Funds by Type of Investment ... 21
2.2.3 Portfolio Management of Mutual Funds ... 23
2.2.4 Benefits of Mutual Funds ... 23
2.2.5 Mutual Funds Investment Risk ... 27
2.2.6 Mutual Fund Performance Measurement Model ... 31
2.2.7 Benchmark ... 38
2.3 Previous Research ... 38
2.4 Framework ... 42
2.5 Hypothesis ... 44
CHAPTER III RESEARCH METHODOLOGY 3.1 The Scope of Research ... 45
3.2 Sampling Methods ... 45
3.3 Data Collection Method ... 48
3.4 Data Analysis Methods ... 48
3.5 Theoritical Hypothesis ... 54
3.6 Research Operational of Variables ... 56
x
4.2 Analysis Performance of Equity Funds ... 69
4.3 Performance Comparisons Monthly Equity Funds with Risk-Adjusted Return Methods ... 92
4.4 Hypothesis Testing ... 98
4.4.1 Normality Test Data ... 99
4.4.2 Comparations Test Different Equity Funds Return with Benchmark Return ...101
4.4.3 Comparations Test The Result of Performance of Equity Funds By Measurement Model Index Sharpe, Treynor, Jensen, Modigliani, Sortino, and EROV ...102
CHAPTER V CONCLUSIONS AND IMPLICATIONS 5.1 Conclusion ...105
5.2 Implication ...106
RERFERENCES ...107
xi
LIST OF TABLE
Table 1.1 Type of NAV Mutual Funds on October 29th, 2010 ... 2
Table 1.2 Industrial Development of Mutual Funds 1996-2012 ... 5
Table 2.1 Summary of Previous Research ... 41
Table 3.1 Equity Funds to Study Sample ... 46
Table 3.2 Research Variable, Operational Definition and Formulation ... 62
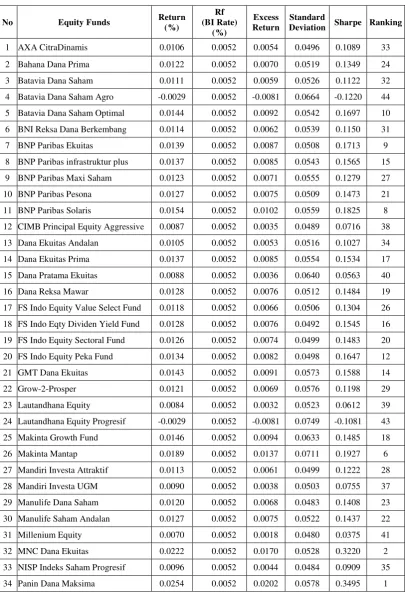
Table 4.1 Descriptive Statistics Average Monthly Equity Fund Indonesia Years 2010-2012 ... 66
Table 4.2 Performance Equity Funds Based Sharpe Ratio Method ... 71
Table 4.3 Performance Equity Funds Based Treynor Ratio Method ... 74
Table 4.4 Performance Equity Funds Based Jensen Alpha Ratio Method ... 78
Table 4.5 Performance Equity Funds Based Modigliani Index ... 82
Table 4.6 Performance Equity Funds Based Sortino Ratio Method ... 86
Table 4.7 Performance Equity Funds Based EROV Ratio Method ... 90
Table 4.8 Performance Comparisons Monthly Equity Funds with Six Model of Measurement Years January 2010 – December 2012 ... 92
Table 4.9 Testing by Kolmogorov-Smirnov Return of Equity Funds and Return Benchmark ... 99
Table 4.10 Kolmogorov-Smirnov Test Performance Measurement Model...100
Table 4.11 Result of Mann-Whitney Test ...101
Table 4.12 Kruskall-Wallis Test ...103
xii
LIST OF PICTURE
Picture 2.1 Framework ... 43
Picture 4.1 Best ten Sharpe Ratio Method ... 72
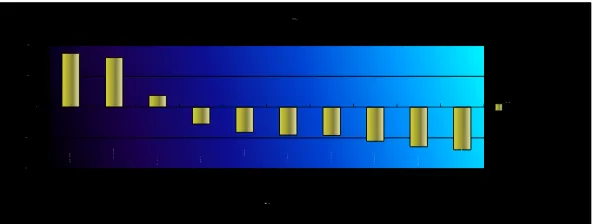
Picture 4.2 Best ten Treynor Ratio Method ... 76
Picture 4.3 Best ten Jensen Ratio Method ... 80
Picture 4.4 Best ten Modigliani Ratio Method... 84
Picture 4.5 Best ten Sortino Ratio Method ... 87
Picture 4.6 Best ten EROV Ratio Method ... 91
xiii
Table of Appendix
Appendix I List Sample of Equity Funds ...110
Appendix II Descriptive Statistic of Equity Funds ...112
Appendix III Comparisons Six Indicator Methods ...114
Appendix IV Risk Adjusted Method Six Indicators ...116
1 CHAPTER I
INTRODUCTION
1.1. Background
The economic situation in Indonesia is still not stable, people are faced with various options on how to invest their own funds in order to gain optimal results. In Indonesia there are a variety of investment options with varying degrees of risk and returns that can be given, but the obstacle is how to choose the right investments according with the ability of each investor because not all investors have the same knowledge, funds and time for each the investment choices.
Mutual fund is one of the alternative investments in the capital market for the society especially small investors. Mutual fund is designed as a place to collect funds from the society who has limited capital, knowledge and time. Mutual fund is the familiar instrument in the Indonesian capital market.
2 insturment, namely money market funds, fixed income funds, equity funds and balanced funds.
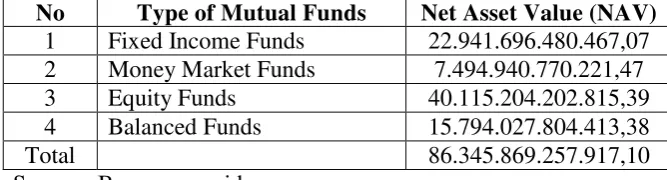
Each type of mutual fund has different cirteria. Fixed income funds 80 percent of its investment portfolio in effects in the form of debt securities such as bonds. Money market mutual funds portfolio investment in money market instruments such as SBI. Equity fund whose investment portfolio consists of stock. Balanced funds are investment instruments can be shaped stock and bonds or in combination with other instruments. Each type of mutual Funds also have different performance as seen from the Net Asset Value (NAV) any type of mutual fund. Performance for each type NAV of mutual fund seen from as at October 29th, 2010 that is registered with Securities and Exchange Commission (Bapepam) can be seen in Table 1.1 below:
Table 1.1
Type of NAV Mutual Funds on October 29th, 2010 No Type of Mutual Funds Net Asset Value (NAV)
1 Fixed Income Funds 22.941.696.480.467,07 2 Money Market Funds 7.494.940.770.221,47
3 Equity Funds 40.115.204.202.815,39
4 Balanced Funds 15.794.027.804.413,38
Total 86.345.869.257.917,10
Source : Bapepam.go.id
3 According Pratomo and Ubaidullah (2000:73), compared to money market mutual funds and fixed-income funds, equity funds providing growth potential for greater investment value, so does the risk. Equity funds become an attractive alternative for investors who understand the potential for long-term stock investments, so that the funds are used to invest in fund for long-term needs, investors should also understand and be willing to accept the risks that accompany investments.
4 conditions of Indonesia, the total NAV of mutual funds returned to growth. (Manurung, 2008: 10)
Development of mutual funds in recent years has increased making investors to participate in advancing the industry. mutual funds became popular and much in demand by investors, particularly small investors because mutual funds have many benefits and convenience offered, among others, the mutual fund is an alternative to diversify investments; income levels are usually higher than the interest rate time deposits; period the expected level of income as well as the risks that may arise can be tailored to the wishes and interests of the owner of the funds; professional investment managers because it is managed by a professional investment manager, and experienced in managing investment portfolios; Investors do not have to think or make their own analysis to sort out the type of portfolio, fairly deliver and receive the results. (Darmawi, 2006:203)
Development of mutual funds in Indonesia is relatively rapid due to some benefits invest in mutual fund. The benefits include lower transaction costs, high liquidity, investment diversification and is managed by professional management. The advantages making a lot of investors who have limited time, energy, and knowledge in the sector of investment in the capital market to prefer mutual funds rather than directly involved in the capital market.
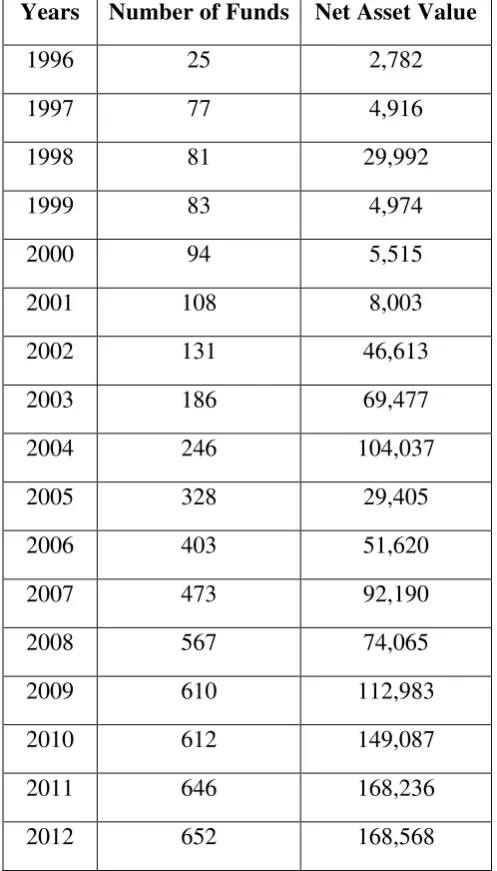
5 Table 1.2
Industial Development of Mutual Funds 1996-2012 Years Number of Funds Net Asset Value
1996 25 2,782
6 2012 occurred the highest NAV during the year 1996-2012 amount Rp.168.568 Trillion. This phenomenon showed that the NAV in mutual funds has increased and decreased which shows instability on the performance of mutual funds each year suspected because of the instability of mutual fund performance.
The portfolio performance evaluation primarily refers to the determination of how a particular investment portfolio has performed relative to some comparison benchmark. The evaluation can indicate the extent which the portfolio has outperformed or under-performed, or whether it has performed at par with the benchmark.
The evaluation of portfolio performance is important for several reasons. First, the investor, whose funds have been invested in the portfolio, needs to know the relative performance of the portfolio. The performance review must generate and provide information that will help the investor to assess any need for rebalancing of his investments. Second, the management of the portfolio needs this information to evaluate the performance of the manager of the portfolio and
to determine the manager’s compensation, if that is tied to the portfolio performance. The performance evaluation methods generally fall into two catagories, namely conventional and risk-adjusted methods. (Samarakoon et al, 2005)
7 stocks compiled by the Standard and Poor’s Corporation. If the return on the portfolio exceeds that of the benchmark index, measured during identical time periods, then the portfolio is said to have beaten the benchmark index. While this type of comparison with a passive index is very common in the investment world, this creates a particular problem. The level of risk of the investment portfolio may not be the same as that of the benchmark index portfolio. Higher risk should leads to commensurately higher returns, in the long-term. This means if the investment portfolio has performed better than the benchmark portfolio it may be due to the investment portfolio being more risky than the benchmark portfolio. Therefore, a simple comparison of the return on an investment portfolio with that of a benchmark portfolio may not produce valid results. (Samarakoon et al, 2005). In Indonesia the most widely used market index is the JCI index (IHSG), which measures the price movements of Indonesian stocks listed in IDX.
The risk-adjusted methods make adjustments to returns in order to take account of the differences in risk levels between the managed portfolio and the benchmark portfolio. While there are many such methods, the most notables are the Sharpe ratio (S), Treynor ratio (T), Jensen’s alpha (α), Modigliani and Modigliani (M
2
), Sortino ratio, and EROV.
8 (risk-adjusted performance). This is because the measurement of the performance of mutual funds without taking into account the element of risk would likely result in misleading information to investors. (Samarakoon et al, 2005)
Therefore, this question come to mind whether these companies could obtain the excess return on their investment operation or not? By applying obtained results of this research, investors are able to make the portfolio individually and gain better results then that of the past. It is obvious that each investor tries to gain more return with less risk. So, with respect to the importance evaluation, it is necessary to introduce and employ efficient methods for investment decision. The aim of this research is to assist with a specialized active institution in the market. Other ambitions of the paper are followed as: help to increase the efficiency of the market, help to increase intellectual decision, creation of better opportunity for operational and financial investment. In regard to the financial crisis of previous years, it's importance has been evident more than ever (Ataie, 2012).
Previous research on mutual funds has been done by other researchers, such as that conducted by Siagian (2006) states that individually are only three of seven mutual funds that have outperformed performance against the performance of the market. Khan (2010) in which measurement methods in use, namely Sharpe, Treynor and Jensen has a good performance, while Fama net selectivity has a poor performance.
9 study compared with the Sharpe and Treynor methods. Kuolis et al (2011) The results showed that the ranking of Sharpe and Treynor same calculation. Kolbadi (2011) conducted a study there is a meaning full different between result of performance evaluation by using Sterling, Sortino and Sharpe in investment companies. Ataie (2012) in her study that the performance with EROV ratio has better results compared to the performance of the M3 measure and Sortino ratio.
10 Realizing this, the authors are interested in conducting research entitled: "Evaluation Performance of Equity Funds by Sharpe, Treynor, Jensen, Modigliani (M2), Sortino, and EROV (Case Study Equity Funds Listed in Securities and Exchange Commision (BAPEPAM) Period 2010 – 2012)."
1.2. Problem Formulation
Based on the background, the problem formulations in this research are: 1. Is there difference between returns of Equity Funds with returns of
Benchmark index market JCI (Jakarta Composite Index)?
2. What the result of evaluating the performance of equity funds through Sharpe, Treynor, Jensen, Modigliani, Sortino, and EROV measures are equal?
1.3. Purpose of The Research
The purposes of this research are:
1. Describing there is difference in returns of Equity funds with return of benchmark index market JCI (Jakarta Composite Index).
11 1.3. The Benefits of This Research
The benefits of this research are: 1. Theoretical
Theoretically this study can contribute in the sector of management, especially concerning Financial Management of mutual funds performance measurement analysis with measurement risk-adjusted performance methods Sharpe, Treynor, Jensen, Modigliani, Sortino, and EROV.
2. Practical
a. For Authors
Applying financial management especially in the areas that have been acquired during college, particularly in analyzing the performance measurement of equity funds in Indonesia.
b. For Practitioners
12 c. For Investment Managers
13 CHAPTER II
LITERATURE REVIEW
2.1. Investment
2.1.1. Understanding Investment
Investments are generally divided into two investments in financial assets and real assets. Real assets (tangible assets) in the form of land, buildings, machinery, while knowledge and financial assets (Intangible assets) in the form of stocks or bonds. Real assets to produce goods and services, while explaining the allocation of financial assets or earnings on investor wealth (Bodie et al, 2005:4).
"Mutual funds are simply a means of combining or pooling the funds of a large group of investors. The buy and sell decisions for the resulting pool are then made by a fund manager ". (Bradford and Jordan 2002: 135).
14 Basically the goal of investing is to make some money. Another investment objectives are more specifically is to get a better life in the future, reducing inflationary pressure and the urge to save on taxes (Tandelilin, 2001:3).
2.1.2. Types of Investment
According Jogiyanto (2008:6) Investments in financial assets can be in the form of direct investment and indirect investment. Direct investment made by purchasing directly from a company's financial assets either through intermediaries or in other ways. on the contrary, indirect investments made by buying shares of an investment company which has a portfolio of financial assets from other companies.
a. Direct Investment
According Jogiyanto (2008:6) direct investment can be done by purchasing financial assets that can be traded in the money market, capital market, or derivatives market. Direct investment can also be done with the purchase of financial assets that can not be traded.
b. Indirect Investment
15 2.1.3. Purpose of Investment
Husnan (2005:48) investment objective is basically to make some money. but that statement seems too simple, so it needs to look for a more precise answer about the purpose of investing. as mentioned above, the broader investment objective is monetary welfare, which can be measured by the sum of current income plus the value of future income.
According Rodoni (2009:47), the reason for investing is:
a. To Obtain a Better Life in The Future
Everyone wants a better life in the future. To that, investors make investments for the purpose of profit in order to earn a better living in the future.
b. Reduce Inflation Pressures
With investing, a person or investor can avoid the falling value of their wealth from inflation.
c. The urge to save on taxes
16 2.2. Mutual Funds
2.2.1. Understanding Mutual Funds
A mutual fund is an investment company that issue shares to the public. The money it receives from shareholders is pooled and invested in a wide range of stock, bonds, or money market securities to meet specific objectives. (Hirschey and Nofsinger, 2008 : 454)
According Williams (2001) a mutual fund is an investment company that pools the funds of many investors in a large portfolio. Each investor who purchases shares of the mutual fund owns a portion of a profesionally managed, diversified investment portfolio. As the prices of the investments in the portfolio change, the shares will fluctuate in value.
Manurung (2008) cites Giles et al (2003) stated that, Fund is a pool of money contributed by a range of investors who may be individuals or companies or other organizations, which is managed and investedas a whole, on behalf of those investors. Meanwhile, according Pozen (1998) stated that, A mutual fund is an investment company that pools money from shareholders and invests in a diversified of securities.
17 Definition outlined clearly stated that the Mutual Fund has the characteristics, namely (Manurung, 2008: 2):
1. Collection of funds and the owner, where the owner is the owner of a mutual fund that invested parties or put their money into mutual funds with different variations.
2. Invested to the effect known as an investment instrument. The funds collected from the community invested in investment instruments such as checking accounts, time deposits, REPO, commercial paper, bonds, stocks, options, futures, and so on.
3. Mutual funds are managed by investment managers. The investment manager can be considered from two sides, namely as an institution and as individuals. As an institution must have permission to manage the fund company, where such permission is obtained from the Securities and Exchange Commission (the Capital Market Supervisory Agency) for companies and business in Indonesia.
4. Mutual fund is an investment instrument medium and long term.
18 2.2.2. Form, Nature, and Types of Mutual Funds
2.2.2.1. Mutual Funds Based on Legal Form
In Indonesia, there are two legal forms of the Fund, the Investment Funds Limited Liability Company (Ltd. Mutual Funds) and Mutual Funds of investment contracts Collective (CIC). In terms of ownership, PT. Mutual Fund will issue shares that may be purchased by investors. Thus, by having the right to ownership of the shares of PT. The. Meanwhile, CIC Fund issued investment units. By having units of Mutual Funds CIC, then investors have ownership of wealth Mutual funds net assets. Investment Funds Company is a company (in this case the limited liability company) is engaged in the management of the investment portfolio securities is available in the investment market. Of these activities PT Fund will benefit in the form of an increase in the value of corporate assets (as well as the value of its shares), which then would also be enjoyed by the investors who own shares in the company. (Huda and Nasution 2007:96).
Some characteristics of the Mutual Fund are identical to the other companies in the form of Ltd. are following: (Rodoni, 2006:171)
1. Have wealth.
2. Have management.
19 4. The company has an obligation in accordance with the general provisions set out in the company law (in particular for corporate mutual fund type), including obligations under capital licensing and taxation.
5. Responsible for shareholders (shareholders).
6. Has a wealth of operational or personnel.
Meanwhile, Mutual Fund Investment Contracts Colective is a contract made between the Investment Manager and the Custodian Bank also bind holders of units as investors. Through this contract the investment manager is authorized to manage portfolios and collective investment Custodian Bank to carry out care and administration of collective investment. Function of collective investment contracts as well as the Articles of Association and By laws in a company. Currently, all Mutual Funds in Indonesia is the CIC Investment Fund (Huda and Nasution 2007:97).
2.2.2.2. Mutual Funds Based on Character
20 Based on the operational character, the Mutual Fund may be divided into the Open-end Funds and Closed-end funds. Some differences can both be explained as follows. Open-end Fund to sell its shares in a public offering to so listed on the stock exchanges. Investors can not sell back their shares to other investors through a stock exchange where the trading price is determined by market mechanisms (Huda and Nasution 2007:97).
Open-end funds are always ready to redeem or issue of units at their net asset value (although it will involve the purchase and redemption of sales materials (Bodie, et al 2006:142).
Closed-end funds do not redemption or issuance of fund units. Closed mutual fund units traded in organized exchanges and can be purchased through brokers such other shares (Bodie, et al 2006: 142).
Meanwhile, the closed-end fund its shares sell shares or units continuously throughout an investor is buying. This stock does not need to be listed on the stock exchange and the price is determined based on the Net Asset Value (NAV) / Net Asset Value (NAV) per share is computed by the Custodian Bank (Huda and Nasution 2007:97).
21 2.2.2.3. Mutual Funds by Type of Investment
When we want to start investing, we should already know what kind of mutual funds in accordance with our investment objectives and needs. In terms of Bapepam-LK, mutual funds in Indonesia is divided into four (4) categories, are following: (Pratomo and Ubaidillah, 2009:474)
1. Money Market Fund
Money market funds are defined as funds that invest 100% in money market securities, the debt securities with a maturity of less than one year. Eg deposits, SBI, bonds, and so on. This type of mutual fund is a type of mutual fund with the lowest level of risk. The purpose of investing in this type of mutual fund that is for the protection of capital and provide liquidity. Types of mutual funds can earn interest tuku level higher than the individual investor with limited funds, in addition to the money market funds can diversify investments. (Pratomo and Ubaidillah, 2009:68-71).
2. Fixed Income Fund
22 Funds provide profit sharing in the form of cash (dividends) are paid regularly (3 monthly, 6 monthly or annual). (Pratomo and Ubaidillah, 2009: 71-73).
3. Equity Fund
Equity funds are mutual funds that invest at least 80% of the portfolio under management in equity securities (stocks). In mutual funds of this type generally gives a higher yield potential in the form of capital gains and dividends through growth in stock prices. In addition, the equity fund also provides the potential growth of the investment value, so the risk. (Pratomo and Ubaidillah, 2009: 73-74).
4. Balanced Fund
23 2.2.3. Portfolio Management of Mutual Funds
Investment management is a process of managing money or also often called portfolio management. Investment concept that has temporarily delayed consumption. Fabozi stated that there are five stages in the investment management (Manurung, 2008:83):
1. The determination of the investment policy
2. Establishment of investment policy
3. Portfolio strategy selection
4. The selection of assets
5. Measurement and evaluation of performance
2.2.4. Benefits of Mutual Fund
Basically any investment contains two elements, namely the return (profit) and risk. Here are some of the benefits in investing through mutual funds (Huda and Nasution, 2007: 100).
24 provision made by each mutual fund making it easier for investors to manage cash.
2. Professional managers, mutual funds managed by the Investment Manager is powerful, he is looking for the best investment opportunities for the fund. In principle, investment managers are working hard to investigate thousands of investment opportunities for shareholders / mutual fund units. While the investment option itself is affected by the investment objective of the mutual fund.
3. Diversification, is a term that you do not put all your money in an investment opportunity, with the intention of dividing the risks. Investment managers choose a variety of stocks, so that does not affect the performance of the overall stock mutual fund. In general, mutual funds have about 30 to 60 types of shares of various companies.
4. Low cost, because the mutual fund is a collection of many investors that the magnitude of the ability to invest will result in low transaction costs.
According Williams (2001: 267-269) Benefit of mutual fund are following:
1. Professional Management
In today’s complex,volatile investment environment, many individuals feel
25 With an investment as small as $250, you can leave the buy and sell decisions to the trained professionals who are supported by extensive research staffs.
2. Diversification
Diversification means buying many different securities to reduce the risk of any spesific security.
While the theory of diversifying to reduce risk is widely accepted, it can be time consuming and expensive interms of commissions to own a large portfolio of different investments. Mutual funds can invest with much lower commissions due to their large dollar volume of trading and can spread out the work required to follow a large portfolio.
3. Convenience in Buying and Selling Shares
Mutual Fund shares are easy to buy and sell. You may use a broker or purchase shares directly from the investment company by mail, or by phone or internet if you have an established account. The sahre price of any purchase or sale transaction is based on the net asset value (NAV) of each share. The NAV is computed at the end of each trading day by taking the total value of the portfolio at the day’s closing prices and dividing it by the number
26 4. Low Initial Investments
Initial investments in many mutual funds are as low as $1,000, with minimums for subsequent investments often in the $250 range. Many companies have lower minimums for IRA purchases, typically $250 to open an account and $50 thereafter. Automatic invetment programs, in which you invest periodically through an electronic funds transfer from your bank, may have even lower minimum investment amounts, some beginning at $25.
5. Variety and Flexibility in Choosing Investment Objectives
Mutual funds have become such a popular investment vehicle that thousands of different funds are now available, with investment objectives that run the entire range of possibilities. Stated investment objectives usually include both the risk level of the portfolio and the types of securities that can be inckuded.
6. Regulation
27 2.2.5. Mutual Funds Investment Risk
The context of investment management, risk is the magnitude of the deviation between the expected return with actual return. the greater the deviation means that the greater the level of risk. when the risk is expressed as the extent to which the results obtained can deviate from the expected results, then used the size of the spread. statistical tool that is used as a measure of the spread is the variance or standard deviation. the greater the value, the greater the mean deviation (meaning the higher the risk). (Halim, 2005 : 4)
In the context of the portfolio, the risk can be divided into two, are following:
1. Systematic risk
Risks caused by macro factors affecting all securities that can not be eliminated by diversification.
Systematic risk is measured by β in the CAPM, the return of an
asset is expressed in the form of the relationship between risk free rate plus the market risk premium
E (r) = Rf + (Rm-Rf) β
Portfolio return is also stated as follows:
E (Rp) = Rf + (Rm - Rf) βp
28 Ri = rate of return that investors demand
Rf = risk-free rate of return on investment
Rm = rate of return on the market Β = Systematic risk
2. Unsystematic risk
Risks caused by factors unique to the securities, and can be eliminated by diversifying (Rodoni Ahmad, 2009:28).
According to Manurung (2008:42) Mutual fund investors are being sought to replace the investment of other instruments as interest rate of Bank Indonesia Certificates (SBI) hold Bank Indonesia lowered to levels below 10%. Mutual funds provide higher returns than deposits, mutual funds but also a risky investment, there are four aspects that would explain why mutual funds are a risky investment:
1. The proceeds of the portfolio invested in the securities. Securities portfolio, a collection of effects (more than one effect) that deliver results to its owner.
29 investment managers can not determine or guarantee the portfolio rate of return.
3. Cash flows are fluctuations. Cash flows are referred to in the case of mutual funds, namely the difference between incoming and outgoing funds. Incoming funds are investors who buy mutual funds, while the exit is an investment fund that sells mutual funds are concerned, the investment manager expects cash flow is constant and predictable so that investment managers to manage portfolios well. Therefore, mutual funds have a cash flow that changes every time because of the incoming investors to invest into mutual funds can not be set any time. Changes in cash flows will affect the risk of the portfolio and also affect the risk of the portfolio and at the same time also affects the rate of return and rate of return is uncertain.
4. Investment manager skill. Investment manager to manage the portfolio of expertise is also one incidence risk of the portfolio as well as certainty returns. Known investment manager has asset allocation (asset allocation), the ability of the selection of investment instruments (stock selection) and the ability to judge time selling at the market (market timing). The third skill will determine the rate of return on the portfolio managed by the investment manager.
In addition to the benefits they will get, there are also some risks in investing in Mutual Funds (Huda and Nasution, 2007: 102)
30 economy. Changes in economic and political conditions at home and abroad or regulations especially in the field of Money Market and Capital Market are factor that can affect the performance of the companies listed on the Indonesian Stock burs, which will indirectly affect the performance of the portfolio.
2. Reduced Risk Value Units. Participation Units of the Fund may fluctuate due to the increase or decrease in the Net Asset Value of Mutual Funds. The decrease can be attributed, among others:
a. Changes in prices of equity securities and other securities.
b. The costs are charged each time investors make a purchase and sale. 3. Risk of Default by the parties last. This risk can occur when co-manager
investment business fails to meet its obligations. Business partners may include but are not limited to, issuers, brokers, custodian banks and realtors. 4. Liquidity Risk. Resale (Repayment) depends on the liquidity of the portfolio
or the ability of the Investment Manager to back (pay off) to provide cash. The risk that always comes to investing as follows (Manurung, 2008:48):
1. Interest rate risk is the main risk faced by investors, due to rising interest rates will lower bond prices and interest rates declining bond prices increase. This risk is often referred to as market risk.
31 3. Call risk is the risk faced by investors in which the issuer has the right to repurchase (call) on the bonds. When interest rates fall below the coupon bond and the issuer will normally exercise its right to buy the bonds. Investors can usually compensate by increase price but very difficult to do so.
4. Default risk is the risk faced by investors or bondholders because the bonds cannot pay the bonds at maturity. Therefore investors should be careful to buy bonds, especially bonds are not included in the investment grade.
5. Inflation risk is the risk faced by investors due to inflation so that the cash flows received by investors vary in their ability to purchase (purchasing power).
6. Exchange Risk is the risk faced by investors as a result of changes in exchange rates, this risk will usually be found in bonds denominated in foreign currencies.
7. Liquidity Risk is the risk faced by investors in order to sell the bonds in the market. a measure of the liquidity can be considered of the difference between the purchase price and the sale of such bonds.
2.2.6. Mutual Fund Performance Measurement Model
32 Where:
RRD = Return of Mtual fund
NAVupt-1 = The net asset value in now
NAVupt = Net asset value on the last month
After calculating fund returns of mutual fund the model will be used in measuring the performance of a portfolio or mutual fund performance is as follows:
1. Sharpe Methods
In this method of portfolio performance is measured by comparing only between the portfolio risk premium (that is the difference in the average rate of return on a portfolio with an average risk-free interest rate). Sharpe Index mathematically formulated as follows:
Spi =
Where:
Spi = Sharpe Index Portfolio
Rpi = Average rate of return on portfolio i
Rf = The average risk-free investment rate (using SBI) p = Standard deviation of returns portfolio
33 The formula essentially calculate the slope (slope) line connecting the risky portfolio with the risk-free rate, the slope of the line is given by (Rp-Rf)/p. Thus, the greater the slope of the line means that the better the lines that make up the portfolio. Because, the greater the ratio the better the portfolio risk premium.
Sharpe is relevant index used to investor that invest their funds only or mostly on the portfolio, so the portfolio risk is expressed in standard deviation. (Halim, 2005: 68-69)
2. Treynor Index
In this method of portfolio performance is measured by comparing the portfolio risk premium (that is the difference in the average rate of return on a portfolio with an average risk-free interest) with the risk represented by the portfolio beta (market risk or systematic risk). Treynor index mathematically formulated as follows:
Tpi =
Where:
TPI = Treynor Index Portfolio
Rpi = Average rate of return on portfolio i
Rf = The average risk-free investment rate (using SBI) p = Beta portfolio (market risk or systematic risk) Rpi-Rf = Risk premium Portfolio
(Rp-34 Rf)/p. Thus, the greater the slope of the line means that the better the lines that make up the portfolio. Because, the greater the ratio of risk premium to beta portfolio, it can be said that the better performance of the portfolio.
The use of beta as a measure of portfolio risk that implicitly reflects the existing portfolio is a portfolio that has been well diversified.
The use of relevant Treynor used for investors who have a variety of portfolios or invest their funds in various mutual funds . (Halim, 2005: 68-69).
3. Jensen Index
Jensen measurement method basically assesses the performance of investment managers based on how much investment managers to provide portfolio earnings above market earnings in accordance with its risk. Excess is described by Jensen as the intersection of the linear regression line or often referred to as the intersection of Jensen (Jensen Intercept), which is expressed with the alpha value (symbol). The higher the positive alpha value, the better the performance of the mutual fund. Jensen method is formulated as follows:
JPI = (Rpi-Rf) - p (Rm-Rf)
Where:
JPI = Index portfolio Jensen
Rpi = Average rate of return on portfolio i
Rf = The average of the interest risk-free investment (using SBI) pi = Beta portfolio (market risk or systematic risk)
35 Rm = Return Market (using JCI)
4. Modigliani Index
New size of the risk-adjusted performance of the so-called M2. Development name Franco Modigliani and Leah Modigliani. It is the volatility-adjusted return that followed the return of the portfolio will be compared.
According to Charles P. Jones (2007: 617) in essence, M2 equate volatility portfolios whose performance is measured by the market. It is by using T-bills and the portfolio being evaluated is lower than the market, the leverage can be used to increase volatility. If the risk is greater than the market, some of the funds can be placed in T-bills. The funds can be delivered to fit the lower volatility than the market as adjusted, comparable to leverage the portfolio to the market, can be compared with the market return, or a particular benchmark. M2 big advantage is that the result expressed as a decimal or percentage, which can be easily understood by everyone. M2 can be calculated as follows:
Where:
M = Modigliani Index
Rf = Risk Free (Risk-Free Asset) m = Standard Deviation Market
p = Standard Deviation Portfolio
36 5. Sortino Ratio
Sortino ratio is the actual rate of return in excess of the investor's target rate of return, per unit of downside risk. A measure of excess return per unit of risk based on downside semi-variance, instead of total risk (the standard deviation of the portfolio) is used by the Sharpe ratio. Since the Sortino ratio takes into account only the downside size and frequency of returns, it measures the reward to negative volatility trade-off. For the case where the target return is equal to the mean of the distribution, the LPM of order 2 corresponds to the semi-variance (Burkler and Hunziker, 2008). In all other cases it is referred to as downside variance (Bacon, 2008).
SOR =
Where:
SOR = Sortino ratio
Rpi = The average rate of return on portfolio i
Rf = Average Risk-free (SBI)
σdown = Downside deviation
37 6. Excess Return on Value-at-Risk (EROV)
Excess Return on VaR is basically a Sharpe Ratio using Value-At-Risk instead of Volatility as the risk measure (Bacon, 2004). Assuming normally distributed returns, the VaR of a long-position is calculated as a quantile of the standard normal distribution at a certain confidence level α, using the expected value – i.e. the mean - and the standard deviation (Jorion, 2006:110).
VaR = - (r + Zα * σ)
Where:
α = confidence level
Zα = quantile of the standard normal distribution
When VaR is used to assess risk-adjusted performance, the measure Excess Return on VaR (EVaR) emerges. It compares the excess return of an asset to the VaR of the asset. EVaR can be calculated by the following formula (Wiesinger, 2010).
EROV = {r - rf}/VaR
Where:
38 r = Portfolio returns
rf = Risk free rate
VaR = Portfolio VaR (here: parametric VaR assuming a normal distribution)
2.2.7. Benchmark
In doing performance evaluation, investment managers should have a benchmark or benchmark that can be used as a benchmark assessment. The use of this measure is useful to compare the performance generated by the investment manager to the return obtained by an alternative.
Benchmarks used there are four kinds: (1) the market index (in this case the index JCI), (2) investment style indices generic, (3) benchmark Sharpe (Sharpe benchmark), and the normal portfolio. However, in this study we use the benchmarks are benchmark market index.
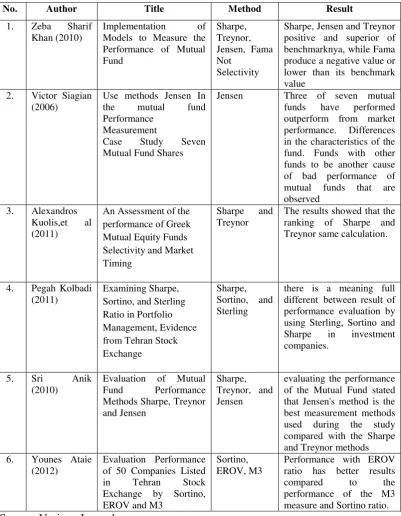
2.3. Previous Research
-39 3.5161. Differences in the characteristics of the fund with other funds to be another cause of bad performance of mutual funds that are observed.
According to Khan (2010) in his study entitled Implementation Model to measure mutual fund performance concluded that the measurement model. Performance of mutual funds, each model has its own significance. Sharpe, Jensen and Treynor describe assessment funds have consistently shown that the maximum performance of the benchmark. Jensen positive result indicates that the Superior Return generated for management expertise and superior performance. Fama is implying negative results. The actual results of the portfolio is less than that mandated by the total portfolio risk, the reasons for the selection of poor funding. Results of the study states that Sharpe, Jensen and Treynor had positive results of benchmark, being Fama produces negative values or lower than the benchmark value.
40 growth in net asset value does not guarantee that the fund has an excellent performance.
Kuolis,et al (2011) This paper empirically examines the performance of fifteen Greek mutual equity funds. The data on which this study was based is monthly and refer to the period January, 2000 to December, 2008. Based on the Treynor-Mazuy model and Sharpe and Treynor measures, the paper evaluates which equity fund entails selectivity and market timing. The results showed that the ranking of Sharpe and Treynor same calculation.
Kolbadi (2009) This study on Examining Sharpe, Sortino, Sterling Ratio in Portfolio Management, Evidence from Tehran Stock Exchange. The method used in this study is the Sharpe, Sortino and Sterling Ratio to measure performance. The results of this study there is a meaning full different between result of performance evaluation by using Sterling, Sortino and Sharpe in investment companies.
42 2.3. Framework
The framework is part of the literature review contains an overview of all the theories are used as a foundation in research. In this framework given brief schematic flow studies illustrate the research process will be conducted.
43
One Way ANOVA Kruskal Wallis Test
Sortino
44 2.4. Hypothesis
Hypothesis is a temporary answer to the formulation of the problem, the researchers propose hypotheses as follows:
1. H0 : There is no difference Between returns of Equity funds with return of benchmark index market JCI (Jakarta Composite Index).
H1 : There is difference Between returns of Equity funds with return of benchmark index market JCI (Jakarta Composite Index).
2. H0 : The result of evaluating the performance of equity funds through Sharpe, Treynor, Jensen, Modigliani, Sortino, and EROV measures are equal.
45 CHAPTER III
RESEARCH METHODOLOGY
3.1. The Scope of Research
The research was conducted in equity funds that have been listed before January 2010 and is still active in December 2012 that will be assessed its performance. Data needed for research are Jakarta Composite Index (JCI) , the Interest Rate (SBI), Net Asset Value (NAV).
The data used for the purposes analysis is secondary data obtained from the monthly publication IDX, BAPEPAM, and BI. While the data for the existing shares in a equity fund portfolio each month obtained from the Custodian Bank monthly report from each of the equity funds to BAPEPAM.
3.2. Sampling Methods
46 purposive sampling to select sample with certain criteria. criteria used in sampling, following:
1. Equity funds are still active until December 2012. Equity funds operating in January 2010 - December 2012 and recorded in the Securities and Exchange Commission (BAPEPAM).
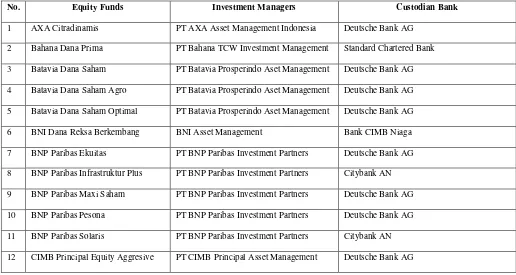
2. Based on the criteria for selecting the sample that had been previously determined, up to December 2012. Based NAV obtained from January 2010 - December 2012 then the entry criteria for the sample is 44 equity funds that will be sampled. equity funds were sampled from a conventional mutual fund, not Islamic mutual funds.
Table 3.1
Equity Funds to Study Sample
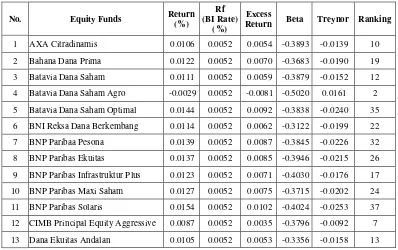
No. Equity Funds Investment Managers Custodian Bank
1 AXA Citradinamis PT AXA Asset Management Indonesia Deutsche Bank AG
2 Bahana Dana Prima PT Bahana TCW Investment Management Standard Chartered Bank
3 Batavia Dana Saham PT Batavia Prosperindo Aset Management Deutsche Bank AG
4 Batavia Dana Saham Agro PT Batavia Prosperindo Aset Management Deutsche Bank AG
5 Batavia Dana Saham Optimal PT Batavia Prosperindo Aset Management Deutsche Bank AG
6 BNI Dana Reksa Berkembang BNI Asset Management Bank CIMB Niaga
7 BNP Paribas Ekuitas PT BNP Paribas Investment Partners Deutsche Bank AG
8 BNP Paribas Infrastruktur Plus PT BNP Paribas Investment Partners Citybank AN
9 BNP Paribas Maxi Saham PT BNP Paribas Investment Partners Deutsche Bank AG
10 BNP Paribas Pesona PT BNP Paribas Investment Partners Deutsche Bank AG
11 BNP Paribas Solaris PT BNP Paribas Investment Partners Citybank AN
47
No. Equity Funds Investment Managers Custodian Bank
13 Dana Ekuitas Andalan PT Bahana TCW Investment Management Bank CIMB Niaga
14 Dana Ekuitas Prima PT Bahana TCW Investment Management Bank CIMB Niaga
15 Dana Pratama Ekuitas PT Bahana TCW Investment Management Bank CIMB Niaga
16 Dana Reksa Mawar PT Danareksa Investment Management Citybank AN
17 FS Indo Equity Value Select Fund PT First State Investment Indonesia Deutsche Bank AG
18 FS Indo Equity Dividen Yield Fund PT First State Investment Indonesia Hongkong and Shanghai Banking Corp.
19 FS Indo Equity Sectoral Fund PT First State Investment Indonesia Deutsche Bank AG
20 FS Indo Equity Peka Fund PT First State Investment Indonesia Citybank AN
21 GMT Dana Ekuitas PT GMT Asset Management Deutsche Bank AG
22 Grow-2-Prosper PT Corfina Capital Deutsche Bank AG
23 Lautandhana Equity PT Lautandhana Investment Management Bank CIMB Niaga
24 Lautandhana Equity Progresif PT Lautandhana Investment Management Bank CIMB Niaga
25 TRIM KAPITAL PLUS PT Trimegah Asset Management Bank CIMB Niaga
26 Makinta Growth Fund PT Emco Asset Management Bank CIMB Niaga
27 Makinta Mantap PT Emco Asset Management Bank CIMB Niaga
28 Mandiri Investa Attraktif PT Mandiri Manajemen Investasi Deutsche Bank AG
29 Mandiri Investa UGM PT Mandiri Management Investasi Deutsche Bank AG
30 Manulife Dana Saham PT Manulife Aset Manajemen Indonesia Deutsche Bank AG
31 Manulife Saham Andalan PT Manulife Aset Manajemen Indonesia The Hongkong And Shanghai Banking Corp.
32 Millenium Equity PT Millenium Danatama Indonesia Bank CIMB Niaga
33 MNC Dana Ekuitas PT MNC Asset Management Bank Rakyat Indonesia (PERSERO)
34 NISP Indeks Saham Progresif PT NISP Asset Management Deutsche Bank AG
35 Panin Dana Maksima PT Panin Asset Managment Deutsche Bank AG
36 Panin Dana Prima PT Panin Asset Managment Bank Central Asia
37 Pratama Saham PT Pratama Capital Asset Deutsche Bank AG
38 Rencana Cerdas PT Ciptadana Asset Management Deutsche Bank AG
39 Schroder Dana Istimewa PT Schroder Investment Management Deutsche Bank AG
40 Schroder Dana Prestasi Plus PT Schroder Investment Management Deutsche Bank AG
48
No. Equity Funds Investment Managers Custodian Bank
42 Simas Danamas Saham PT Sinarmas Asset Management Bank CIMB Niaga
43 Syailendra Equity Opportunity PT Syailendra Capital Deutsche Bank AG
44 TRIM Kapital PT Trimegah Asset Management Bank CIMB Niaga
Source: BAPEPAM
3.3. Data Collection Method
According to the type of data needed is secondary data and sampling techniques are used, the method of data collection was conducted using the documentation method. By way of recording data that is listed in BAPEPAM www.bapepam.go.id for data on Net Asset Value (NAV) of the monthly observation period January 2010- December 2012, the data recorded monthly composite index of www.idx.co.id observation period January 2010 – December 2012 and recorded data monthly interest rate of Bank Indonesia Certificates January 2010- December 2012 obtained from the website of Bank Indonesia, which www.bi.go.id. The data obtained then reprocessed and adjusted to the needs of this research.
3.4. Data Analysis Methods
The steps in analyzing the data obtained from the Securities and Exchange Commission (BAPEPAM) website, BI website and Yahoo Finance to assess and compare the performance of Equity funds are as follows:
49 Return (rates of return) earned Equity fund investors from positional changes NAV. The formula used to calculate this return is:
where:
Ri = rate return mutual fund shares
NAV1 = stock price at period 1
NAVt-1 = stock price in the period before 1
2. Calculate the Return of (Benchmark) market index
Return the market and is used to benchmark or benchmark for the asset portfolio risk.
where:
Rm = return rate mutual funds
IHSG1 = stock price at period 1
50 3. Calculate the risk-free interest rate
SBI interest rate fluctuates in accordance with the policy of neutral bank, Bank Indonesia. SBI return calculation reflects the level of the risk free rate. SBI rate is in percentage form so that calculations can be done by SBI interest rate dividing by the number of months in a year.
RSBI
=
where:
RSBI = Return rate of Bank Indonesia
SBI = Interest Rate of Bank Indonesia
n = 12 for monthly data
The next variable returns averaged SBI. This step uses "AVERAGE" in Microsoft Excel. This variable is used as a variable rate of return (performance) risk-free investment / risk free asset return, where return SBI reflect the risk-free rate of return for mutual funds in Indonesia.
4. Calculating Standard Deviation Portfolio (stdevp) and Standard Deviation Market (stdevm)
51 Stage of monthly standard deviation are as follows:
a. Calculate the monthly returns where NAV is at the end of the month period and early of the month NAV period is the NAV at the previous month.
b. The standard deviation obtained from STDEV return NAV of equity funds .
c. Standard deviation obtained from STDEV market index return JCI (benchmark)
5. Calculate the portfolio beta and market beta
Beta is a parameter that indicates volatility relative from return of stock portfolio to the market return portfolio. Beta calculation in the study is beta portfolio while retun of market index (benchmark). Beta calculation in this study using linear regression Y = a + bY + e function application of SPSS with the provisions of return portfolio mutual fund as Y axis and the market return as the axis X.
6. Measure the performance of the optimal portfolio with three models index.
a. Sharpe Method Model
Spi =
52 Sp i = Index Sharpe Portofolio
Rpi = The average rate of return on portfolio i
Rf = Average Risk-free (SBI)
p = The standard deviation of portfolio returns
b. Treynor Method Model
Tpi=
where:
Tpi = Index Treynor Portofolio
Rpi = The average rate of return on portfolio i
Rf = Average Risk-free (SBI)
p = Beta portfolio
c. Jensen Method Model
Jpi = (Rpi-Rf) - p (rm-Rf)
where:
Jpi = Index Jensen portofolio
Rpi = The average rate of return on portfolio i
53 pi = Beta portfolio 1 (market risk or systematic risk)
Rm = Return Market index (benchmark)
d. Modigliani Method
M= Rf + (Spi . m)
where:
M = Modigliani Square
Spi = Indeks Sharpe Portfolio (Rpi-Rf /p)
Rf = Risk Free
m = Market Standard Deviation
p = Portfolio Standard Deviation
Rpi-Rf = Risk Premium Portofolio
e. Sortino Method Model
SOR =
where:
Rpi = The average rate of return on portfolio i
54 f. EROV Method Model
EROV = {r - rf} / VaR
where:
EROV = Excess return on VaR
r = Portfolio returns
rf = Risk free rate
VaR = Value at Risk portfolio
7. Performance Evaluation of Equity Funds
Evaluation performance of equity funds in this study is based on monthly and based on descriptive statistics and based Sharpe, Treynor, Jensen, Modigliani (M-Square), Sortino, and EROV methods. The evaluation that doing to compare and rank funds based on performance obtained from the six methods of risk-adjusted methods.
3.5. Theoritical Hypothesis
55 Before doing comparison test, the data must first be tested for normality test to know whether or not the data were normally distributed or not, to test whether or not the data were normally used tools are the Kolmogorov-Smirnov test. According Widarjono (2010: 111). Kolmogorov-Smirnov test is a test used to determine whether the sample comes from a population with a specific distribution in this case the normal distribution. The null hypothesis (H0) in the Kolmogorov-Smirnov test is that the data follow a particular distribution (normal distribution), while the alternative hypothesis (Ha) data follow a particular distribution (not normally distributed). The steps are:
Ho: The data are normally distributed
Ha: The data are not normally distributed
Moreover the null hypothesis can be accepted or rejected based on the probability that there is value. If the probability value is greater than the level of significance () then Ho is accepted. Conversely, if the probability value is less than significant level () then Ho is rejected and Ha accepted.
The criteria used to reject or accept Ho based on the probability value is:
If the probability > 0.05 then Ho is accepted,
If probability < 0.05 then Ho is rejected
56 independent sample t tests to determine whether there is difference the return of equity funds and return of benchmark. If the data is not normally distributed then the test will be performed using the Mann-Whitney test. In determining whether the result of evaluation the performance of equity funds through Sharpe, Treynor, Jensen, Modigliani, Sortino, and EROV methods are not equal used by one way ANOVA if data normally distributed and if data not normally distributed using the Kruskal-Wallis test.
After doing the test for normality of data, then the next step to comparison test and rank the methods based performance. The steps are:
a. Comparisons test Return Equity funds with Return Benchmark (JCI) which is only considering the evaluation of portfolio performance returns.
b. Comparisons Test between the result of evaluation the performace of equity funds based Six methods model.
3.6. Research Operational of Variables
Variables used in this study are Return of Equity Funds, Return index market JCI (benchmark), Risk free, method of Sharpe, Treynor method, Jensen method, Method Modigliani, Sortino method, EROV method. Operational variables can be defined as follows:
1. Return of Equity Fund
57 calculated the data of the NAV per unit. Returns of Equity Fund can be calculated in the following:
RRD =
where:
RRD = Return of Equity Fund
= Net Asset Value of The Current Month
= Net Asset Value in The Last Month
2. Return Index Market JCI (benchmark)
A measure of the ability of the market performance as a comparison, in showing a performance that has been Achieved in the specified period roomates is calculated from the value of the index market JCI (benchmark). Return market Index (benchmark) calculated as follows:
where:
Rm = Return of maket index (IHSG)
IHSGt = Return of market index (IHSG) current day
58 3. Risk Free
Investment with risk-free the assumed with an average rate of interest rate of Bank Indonesia Certificates (SBI) on specified period. Risk free can be determined by the the following:
RSBI =
where :
RSBI = Return of rate of interest rate of Bank Indonesia Certificates (SBI)
SBI = Rate of interest rate of Bank Indonesia Certificates (SBI)
N = 12 for monthly data
4. Sharpe Method
The method is used to measure the performance of mutual funds based on how much additional investment obtained for each unit of risk taken. measurement Sharpe formulated as follows:
Spi =
where :
Spi = Indeks Sharpe Portofolio
59 p = The standard deviation of portfolio returns
5. Treynor Method
Treynor method is similar to the Sharpe method using the Risk Premium, but the difference method Treynor using the beta (β) which is
the risk of fluctuations relative to the market risk. Treynor method can be formulated as follows:
Tpi =
where:
Tpi = Index Treynor Portfolio
Rpi = The average rate of return on portfolio i
Rf = Average Risk-free (SBI)
p = Beta portfolio 1 (market risk or systematic risk)
6. Jensen Method
Alpha () is Risk Adjusted Measures of Portfolio Performance by Jensen, measured by the difference between the portfolio return minus the risk-free rate of return beta multiplied by the difference between the return of benchmark and risk-free rate.
60 Where:
Jpi = Index Jensen portfolio
Rpi = The average rate of return on portfolio i
Rf = Average Risk-free (SBI)
pi = Beta portfolio 1 (market risk or systematic risk)
Rm = Return Market index (benchmark)
7. Modigliani Method
Risk Adjusted Measures of Portfolio Performance by Franco Modigliani and Leah Modigliani, measured by the risk free plus the amount times of the RVAR (Sharpe ratio) with standard deviation of market benchmark.
M = Rf + (Spi . m)
where:
M = Modigiliani Square
Spi = Indeks Sharpe Portofolio (Rpi-Rf /p)
Rf = Risk Free (Aset Bebas Risiko) m = Standar Deviasi Market
61 Rpi-Rf = Risk Premium Portofolio
8. Sortino Method
The Sortino Ratio can be Regarded as a modification of the Sharpe Ratio as it replaces the standard deviation by downside deviation considers only the negative deviations from the mean or a minimum return threshold. Sortino ratio can be calculated by the following formula :
SOR =
where:
SOR = Sortino ratio
Rpi = The average rate of return on portfolio i
Rf = Average Risk-free (SBI) σdown = Downside deviation
9. EROV Ratio Method
62 measuring the performance of equity funds, can be seen in Table 3.1 the following operational definition:
Table 3.2.
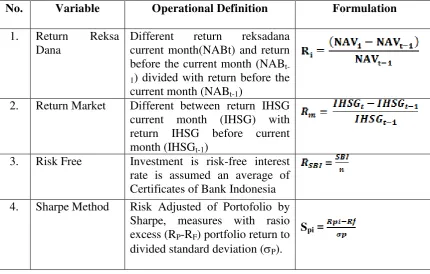
Research Variable, Operational Definition and Formulation
No. Variable Operational Definition Formulation
1. Return Reksa Dana
Different return reksadana current month(NABt) and return before the current month (NABt-1) divided with return before the current month (NABt-1)
63
No. Variable Operational Definition Formulation
5. Treynor Method Risk Adjusted Measures of between the portfolio return and risk-free (Rp-RF) minus beta times different return between benchmark with risk-free (Rm-RF).
Jpi = (Rpi-Rf) - p (rm-Rf)