“THE PERFORMANCE ANALYSIS OF EQUITY FUNDS USING RISK ADJUSTED RETURN, RISK RATIO, AND SNAIL TRAIL”
(SUMMARY)
Writer : Rr. Alberta Maharani Pramudita Apsari Supervisor : J. Sukmawati Sukamulja
International Business Management Program The Faculty of Economics
“THE PERFORMANCE ANALYSIS OF EQUITY FUNDS USING RISK ADJUSTED RETURN, RISK RATIO, AND SNAIL TRAIL”
ABSTRACT
The objective of this research is to explain the performance of equity funds by using three methods, which are risk adjusted return (RAR), risk ratio (RR), and snail trail method. The second objective is to compare equity funds performance towards market performance.
The samples of this research are equity funds actively listed in BAPEPAM for period January 2008 until December 2012. The data is taken from each company’s monthly net assets value (NAV) for period January 2008 until December 2012. Mutual fund with zero NAV in the end of calculation and with foreign currency of NAV is not used as sample. The performance analysis of equity funds is calculated by using Risk Adjusted Return with Sharpe Ratio method, Risk Ratio, and Snail Trail. The benchmark is JCI or Jakarta Composite Index for period January 2008 – December 2012.
From the three methods used, most of the equity funds are adjusted well and ready to face the risk. In fact, there are still some equity funds with underperform performance compare to the benchmark in both risk and return. The calculation of risk adjusted return, risk ratio, and snail trail are connected with the result which stated that equity funds shows a high return and high risk as well.
Mutual Fund is one of the most growing investment nowadays. BAPEPAM data shows the amount of mutual fund year 2008 reach until Rp 73 trillion of Net Asset Value (NAV) and it keep growing for the years after. In 2009, the Net Asset Value reach Rp 109 trillion, and in the end of 2012, the Net Asset Value reach up to Rp 182 trillion. Mutual fund is a flexible investment and organized by Fund Manager. It is particularly suitable for investors who do not have much time, lack of investment knowledge and capability, and also limited fund. One of the mutual fund types is equity funds. Equity funds is a type of mutual fund which the investment must be minimum 80% of the portfolio managed in stock effect. Stock effect generally gives higher return in the form of capital gain by the growth of stocks prices. This kind of investment is promising and it also a long term investment, which is more than 5 years. With the fluctuate price of stock, equity funds may gives higher return compare to other type of mutual fund but as well as the risk.
Statement of Problem
a. How is the performance of equity funds by using Risk Adjusted Return method, Risk
Ratio method, and Snail Trail?
b. Is the performance of each equity funds different with the market performance?
Objective of the Study
a. To explain the performance of equity funds by using Risk Adjusted Return method,
Risk Ratio method, and Snail Trail.
b. To compare between equity funds and market performance.
Mutual Fund
According to the Law of Indonesia Capital Market year 1995, the definition of mutual fund is a form of investment used to collect funds from investors, and henceforward invested to portfolio effect by fund manager. From the definition, at least there are three main elements. The first is the availability of fund by the investors. Second, the fund is invested to portfolio effect. Third, the fund is managed by fund manager. All the funds managed are owned by the investors, while fund manager is the trusted parties to manage the fund.
This research uses secondary data from institutions which do the mutual fund management. The data uses are the data of monthly Net Asset Value (NAV) of mutual fund Company during January 2008 until December 2012 from BAPEPAM, and the data of Jakarta Composite Index for period January 2008 – December 2012. For data sampling, it begins with the population of this research which are all active equity funds companies listed in BAPEPAM amounting 22 companies for period January 2008 until January 2013.
Table 3.1.
List of Equity Funds Company Listed in BAPEPAM Per December 2012
No Name of Equity Funds Company
1 BNI Reksadana Berkembang
3 CIMB-PRICIPAL EQUITY AGRESSIVE
4 Danareksa Mawar
5 FIRST STATE INDOEQUITY SECTORAL FUND
6 FS INDOEQUITY DIVIDEND YIELD FUND
7 GMT DANA EKUITAS
8 GROW-2-PROSPER
9 MANULIFE SAHAM ANDALAN
10 Manulife Dana Saham
11 PRATAMA SAHAM
12 RD TRIM SYARIAH SAHAM
13 REKSA DANA DANA EKUITAS PRIMA
14 REKSA DANA MANDIRI INVESTA ATRAKTIF
15 REKSA DANA SCHRODER DANA ISTIMEWA
16 REKSA DANA SIMAS DANAMAS SAHAM
17 REKSADANA DANA EKUITAS ANDALAN
18 REKSADANA DANA PRATAMA EKUITAS
19 REKSADANA LAUTANDHANA EQUITY
20 Rencana Cerdas
21 Schroder Dana Prestasi Plus
22 TRIM Kapital
Source: BAPEPAM LK
This research conducts three methods to measure the performance of mutual funds. The methods are stated as follows:
The first method is the calculation of Risk Adjusted Return (RAR) which stated about the ability of fund manager in managing funds. The research about Risk Adjusted Return (RAR) is developed by Sharpe (1986) and stated that the portfolio is not diversified. The formula of this
method is (Rp-Rf)/σp. Sharpe do the research of 34 mutual funds during 1954-1963 and most of
ܴܣܴ ൌሺୖ୮ିୖሻఙோ (1) Where:
Rp = Average return of mutual fund
Rf = Average return
σRp = Risk of mutual fund
The second method is Risk Ratio which measures the ability of fund manager in facing market risk. The higher value of this risk value shows the higher ability of fund manager in facing market risk. The formula of Risk Ratio is stated as (Brigham and Daves, 2003):
ܴܴ ൌୖ୫ୖ୮ (2)
Where:
σRm = Market risk
σRp = Mutual fund risk
The third method is Snail Trail method which is a new method to measure mutual fund performance for long term. This method is simple and different from the Risk Adjusted Return and Risk Ratio method. Snail trail method is the movement of mutual fund seen from the risk and return which plotted into 4 quadrants where the horizontal shows the risk and the vertical shows the return. In turn, the risk and return of a mutual fund is plotted into quadrants from time to time so it shows the movement of mutual fund itself.
Return (r) (3)
Quadrant 1 Quadrant 2
Low risk high return High risk high return
Quadrant 4 Quadrant 4
Low risk low return High risk low return
Risk(σ)
Source: Reksa Dana Investasiku (Manurung, 2008)
Table 4.1
Equity Fund Return and Average Return (in %) January 2008 – December 2012
(in rank from highest to lowest)
NO Name of Equity Fund Total Return Average Return
1 GROW-2-PROSPER 97.5174 1.6528
2 GMT DANA EKUITAS 90.7383 1.5379
3 REKSA DANA SCHRODER DANA
ISTIMEWA
82.6721 1.4012
4 PRATAMA SAHAM 80.5892 1.3659
5 TRIM Kapital 74.0344 1.2548
6 MANULIFE SAHAM ANDALAN 72.0414 1.221
7 Schroder Dana Prestasi Plus 70.4105 1.1933
8 REKSA DANA DANA EKUITAS
PRIMA
68.5367 1.1616
9 Rencana Cerdas 67.4046 1.1425
10 Bahana Dana Prima 62.4078 1.0578
11 Manulife Dana Saham 62.0955 1.0524
12 REKSADANA DANA EKUITAS
ANDALAN
60.3443 1.0228
13 REKSADANA DANA PRATAMA
EKUITAS
59.5199 1.0088
14 FIRST STATE INDOEQUITY
SECTORAL FUND
57.9597 0.9823
15 Danareksa Mawar 56.3597 0.8636
16 FS INDOEQUITY DIVIDEND
YIELD FUND
52.8837 0.8963
17 REKSA DANA MANDIRI INVESTA
ATRAKTIF
50.7585 0.8603
18 REKSA DANA SIMAS DANAMAS
SAHAM
41.8151 0.7087
19 REKSADANA LAUTANDHANA
EQUITY
33.8798 0.5742
20 RD TRIM SYARIAH SAHAM 25.2895 0.4286
21 CIMB-PRINCIPAL EQUITY
AGRESSIVE
40.3945 0.6846
22 BNI Reksadana Berkembang 19.5534 0.3314
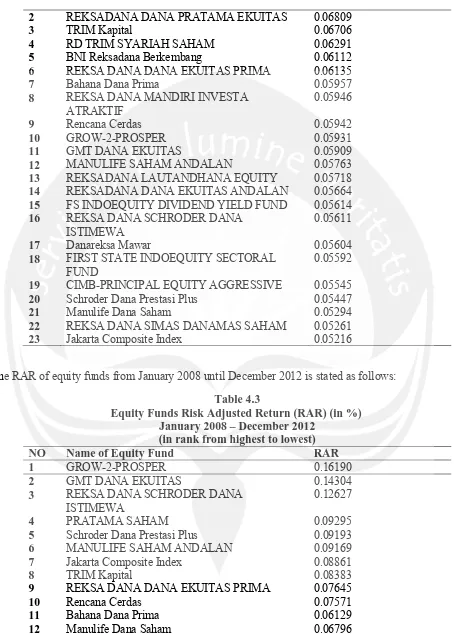
Based on the calculation using Microsoft Excel, the Equity Funds standard deviation is stated as follows:
Table 4.2
Equity Funds Standard Deviation (in %) January 2008 – December 2012 (in rank from highest to lowest)
NO Name of Equity Fund Standard Deviation
[image:7.595.89.524.132.606.2] [image:7.595.92.530.145.608.2]2 REKSADANA DANA PRATAMA EKUITAS 0.06809
3 TRIM Kapital 0.06706
4 RD TRIM SYARIAH SAHAM 0.06291
5 BNI Reksadana Berkembang 0.06112
6 REKSA DANA DANA EKUITAS PRIMA 0.06135
7 Bahana Dana Prima 0.05957
8 REKSA DANA MANDIRI INVESTA
ATRAKTIF
0.05946
9 Rencana Cerdas 0.05942
10 GROW-2-PROSPER 0.05931
11 GMT DANA EKUITAS 0.05909
12 MANULIFE SAHAM ANDALAN 0.05763
13 REKSADANA LAUTANDHANA EQUITY 0.05718
14 REKSADANA DANA EKUITAS ANDALAN 0.05664
15 FS INDOEQUITY DIVIDEND YIELD FUND 0.05614
16 REKSA DANA SCHRODER DANA
ISTIMEWA
0.05611
17 Danareksa Mawar 0.05604
18 FIRST STATE INDOEQUITY SECTORAL
FUND
0.05592
19 CIMB-PRINCIPAL EQUITY AGGRESSIVE 0.05545
20 Schroder Dana Prestasi Plus 0.05447
21 Manulife Dana Saham 0.05294
22 REKSA DANA SIMAS DANAMAS SAHAM 0.05261
23 Jakarta Composite Index 0.05216
The RAR of equity funds from January 2008 until December 2012 is stated as follows:
Table 4.3
Equity Funds Risk Adjusted Return (RAR) (in %) January 2008 – December 2012
(in rank from highest to lowest)
NO Name of Equity Fund RAR
1 GROW-2-PROSPER 0.16190
2 GMT DANA EKUITAS 0.14304
3 REKSA DANA SCHRODER DANA
ISTIMEWA
0.12627
4 PRATAMA SAHAM 0.09295
5 Schroder Dana Prestasi Plus 0.09193
6 MANULIFE SAHAM ANDALAN 0.09169
7 Jakarta Composite Index 0.08861
8 TRIM Kapital 0.08383
9 REKSA DANA DANA EKUITAS PRIMA 0.07645
10 Rencana Cerdas 0.07571
11 Bahana Dana Prima 0.06129
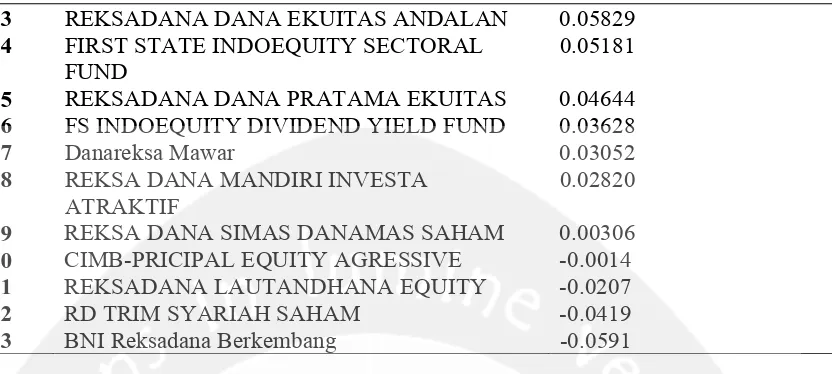
[image:8.595.79.533.96.730.2]There are 6 mutual funds show positive result with higher value compares to the benchmark. It means that the investment manager is able to adjust the funds even with the risk involvement of the risk. The higher Risk Adjusted Return (RAR) value means higher result done by investment manager for each risk taken. The other 12 equity funds still show positive result but with lower value of risk adjusted return compare to the benchmark. It means that investment managers are still unable to execute a right adjustment to get the return and they still have a good performance but they show an underperform performance because the value is lower than the benchmark. There are 4 equity funds with negative result and below the benchmark. It means that these equity funds are really risky because the investment manager unable to adjust the funds they manage. The equity funds with lower value of RAR compare to the benchmark still own an opportunity cost in managing their investment. If they do better performance, it is possible to create higher value compare to the benchmark, because in fact, there are several equity funds with higher value of benchmark.
Risk ratio is the comparison between risk ratio and mutual fund risk. This calculation measures the ability of investment manager managing their fund facing the market risk.
Table 4.4
Equity Funds Risk Ratio (RR) (in %) January 2008 – December 2012 (in rank from highest to lowest)
NO Name of Equity Fund RR
1 REKSA DANA SIMAS DANAMAS SAHAM 0.9914
2 Manulife Dana Saham 0.9851
3 Schroder Dana Prestasi Plus 0.9575
4 CIMB-PRICIPAL EQUITY AGRESSIVE 0.9405
5 FIRST STATE INDOEQUITY SECTORAL
FUND
0.9326
6 Danareksa Mawar 0.9307
7 FS INDOEQUITY DIVIDEND YIELD FUND 0.9289
8 REKSA DANA SCHRODER DANA
ISTIMEWA
0.9295
9 REKSADANA LAUTANDHANA EQUITY 0.9122
10 REKSADANA DANA EKUITAS ANDALAN 0.9208
13 REKSADANA DANA EKUITAS ANDALAN 0.05829
14 FIRST STATE INDOEQUITY SECTORAL
FUND
0.05181
15 REKSADANA DANA PRATAMA EKUITAS 0.04644
16 FS INDOEQUITY DIVIDEND YIELD FUND 0.03628
17 Danareksa Mawar 0.03052
18 REKSA DANA MANDIRI INVESTA
ATRAKTIF
0.02820
19 REKSA DANA SIMAS DANAMAS SAHAM 0.00306
20 CIMB-PRICIPAL EQUITY AGRESSIVE -0.0014
21 REKSADANA LAUTANDHANA EQUITY -0.0207
22 RD TRIM SYARIAH SAHAM -0.0419
[image:9.595.113.529.104.291.2]11 MANULIFE SAHAM ANDALAN 0.9051
12 GMT DANA EKUITAS 0.8826
13 Jakarta Composite Index 0.8822
14 GROW-2-PROSPER 0.8794
15 Rencana Cerdas 0.8778
16 REKSA DANA MANDIRI INVESTA
ATRAKTIF
0.8771
17 Bahana Dana Prima 0.8755
18 BNI Reksadana Berkembang 0.8535
19 REKSA DANA DANA EKUITAS PRIMA 0.8502
20 RD TRIM SYARIAH SAHAM 0.8291
21 REKSADANA DANA PRATAMA EKUITAS 0.7661
22 PRATAMA SAHAM 0.7201
23 TRIM Kapital 0.7778
Higher value of risk ratio is better because it shows the better ability of investment manager facing the market risk. . The equity funds with lower value of RR compare to the benchmark still own an opportunity cost in managing their investment. If they do better performance, it is possible to create higher value compare to the benchmark, because in fact, there are several equity funds with higher value of benchmark.
Snail trail is formed by several dots connected to a risk-return diagram. After calculating return and risk of each mutual fund for the certain period, the next step is by determining a benchmark for equity funds, followed by calculating the return and risk of the benchmark and calculating the return and risk margin between mutual funds and the benchmark. Those margins will create dots and in turn will create snail trail pattern. In outline, most of the equity funds are in the second quadrant of snail trail diagram. It shows that most of the equity funds give high return to the investor and high risk as well.
CONCLUSION
This research analyzes equity funds from the result of monthly Net Asset Value for period January 2008 – December 2012. The objective of the study is to explain the equity fund performance by using risk adjusted return method, risk ratio method, and snail trail method. The other objective is to compare between equity funds performance and market performance. The data analysis of this research ends up with some conclusions which are stated as follows:
1. Performance analysis of equity funds by using Risk Adjusted Return (RAR) in Sharpe
value of risk adjusted return compare to the benchmark. It means that investment managers are still unable to execute a right adjustment to get the return and they still have a good performance but they show an underperform performance because the value is lower than the benchmark. The other 4 equity funds show negative result, means that these equity funds are really risky because the investment manager unable to adjust the funds they manage. The equity funds with lower value of RAR compare to the benchmark still own an opportunity cost in managing their investment. If they do better performance, it is possible to create higher value compare to the benchmark, because in fact, there are several equity funds with higher value of benchmark. In outline, most of the equity funds show positive result but with lower value than the benchmark.
2. Higher value of risk ratio is better because it shows the better ability of investment
manager facing the market risk. There are 12 equity funds are above the JCI as benchmark with 0.8822%, while the other 10 equity funds are below the benchmark. The equity funds with outperform performance means that the investment managers are ready to face the market risk, while the equity funds with underperform performance means that the investment managers are less ready to face the market risk. The equity funds with lower value of RR compare to the benchmark still own an opportunity cost in managing their investment. If they do better performance, it is possible to create higher value compare to the benchmark, because in fact, there are several equity funds with higher value of benchmark. In outline, all of the equity funds show positive value of risk ratio and most of them are above the benchmark.
3. Performance analysis of equity funds by using Snail Trail method mostly in quadrant
2 which means high risk and high return. There are some of equity funds in quadrant 3 which means high risk low return such as GMT Dana Ekuitas, Grow-2-Prosper, Reksadana Dana Ekuitas Andalan, and Trim Kapital. This condition is avoided by the investors. The best performance based on snail trail method is owned by Reksadana Dana Simas Danamas Saham with most of its dots in quadrant 1 while the lowest performance is owned by Trim Kapital with most of its dots in quadrant 3. In outline, most of equity funds appear on the second quadrant, which means high risk and high return. This is considerable because equity funds is the type of mutual fund which give high return and high risk as well, if it is compared to other type of mutual fund. In outline, most of the equity funds are in the third quadrant which means high risk and high return.
From the three methods used we can see that most of the equity funds are adjusted well and ready to face the risk. In fact, there are still some equity funds with underperform performance compare to the benchmark in both risk and return. The calculation of risk adjusted return, risk ratio, and snail trail are connected with the result which stated that equity funds shows a high return and high risk as well.
SUGGESTION
BIBLIOGRAPHY
Bodie, Zvi, Alex Kane, and Alan J. Marcus, 2008, Investment, Sixth Edition,
Singapore: McGraw-Hill
Bodie, Zvi, Alex Kane, and Alan J. Marcus, 2008, Essentials of Investment, Seventh Edition,
USA: McGraw-Hill
Keng, T. Y. 2000. Unit Trust Performance Measurement: the Snail Trail Approach. Pertanika J.
Soc. Sci & Hum. Vol 8 No.2, 103 – 114
Manurung, Adler Haymas. 2008. Panduan Lengkap: Reksa Dana Investasiku edisi revisi.
Kompas, Jakarta.
Manurung, Adler Haymas, Pardomuan S., Thombos S., Analisis Kinerja Reksdana dengan
Menggunakan Risk Adjusted Return, Rasio Risiko, dan Snail Trail, Usahawan No.9 Th XXXV Septeber 2006
Pratomo, Eko Priyo and Ubadillah Nugraha. 2002. Reksa Dana, Solusi Perencanaan Investasi di
Era Modern. Gramedia Pustaka Utama, Jakarta
Raharjo, Sapto. 2004. Panduan Investasi Reksa Dana. Elex Media Komputindo, Jakarta
Simamora, Hotniati. 2010. Analisis Kinerja Reksa Dana Pendapatan Tetap dengan Menggunakan Risk Adjusted Return, Rasio Risiko, dan Snail Trail. Skripsi. Unpublish paper. Universitas Atma Jaya Yogyakarta
www.bapepam.go.id/reksadana , September 3, 2013
www.kontan.co.id/index.php/investasi/news/27238/Investor-Reksadana-Memanen-Laba September 3, 2013