Civil Engineering Dimension, Vol. 12, No. 1, March 2010,63-64 ISSN 1410-9530 print / ISSN 1979-570X online
Discussion on: paper by Sudjianto, A. T., et al, Civil Engineering Dimension Vol 11, No 2, September 2009, pp. 100-105
Behavior of Expansive Clay of Ngawi Region (East Java) Under
Water Content Variation
Muntohar, A.S.1)
The authors have prepared a significant investigation in swelling behavior of expansive clay. The lateral swelling potential obtained from modified oedometer test was especially interesting. Discussant used the term of swelling potential to represent both strain and swelling pressure. The effect of three different initial water contents, which is 20%, 25%, and 30%, on swelling potential has been studied. The specimens were prepared at similar densities. The lateral swelling potential has been measured from the installed strain gauges. However, installation of the strain gauges and procedure of the test were not clearly informed. Two discussions will be presented as follows.
Vertical Swelling Potential
It is interesting to observe swelling characteristics as presented in Figure 3. The curve can be divided into three phases that is initial, primary, and secondary swelling [1]. There is a significant difference in the swelling mechanism at initial phases which the authors have overlooked. At the initial moist content of 20% the soil swelled rapidly, whereas at the higher moist content the swelling rate was much slower. The initial swelling was about 9%, 2.5%, and 2% for specimen prepared with 20%, 25%, and 30% of initial moisture content. For this case, it seems that the initial swelling was less influenced by initial moisture content. According to the data presented in Table 4, the swelling was greatly affected by the degree of saturation. The degree of saturation for the specimens prepared at 25% and 30% moisture content was more or less similar. However, there was a great difference, about 4.8%, on the degree of saturation of the specimens prepared at 20% and 25% moisture content. Even the difference of moisture content was 5%, those resulted in significant difference of the degree of saturation. Hence, it can be noted that the initial swelling was major affected by degree of saturation, while the initial moisture content controlled the ultimate swelling.
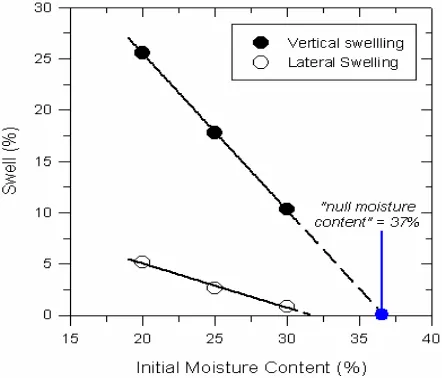
The author also correlated the vertical swelling with initial moisture content as presented in Figure 4.
1) Department of Civil Engineering, Universitas Muhammadiyah Yogyakarta, Indoensia.
Email: [email protected]
The correlation was perfectly in linear relationship as obtained also by Al-Shamrani and Al-Mhaidib [2]. However, it is not clear why the authors stated the null moisture content at 24% instead of 37% as the discussant have extrapolated from the same linear relationship (Figure 10). This value is quite far from the plastic limit which is approximately 30%. This is true since swelling will not occur at water content greater than the plastic limit. In discussant point of view, principally, the swelling percentage is maximum if the soil is initially at the shrinkage limit and decreases with increasing water content. Once the field water content is above the plastic limit, the swelling is negligibly small. As montmorillonite is the main mineral in the soil, swelling will also depend on exchangeable cations or cation exchange capacity and the soil fabric [3].
Figure 10 Extrapolating of the swelling and initial
moisture content relationship.
Swelling Pressure
The authors had not clearly defined the swelling pressure presented in Table 6 and Figure 8 whether it was vertical swelling pressure or lateral swelling pressure. It is not clear how to relate the findings of swelling pressure measurement with the plotted test result in Figure 8. It seems that Figure 8 is related with Table 4 which is for the determination vertical swelling pressure.
Discussion on: Behavior of Expansive Clay of Ngawi Region (East Java) Under Water Content Variation
64 Back to the osmotic pressure theory of double layer, vertical swelling pressure was strongly dependent on the mid-plane potential which is a function of soil properties (specific surface and cation exchange capacity), water electrolyte properties (cation concentration, dielectric constant, valence of cation), and the distance between the platelets (which could be obtained either from void ratio or dry density) [3,4]. Referring to the definition of swelling pressure, the vertical swelling pressure of those specimens were predicted by extrapolating from Figure 8 except for specimen with initial moisture content of 30%. Therefore, the last conclusion of the paper remains dubious. Some researchers concluded that although the swelling decrease with an increase of the initial water content, the swelling pressure was independent of initial water content but strongly dependent on the initial dry density and vertical pressure [5, 6].
References
1 Muntohar, A.S., Swelling and Compressibility Characteristics of the Soil–Bentonite Mixtures,
Civil Engineering Dimension, Vol. 5 No. 2, 2003,
pp. 93-98.
2 Al-Shamrani, M.A. and Al-Mhaidib, Vertical Swelling of expansive Soils Under Fully and Partially Lateral Restraint Conditions,
Pro-ceeding 1st Asian Conference on Unsaturated Soils
UNSAT-Asia 2000, in Rahardjo, H., Toll, D.G.,
and Leong, E.C., (eds.), 2000, pp. 627-632.
3 Komine, H. and Ogata, N., Predicting Swelling Characteristics of Bentonites, Journal of Geotechnical and Geoenvironmental Engineering,
Vol. 130, No. 8, 2004, pp. 818–829.
4 Sridharan, A., Rao, A.S., and Sivapullaiah, P.V., Swelling Pressure of Clays, Geotechnical Testing
Journal, GTJODJ, Vol. 9, No. 1, 1986, pp. 24-33.
5 Chen, F.H., Foundation on Expansive Soil,
Development in Geotechnical Engineering 12,
Elsevier Scientific Publishing Company, New York, USA, 1983.