Behavior of Expansive Clay of Ngawi Region (East Java) Under
Water Content Variation
Sudjianto, A. T.1, Suryolelono, K. B.1, Rifa’i, A.1, Mochtar, I. B. 2
Abstract: When expansive clay is wetted, deformations occur both vertically and laterally. If it is tested in an oedometer ring apparatus the lateral deformation will be restrained by the wall of the ring. This paper present the results of an experimental investigation using modified oedometer test for measuring the vertical and lateral swelling potential and lateral pressure of disturbed expansive clay soil. Series of modified oedometer tests were conducted with initial water content of 20%, 25% and 30%, to predict the vertical and lateral swelling potential and lateral swell pressure. The results of the test show that the percentages of the vertical swell is bigger than the lateral swell. Both vertical and lateral swell, linearly decrease with increasing initial water content. The lateral swell pressure also decreases with increasing initial water content.
Keywords: expansive clay, vertical swelling potential, lateral swelling potential, lateral swell pressure, modified oedometer.
Introduction
Expansive clay is a very important type of regional soil. Expansive clay problems exist in most countries in the world causing serious hazards. Increased awareness of the structural damages associated with expansive soils has led to more attention on different aspects associated with building on expansive clay.
The volume change measurement of the expansive clay is usually performed under one-dimensional loading conditions in the odometers. A multi dimensional test result can be obtained by modifying the oedometer test by installating strain gauge tranducers on the ring of the oedometer.
This paper presents the results of an experimental investigation using modified oedometer for evaluating the vertical and lateral swelling potential and lateral swelling pressure of expansive clay under one-dimensional loading conditions. The lateral swell is measured using strain gauge tranducers [1].
1 Civil Engineering Department, Gadjah Mada University,
Jogyakarta, Indonesia Email: [email protected]
2 Civil Engineering Department, Institute Technology of Surabaya,
Surabaya, Indonesia
Note: Discussion is expected before November, 1st 2009, and will be published in the “Civil Engineering Dimension” volume 12, number 1, March 2010.
Received 4 March 2008; revised 20 February 2009; accepted 5 May 2009.
Series of modified oedometer tests are conducted and the influence of initial water content on the predicted vertical and lateral swell potential and lateral swell pressure were evaluated.
Properties of Expansive Soils
The soil samples for this study were brought from Ngawi region, East Java province. Experiences in the region showed some of the largest differential ground movements in Indonesia. Soil samples were obtained from a test pit at a depth of about two meters. The expansive clay at the site is gray-green to yellowish weathered clayey shale.
Several tests were carried out to provide a set of data for identifying the degree of expansiveness of the soil including Atterberg limit and chemical soil test. The results were presented in Tables 1 to 3, showing respectively the soil properties, chemical, and mineral composition of the soil.
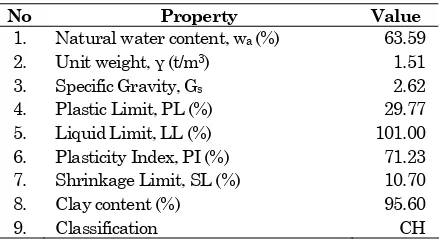
Table 1. General Soil Properties
No Property Value
1. Natural water content, wa (%) 63.59 2. Unit weight, γ (t/m3) 1.51
3. Specific Gravity, Gs 2.62
4. Plastic Limit, PL (%) 29.77
5. Liquid Limit, LL (%) 101.00
6. Plasticity Index, PI (%) 71.23 7. Shrinkage Limit, SL (%) 10.70
8. Clay content (%) 95.60
Table 2. Chemical Composition
No Property Value (%)
1. SiO2 76.10
2. Al2O3 18.59
3. Fe2O3 2.75
4. CaO 1.80
5. MgO 0.50
6. Na2O 0.22
7. K2O 0.04
Based on the quantitative analyses and diffraction tests, the mineral composition of the clay, was presented in Table 3.
Table 3. Mineral Composition
No Property Value (%)
1. Montmorilonite 76.10
2. Feldspar 16.20
3. Alpha Quartz 5.30
4. Halloysite 4.30
5. Cristobalite 0.90
The degree of expansiveness of the clay was identified as expansive soil with very high swelling potential following the procedures proposed by several researchers including Holts and Gibbs [2],
Seed et al. [3], Van Der Merwe [4], Dakssanamurty and Raman [5], and Chen [6]. The clay is classified as expansive soil with very high swelling potential if the percentage of montmorillonite is greater than 35% from total composition of the mineral.
Test Method
The first series of tests were conducted to investigate the effect of initial water content on the vertical swelling and swelling pressure of clay. The samples were prepared at three different initial water content, 20%, 25%, and 30%. The second series of tests were carried out to investigate the effect of initial water content on the lateral swelling of the clay.
The samples from sampling tube were prepared under three different initial water contents. The samples are remolded and placed on the ring oedometer with the same density. In order to get the same density the following formula is used:
W = 79.76 γd (1 + w) (1)
in which W is the weight of the clay in gr, γd is the dry density (gr/cm3), and w is the water content (%).
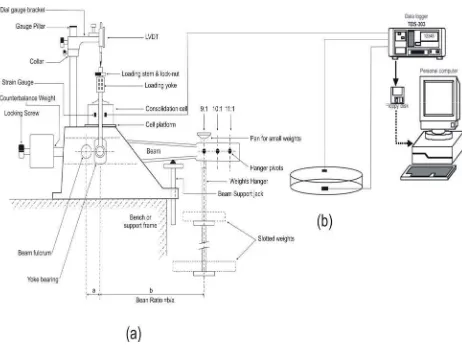
The vertical and lateral swelling potential tests were conducted in accordance to ASTM D4546-96 [7]. The modified oedometer test is used to measure the vertical and lateral swelling potential (Figure 1). The specimens were 6.35 cm in diameter and 2 cm thick. The applied initial pressure was 6,9 kPa (1 psi) [2, 3, 6] included porous stone and block pressure.
The vertical swelling potential is measured using Linear Vertical Displacement Tranducer (LVDT) and the lateral swelling potential using strain gauges. Strain gauges are installed on the ring oedometer using rectangular rossets. The swelling pressure tests were conducted in accordance to ASTM D 2435 – 96 [7].
Figure 2. Modified oedometer test [8]
The swelling pressure test was done after the swelling potential test (after applying effective stress of 6.9 kPa) and continued with consolidation test with applied effective stress of 16.9 kPa, 26.9 kPa, 46.9 kPa, 86.9 kPa, 166.9 kPa, 326.9 kPa, 646.9 kPa, and 1286.9 kPa.
Results of Tests and Analysis
Vertical Swelling Potential
The vertical swell potential was measured with initial water content of 20%, 25% and 30%. The result can be seen in Table 4 and Figure 3.
It can be seen in Figure 3 that the initial water content has a significant effect on the magnitude of the vertical swell of the tested soil. When the initial water content increases from 20% to 30%, the ultimate vertical swell decreases from 25.57% to 10.32% respectively.
Table 4. Results of the vertical swell test
Initial
Figure 4 shows the trend of decrease in the ultimate vertical swell with increase in the initial water
-5
Initial Water Content = 20%
Initial Water Content = 25%
Initial Water Content = 30%
content. The gradual reduction of ultimate swelling with respect to initial water content implies that there should be an equilibrium position at which this value becomes almost stable. Extrapolating the linear relationship of Figure 4, the intersection with the abscissa indicates the initial moisture content at which the soil will experience no vertical swell potential. This value, termed the “null moisture
content,” can be found to be about 24% for the tested
clayey shale. This value is quite below the plastic limit of 30%. Dhowian et al [9]; Edil and Alanazy [10], have shown that the swell of samples tested in the odometers apparatus, stabilizes at moisture content close to the plastic limit of the tested soils.
Lateral Swelling Potential
To study the lateral swelling potential under one dimensional loading condition, one series of swell test were conducted. The same samples tested for vertical swelling potential test are used. The lateral swelling potential was predicted using strain gauges installed to the ring of the oedometer (Figure 1).
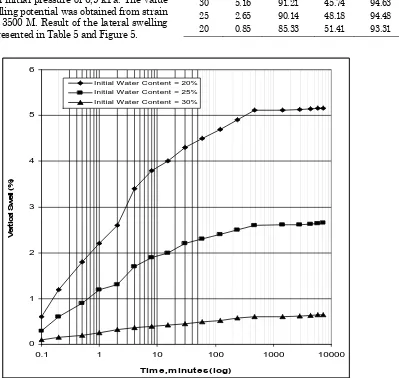
These values of lateral swelling potential were obtained with initial pressure of 6,9 kPa. The value of lateral swelling potential was obtained from strain indicator P – 3500 M. Result of the lateral swelling potential is presented in Table 5 and Figure 5.
0
Initial Water Content (%)
Figure 4. Relationship between initial water content and vertical swell potential.
Table 5. Results of the lateral swell test
Initial
Initial Water Content = 20% Initial Water Content = 25% Initial Water Content = 30%
It can be seen from Figure 5 that the initial water content has a significant effect on the magnitude of the lateral swelling potential of the expansive clay. As the initial water content increases from 20% to 30%, the values of lateral swell decreased from 5.16% to 0.85%.
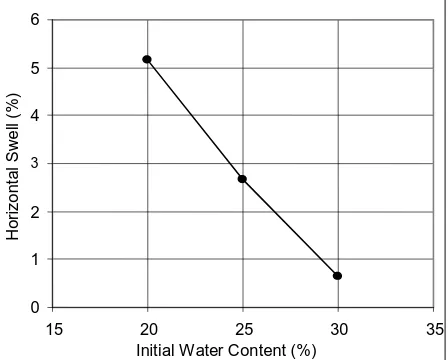
Figure 6 shows the relationship between initial water content and the lateral swell potential. This relation is similar with relation between initial water content and the vertical swell potential (Figure 4). It can be seen from Figure 6 that there is a trend of decreasing lateral swell potential with increasing initial water content.
The Swelling potential ratio (SPr) is defined as the ratio of the lateral swelling potential to the vertical swelling potential. It was found that the swelling potential ratio changes from 0.06 to 0.20 as the initial water content changes from 30% to 20% respectively.
The test results also indicate that the magnitude of the vertical swelling potential is higher than the magnitude of the lateral swelling potential for the soil sample under the same test condition (Figure 7). The data tend to indicate that the swelling ratio linearly decreases with increasing initial water content.
Swelling Pressure
The values of swelling pressure were obtained from the strain gauges installed in the modified oedometer test. The result of the lateral swelling pressure test can be seen in Table 6 and Figure 8.
Table 6. Results of the lateral swelling pressure test
Initial
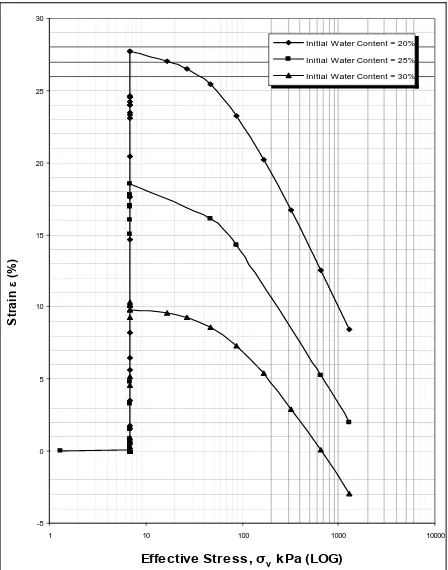
It can be seen from Figure 8 that the initial water content has a significant effect on the magnitude of the swelling pressure of the disturbed expansive clay soil. When the initial water content increased from
20% to 30%, the values swelling pressure decreased from 5100 kPa to 655 kPa respectively.
Figure 9 shows the relationship between initial water content and the values of lateral swelling pressure. The gradual reduction of lateral swelling pressure with respect to initial water content implies that there should be an equilibrium position at which this value becomes almost stable. This relation is similar with relation between initial water content and swelling potential. The swelling pressure decreases with the increase in the initial water content.
Initial Water Content (%)
H
Figure 6. Relationship between initial water content and lateral swell potential.
0
Initial Water Content (%)
Sw
-5
1 10 100 1000 10000
Effe ctive Stre ss, σv k Pa (LOG)
Initial Water Content = 20% Initial Water Content = 25% Initial Water Content = 30%
St
Figure 8. Lateral swelling pressure versus effective stress for different initial water content.
0
Initial Water Content (%)
L
Figure 9. Relationship between initial water content and lateral swelling pressure.
Conclusions
The experimental study of expansive soil from Ngawi region (East Java) presented in this paper includes the performance of one series of swell tests under one dimensional loading condition using a modified oedometer test. The influence of initial water content on swelling potential and swelling pressure can be concluded as follows:
1. The clay soil in Ngawi region is classified as expansive soil with very high swelling potential. The vertical swelling potential is higher than lateral swelling potential.
2. The vertical and lateral swelling potential linearly decreases with increasing initial water content.
3. Swelling potential ratio (SPr) decreases with increasing initial water content.
4. The lateral swelling pressure linearly decreases with increasing initial water content.
References
1. Suhendro, B, The Theory Model and Experimental, Gadjah Mada Press, Jogjakarta, Indonesia, 2000.
2. Holtz, W.G. and Gibbs. H. J., Engineering Properties of Expansive Clays. Proc.ASCE, Vol. 80, Separate No. 516. 1956, pp. 1-28.
3. Seed, H.B., Woodward, R. J., and Lundgreen, R., Prediction of Swelling Potential For Compacted Clays. J. Of The Soil Mechanics And Foundation
Division, ASCE, 88(3), 1962, pp. 53-87.
4. Van der Merwe, D.H. The Prediction of Heave From The Plasticity Index And Percentage Clay
Fraction of Soil, Civil Engineers in South Africa.
6 (6), 1964, pp. 103-107.
5. Dakshahanamurthy, V. and Raman, V., A Simple Method of Identifying Expansive Soil.
Soil and Foundations. 13(1), 1973, pp. 97 – 104.
6. Chen, F.H., Foundation on Expansive Soils, 2nd ed Amsterdam, Elseveier Scientific Publication Company, New York, USA, 1988.
7. ASTM, Annual Books of ASTM Standards
Section 4 Volume 04.08 Soil and Rock (I):
D420-D4914. 2003.
8. Sudjianto, A.T., Suryolelono, K.B., Rifa’i, A., Mochtar, I.B., Behaviour of Vertical and Lateral Swelling Pressure on Disturbed Highly Expansive Clay Under Water Content Variation Condition,
International Conference on Geotechnical and
Highway Engineering, Universiti Teknologi
Malaysia, Kuala Lumpur, Malaysia, 2008, Paper no G 21.
9. Dhowian, A.W., Erol, A.O., and Youssef., A.,
Evaluation of Expansive Soils and Foundation
Methodology in The Kongdom of Saudi Arabia.
Final Report, KACST, AT-5-88, 1990.
10.Edil, T.B. and Alanazy, A.S., Lateral Swelling Pressures, Proc.7th Int. Conf. on Expansive Soils,
![Figure 2. Modified oedometer test [8]](https://thumb-ap.123doks.com/thumbv2/123dok/3672510.1469740/3.595.123.463.496.762/figure-modified-oedometer-test.webp)