DOI: 10.12928/TELKOMNIKA.v15i2.6116 778
Desktop Tomography System using Planar ECT Device
Shahrulnizahani Mohammad Din1, Nur Adila Mohd Razali2, Jaysuman Pusppanathan3, Chee Pei Song4, Ruzairi Abdul Rahim5, Leow Pei Ling*6
1,2,3,6
PROTOM-i Research Group, Faculty of Electrical Engineering, Universiti Teknologi Malaysia, 81310 Skudai, Johor, Malaysia
4
Lee Kong Chian Faculty of Engineering and Science, Universiti Tunku Abdul Rahman, 43000, Kajang, Selangor, Malaysia
5
Universiti Tun Hussein Onn Malaysia (UTHM) 86400 Parit Raja, Batu Pahat, Johor, Malaysia *Corresponding author, e-mail: leowpl@fke.utm.my
Abstract
Miniaturized planar electrical capacitance tomography (ECT) device is fabricated using microfabrication method to accommodate eight planar electrodes to carry out electrical capacitance measurement using tomography technique. Fluids within the detection chamber are detected by the difference of the permittivity parameters. Stagnant and hydrodynamic multiphase samples such as liquid-gas and liquid-liquid are tested. The eight-electrode planar array is fabricated on the copper plated printed circuit board (PCB) and the chamber is fabricated using polymer poly(dimethyl-siloxane) (PDMS). The images of the multiphase sample are reconstructing using Linear Back Projection algorithm (LBP). Computer interface software is developed to display the images of the fluid online. Experimental results show that the reconstructed images closely resemble with the composition of the multiphase sample within the detection chamber.
Keywords: Desktop Tomography System, Miniaturized ECT system, Electrical Capacitance Tomography, Planar Electrodes, Permittivity
Copyright © 2017 Universitas Ahmad Dahlan. All rights reserved.
1. Introduction
Tomography system has been used in medical since 1900 [1]. The famous computated tomography (CT) Scan in the medical diagnotic system uses tomography approach to obtain
cross sectional images of patients. Later, in 1990’s tomography has been introduced to
manufacturing and industrial processes to allow inspection within closed section pipelines in food industry, chemical, petrochemical, food and biochemical industries [2]. Tomography system either in the medical or industrial sectors are often huge in size with sophisticated setup. The huge and bulky tomography setup can attribute to high material and fabrication cost. Furthermore the bulky setup does not allow the unit to be transferred or relocate to other lab or location easily. In addition, the setup of a tomography system within teaching laboratory often require space. However due to the recent interest on the small scale detection within lab on chip, the application of miniaturized tomography has increasingly popular over the last few years [3].
mostly stagnant samples or samples with minimum and discontinue flow rate.
This paper discusses the features of the developed desktop tomography system with online detection for stagnant and dynamic sample by using a miniaturized planar electrical capacitance tomography (ECT) device. The system consists of the planar ECT device, the process flow in the miniaturized electrical tomography device. The system adopted Electrical Capacitance Tomography (ECT) principles as it uses copper electrodes to detect the variation of permittivity in the region of inspection [21]. Two states of multiphase sample is tested in this paper; stagnant and hydrodynamic flow. The electrical capacitance tomography detects the permittivity variation and the planar capacitance value is represented by the equation (1):
reconstructed images is determined by measuring the pixel density comparing the real image and the reconstructed image using pixelating method. The percentage error is calculated using equation (2). camera while M represents the reconstructed image or the tomogram. The error is calculated to determine the deviation between the reconstructed and the real image profile of the sample within the detection chamber.
Figure 1. Desktop Tomography System
From Figure 1, the ECT planar tomography device consists of 8-electrode ECT system within a circular chamber. The eight electrodes are connected to the 8-channel control unit for managing the electrode switching configuration. The 8-channel DAQ system enables the online data acquisition and the image reconstruction is performed in the computer with the developed program and GUI. The GUI also allows user to save and record the data and tomogram for monitoring purposes.
2.1. Miniature Planar ECT Device
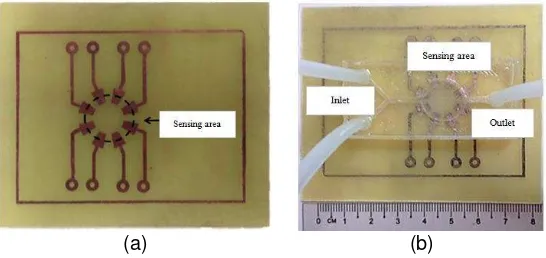
The developed ECT device configuration differs with the common ECT, which having the electrodes arranged around the pipe peripherally [21]. The miniature planar ECT device consists of 8-electrode planar tomography and the PDMS micro channel. The electrodes are fabricated on copper PCB with conductivity of σ = 5.69 × 10⁷ (S/m) at 20°C using the conventional etching technique while the PDMS micro channel is fabricated using moulding technique to create the structure of the channel. The integration of planar ECT and the PDMS is done to complete the device. The device consists of two inlets tube, a sensing chamber and the outlet tube. The inlet is designed with Y-shaped design to allow two different samples to flow at a time. This allows the system to experiment multiphase flow distribution.
(a) (b)
Figure 2. Miniaturized planar ECT device (a) printed electrodes (b) enclosed detection chamber
outer radius of the electrode area is 10 mm and the inner radius is 5.33 mm. The area of each electrode is 13.99 mm. The sensing area is at the middle of the electrode area as indicated in Figure 3, where the radius of the sensing area is 8 mm. Hence, the area of inspection of the desktop tomography device is 201.06 mm2. The percentage of the materials measured in the images obtained is calculated by using pixelating method for the error calculation.
2.2. Control Unit and Data Acquisition System
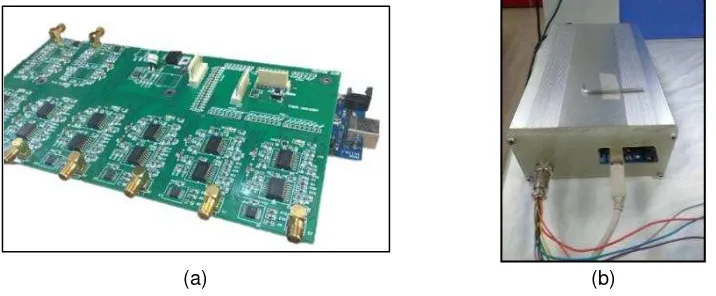
Figure 4 shows the 8-channel control unit and Data Acquisition System (DAQ), which are developed to acquire sensor signal from the ECT device and transfer the measurement data to control computer. The complete control unit consists of capacitance measurement circuit, amplifier circuit and the absolute value circuit which is connected to the 8-electrode of the desktop ECT system. In addition, the unit is equipped with Arduino Mega micro controller, which controls the sequence operation of the system from electrodes signal selection, the data measurement process and data conversion.
(a) (b)
Figure 4. Control Unit and Data Acquisition System
The data is digitized by 10 bit internal analog-to-digital converter of Arduino micro controller. The digital signal is transferred into control PC for image reconstruction using universal serial bus (USB) technology.
2.3. Graphical User interface for Online Data Display
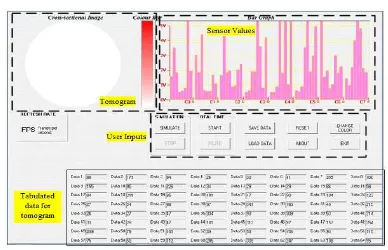
Figure 5. Graphical User Interface (GUI) for online data display
The GUI’s mainframe display tomogram of reconstructed image from the desktop tomography electrical device, the frame rates, the incoming sensor value as well as the final value of sensor voltage after reconstruction process. Tomogram displays distribution of the materials detected within the sensing area based on the measured data sent to the control PC. This allows online monitoring for flow measurement. The maximum frame rate achievable by the system is approximately 39 fps for a complete cycle. In addition, the system allows user to save the data for other comparison processes and experiments. The GUI also tabulates and arranges the incoming signal data obtained from the system hardware. The data signal is then processed using LBP algorithm and the sensor voltage value is displayed in graph bar for further analysis of the trend and tendency.
3. Results And Analysis
Stagnant and dynamic multiphase samples are tested with the device in order to reconstruct images online. For stagnant sample, the feasibility of the device is tested with different location of the water sample and different concentration of water sample inside the sensing area. Water-air flow measurement is used for hydrodynamic test.
3.1. Stagnant Sample
Firstly, the feasibility of the desktop tomography device is tested based on the location of the sample. Stagnant water is filled up in the chamber and a gas bubble is position in the chamber. The comparison between real experiment water sample and reconstructed images are presented in Figure 6.
In Figure 6, the water sample is colored with green color for easy visualization. From the reconstructed images, the miniature electrical device is able to detect the water sample inside the sensing area and produce the reconstructed images. In the reconstruction images,
Figure 6. The real image and reconstructed image of the stagnant water sample
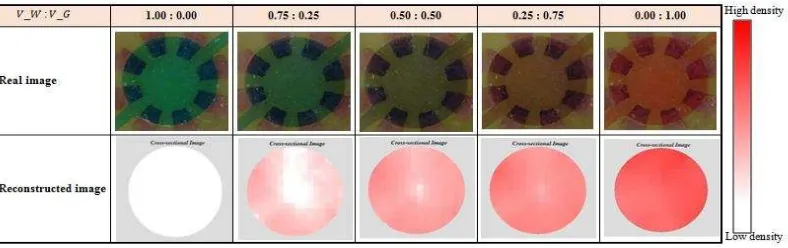
Another test conducted is for stagnant flow by using different concentration of sample. A 300 mM of glucose is prepared by dissolving 5.6 g of glucose into 100 ml of water. The 300 mM glucose solution is added into water to prepare 5 samples of different glucose concentration. The prepare samples were with ratio of water to glucose solution (Vw: VG) at 1.0:0.0, 0.75:0.25, 0.5:0.5, 0.25:0.75 and 0.0:1.0. The result of the concentration profile and images are presented in Figure 7.
Figure 7. Water and glucose concentration test
From Figure 7, the first test is for 100% water and 0% glucose. The tomogram image shows no changes of the image as water is used as the standard limit for this test. As the concentration of the glucose increases, the gradient concentration in the reconstructed images increase. The darker red color represent higher density and concentration of the solutions. The highest density can be observed for the 100% glucose solution.
3.2. Hydrodynamic Sample
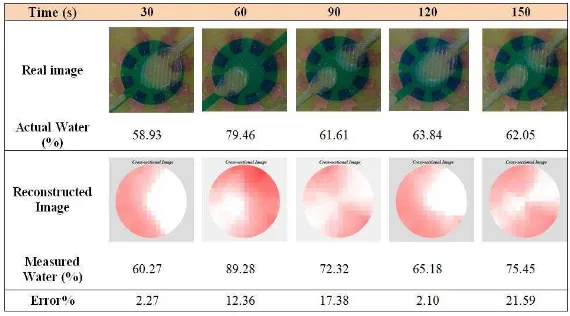
For the hydrodynamic study, the water flowing continuously at 12 ml/min into the sensing chamber. Small amount of air is injected to the device via another inlet. Figure 8 shows the reconstructed images at different recorded time.
error for larger size of air bubble. Despite of the error percentage, from Figure 8, the reconstructed images shows good matching of air bubble pattern in the chamber.
Figure 8. Tomogram of Liquid-Air samples in flow regime
4. Conclusion
The desktop tomography system is able to show the image of the stagnant and hydrodynamic flow. Several tests were conducted including multiphase detection and concentrate difference in the sensing area. The tests were conducted with liquid-air distribution in stagnant and flow regime. The desktop tomography electrical device able to detect different permittivity inside the chamber. The device also able to detect and reconstruct images for miscible water-glucose samples with different concetrations. Stagnant samples give better reconstructed images as the samples are not moving and give enough time for the data sending and image reconstruction process. The tomograms from both stagnant the hydrodynamic flow tests, shows that images are matching the real images recorded with the highest error at 21.59%.
Acknowledgements
The authors would like to acknowledge the financial support from Universiti Teknologi Malaysia through the Research University Grant (Q.J130000.2609.11J62 & Q.J130000.2523.05H29) and UTARRF (IPSR/RMC/UTARRF/2015-C2/C03).
References
[1] Hendee WR. Cross Sectional Medical Imaging: A History. RadioGraphics. 1989; 9: 1155-1180. [2] Beck MS, Williams RA. Process tomography: a European innovation and its applications.
Measurement Science and Technology. 1996; 7(3): 215.
[3] Göröcs Z, Ozcan A. On-Chip Biomedical Imaging. IEEE Biomedical Engineering. 2013; 6: 29-46. [4] El-Ali J, Sorger PK, Jensen KF. Cells on chips. Nature. 2006; 442(7101): 403-411.
[5] Sun T, Tsuda S, Zauner KP, Morgan H. Single Cell Imaging Using Electrical Impedance
Tomography. 4th IEEE International Conference on Nano/Micro Engineered and Molecular Systems.
2009.
[6] Razali NAM, Azmi A, Din SM, Chee PS, Ayob NMN, Rahim RA, et al. Miniaturized Planar Tomography for Multiphase Stagnant Sample Detection. Jurnal Teknologi. 2015; 73(6): 99-102. [7] Bardin D, Lee AP. Low-Cost Experimentation for the Study of Droplet Microfluidics. Lab Chip. 2014;
14(20): 3978-3986.
[8] Elbuken C, Glawdel T, Chan D, Ren CL. Detection of Microdroplet Size and Speed using Capacitive Sensors. Sensors and Actuators A: Physical. 2011; 171(2): 55-62.
Systems and Integrated Circuits. 2012; 2(2).
[18] Fu F, Kong M, Xu C, Liang C, Shimin Wang. Flow Characterization of Dense-Phase Pneumatic Conveying System of Pulverized Coal through Electrostatic Sensor Arrays. Advances in Mechanical Engineering. 2013; 2013: 1-13.
[19] Gut Z, Wolanski P, Oleszczak P. Monitoring Of Combustion Processes in Industrial Burners Using Electrical Capacitance Tomography. Journal of KONES Powertrain and Transport. 2011; 18(3): 117-121.
[20] Yang WQ, York TA. New AC-based Capacitance Tomography System. IEE Proceedings - Science, Measurement and Technology. 1999; 146(1): 47-53.