Asia Pacific menu patterns in relation to lipid abnormalities: An Indonesian
perspective
Walujo Soerjodibroto
Abstrak
Penduduk di kawasan Asia Pacifik memiliki asupan nutrisi serta status nutrisi yang sangat beragam. Asupan enersi harian serta proporsi asupan lemak dalam makanan yang tertinggi ditunjukkan oleh penduduk Selandia Baru (enersi total 3475 Kkal; proporsi lemak 37,2% atau 1293 Kkal), sedangkan yang terendah adalah penduduk Thailand (enersi total 2288 Kkal; proporsi lemak 13,1% atau 300 Kkal). Sedangkan penduduk Indonesia adalah nomor tiga dari bawah (enersi total 2631 Kkal; proporsi lemak 14,5% atau 381,9 Kkal). Asupan lemak hewani adalah 29,7% (1033 Kkal) dari asupan enersi harian total pada penduduk Selandia Baru, sedangkan mortality rate untuk penyakit jantung koroner (CHD) juga yang tertinggi (228 per 100.000 penduduk untuk pria dan 173 untuk wanita). Sebaliknya, asupan lemak hewani penduduk Indonesia hanya 1,47% (38,7 Kkal) dari asupan enersi harian total, sedangkan mortality rate di bawah 50 per 100.000 penduduk untuk pria dan wanita. Dibanding dengan nilai limabelas tahun sebelumnya, asupan lemak hewani penduduk Selandia Baru telah menurun 90%, Australia 88%, Filipina 99%, sedangkan Indonesia justru meningkat 157%. Di Selandia Baru dan Australia, proporsi kematian akibat penyakit kardio-vaskuler (CVD) untuk pria adalah di atas 40% dari total kematian. Sebaliknya, Jepang adalah sebuah negara maju tetapi memiliki mortalty rate untuk CVD kurang dari 30% dari total kematian. Dengan nilai ini, Jepang setara dengan negara yang kurang begitu maju seperti Malaysia dan Filipina. Namun dalam hal cerebrovascular (stroke) mortality, Jepang tergolong kelompok dengan kategori tertinggi. Nampaknya selain asupan lemak yang tinggi, stres dan mungkin juga berbagai faktor lain menjadi sebab utama timbulnya stroke. Nilai rata-rata asupan enersi harian total penduduk Indonesia adalah 2631 Kkal, yang terdiri atas 8,7% protein (228,9 Kkal, 52,2 g), 76,8% hidratarang (2020 Kkal, 505 g), dan 14,5% lemak (381,9 Kkal, 42,4 g). Asupan lemak hewani penduduk Indonesia hanya 4,3 g perhari (38,7 Kkal) yakni sebesar 1,47% dari asupan enersi harian total. Walau rendah, namun nilai ini meningkat 157% dari nilai limabelas tahun sebelumnya. Mortality rate untuk CHD di Indonesia masih relatif rendah (di bawah 50 per 100.000), namun ini hanya soal waktu saja dan akan segera meningkat sejalan dengan meningkatnya asupan lemak (terutama hewani) dan asupan enersi total. (Med J Indones 2004; 13: 252-7)
Abstract
Countries in the Asia-Pacific region differ widely with respect to their nutritional intake and nutritional status. The highest daily energy and proportion of fat intakes of the population is shown by the New Zealanders (total energy 3475 Kcals; fat proportion 37.2% or 1293 Kcals), while the lowest is the Siamese (total energy 2288 Kcals; fat proportion 13.1% or 300 Kcals). The Indonesian on the other hand, is at the third from the bottom (total energy 2631 Kcals; proportion of fat is 14.5% or 381.9 Kcals). Animal fat contributes to 29.7% (1033 Kcals) of the total daily energy intake of the New Zealanders (total 3475 Kcals), and the mortality rate coronary heart disease (CHD) is also the highest (228 per 100,000 populations for men and 173 for women). In contrast, the proportion of animal fat in Indonesian menu is only 1.47% (38.7 Kcals) of the total daily energy intake, while the CHD mortality rate is still below 50 per 100,000 for both men and women. Compared to the same values fifteen years before, animal fat intake of the New Zealanders has a decrease of 90%, Australian 88%, Philippines 99%, however the Indonesian on the other hand, has an increase of 157%. In New Zealand and Australia, the proportion of mortality attributed to cardiovascular disease (CVD) for men accounts for over 40% of total mortality. Japan however, the proportion mortality rate for CVD is only less than 30% of total mortality. In this level, Japan places itself among less industrialized group such as Malaysia and the Philippines. In the case of cerebrovascular (stroke) mortality however, Japan belongs to the highest category group. It seems that apart of high fat intake, stress and possibly also other factors play a major role in the development of stroke. The mean Indonesian total energy intake is 2631 Kcals, consisting of 8.7% protein (228.9 Kcals, 52.2 g), 76.8% carbohydrate (2020 Kcals, 505 g), and 14.5% fat (381.9 Kcals, 42.4 g). Animal fat intake is only 4.3 g/day (38.7 Kcals) which is 1.47% of the total energy intake. Although appears to be low, but it has a 157% increase if compared to the same value fifteen years before. Indonesian CHD mortality rate is still relatively low (below 50 per 100,000), however it is only a matter of time that the this value will soon increase in line with the increase of fat (especially animal fat) and total energy intakes. (Med J Indones 2004; 13: 252-7)
Keywords : Asia Pacific, Indonesia, menu pattern, energy, protein, fat, animal fat, mortality rate, cardiovascular disease, coronary heart disease, cerebrovascular disease
The Asia Pacific region represents an important area in terms of its economic, technological, and demo-graphical resources. The population of this region accounts for about one-third of the total global population involving countries which have a multitude of ethnic groups with widely diverse dietary habits. The health risk of these countries range from traditional of environmental problems (such as poor sanitation and health) and modern agricultural hazards, to those associated with urbanization and industrialization (including chronic non-communicable diseases).
Countries in this region differ widely with respect to their nutritional status. They range from countries still suffering from under-nutrition, to those having over-nutrition related health problems. In between, there are countries which are under transition, which are
facing both the “old” problems of nutritional deficiencies
together with the new ones of over-nutrition and their related complications. Such countries are China, Taiwan, Thailand, Malaysia and Indonesia.
DIVERSITY OF MENU PATTERN
There are a wide diversity of ethnic groups living in this region, each of which having their own way of life and their own food habits. Food habit on the other hand will always influence menu pattern. As blood lipid profile is commonly associated strongly with menu pattern, it is therefore interesting to observe the effects of different food and menu patterns to their lipid profiles.
There are several macro-nutrients which are known to contribute to the increase of blood lipids. The main contributor is of course the daily dietary fat, while the others are the simple carbohydrate and sugar intakes. However, any nutrient which potentially can be converted to energy, thus can be converted to acetyl-coenzyme-A, will eventually be able to increase the blood lipids (cholesterol and triglyceride).
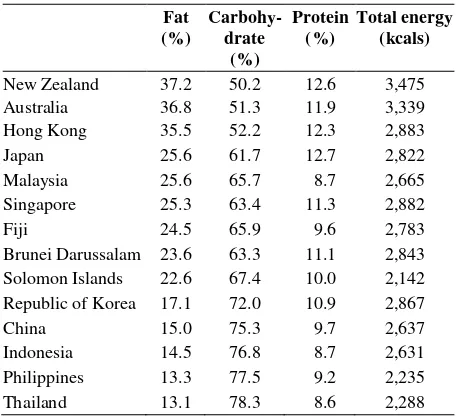
Table 1 summarizes the proportions of macro-nutrients (fat, carbohydrate, and protein) of various menu patterns of Asia Pacific region. It shows that the highest fat intake is shown by the New Zealanders (37.2% or 1293 Kcals), followed by the Australians (36.8% or 1229 Kcals), Hong Kong people (35.5% or 1023 Kcals), then the Japanese (25.6% or 738 Kcals). The Indonesian is on the third from the bottom (14.5% or 381,9 Kcals), and the lowest is the Siamese (13.1% or 300 Kcals). New Zealanders have the
highest energy intake (3475 Kcals), followed by the Australian (3339 Kcals), the Hong Kong people (2883 Kcals), and then the Japanese (2882 Kcals). The Indonesians is on the third from the bottom (2631 Kcals) after the Philippines (2235 Kcals) and the Siamese (2288 Kcals, the lowest).1
Animal fat contributes to 29.7% (1033 Kcals) of the total daily energy intake of the New Zealanders (total 3475 Kcals). The proportion of animal fat in the Australian menu is 23.7% (790 Kcals) of the total energy intake (total 3339 Kcals). In contrast, the energy intake from animal fat is relatively low in the developing countries. The proportion of animal fat in Indonesian menu is 1.47% (38.7 Kcals) of the total energy intake (total 2631 Kcals). The proportion of fat
in the Philippines’ menu is 6.2% (138.6 Kcals) of the
total energy intake (2235 Kcals). Compared to the same values fifteen years before, animal fat intake of the New Zealanders has a decrease of 90%, Australian 88%, Philippines 99%, however the Indonesian on the other hand have an increase of 157%.1
level is in line with that for industrialized countries (49%).2 However, Japan is an exceptional among industrialized countries in that its mortality due CVD accounts for less than 30% of total death cases. In this level in, Japan places itself among less industrialized group such as Malaysia and the Philippines. In comparison, Singapore and the urban parts of China have intermediate mortality levels for CVD which lie between 30-40% of total deaths.2
The low proportionate mortality for CVD in some countries like Thailand, Malaysia and Indonesia could be due in part to the fact that these countries have a low proportion of death cases that are medically inspected and certified. For example, in Malaysia, only about 41% of the annual total deaths are medically certified,3 compared to 65-70% in Singapore4 and 100% in Australia, New Zealand and Japan,5 For countries with a relatively low rate of medical certification, the cause-of-death statistics refer largely to only the urban population or selected sub-population groups. Hence, the interpretation of such data may not too accurate.
Coronary heart disease (CHD) is one of the major contributors of CVD mortality. In New Zealand, Australia and Singapore CHD mortality rate exceeds 100 per 100,000 populations for all ages. New standardized to world standard population however, the CHD mortality in Singapore is somewhat similar to Australia. In Singapore, the mortality rate (age-standardized per 100,000) is 132 for men, and 78 for women. While the age-standardized mortality rate in Australia is 140 for men, and 73 for women. The respective value for New Zealand (which is the highest CHD mortality rate) is 173 for men and 84 for women.6
Hong Kong belongs to the next highest category group of CHD mortality rates with a value of 50-100 per 100,000 populations. Heart diseases with CHD as the major category have become the second leading cause of mortality during the past 20 years.7 Socio-economic class is known to influence CHD mortality patterns. It has been reported in Hong Kong that the more affluent population groups, which include professional, administrative and managerial workers,
have higher mortality rates for CHD than do manual and agricultural workers.8, 9
The third category group, with the lowest range of CHD mortality rates of below 50 per 100,000, includes Japan, China, the Philippines, Malaysia, Thailand7 and Indonesia.10 Japan stands out as an industrialized country influenced by a Western lifestyle but at the same time, it shows a low CHD mortality rate. When compared on the basis of age-standardized to world standard population, the CHD mortality of Japan (at 28 per 100,000) is about one-sixth that of New Zealand (at 173) and one-fifth that of Australia (140) for both sexes.6 Regional differences exist in that age-adjusted CHD mortality is higher in urban prefectures such as Tokyo and Osaka than in the rural counterparts.11
TRENDS IN CARDIOVASCULAR DISEASE MORTALITY
The trend in coronary heart disease (CHD) mortality in industrialized countries was generally upward until the late 1960s.12 CHD became the leading cause of mortality for middle-aged and older people. Nonetheless, the situation has reversed since the early 1970s with the CHD mortality trend on the decline. For example in the Asia Pacific region, it was reported that between 1969-78, Australia showed a decline of 24% for men aged 45-64 years of age, and New Zealand decreased by 22%. Further declines were shown between 1979-85 for men of this age group, with decreases of 25% and 20% respectively for Australia, and New Zealand. Women aged 45-64 in these countries also experienced substantial declines in CHD mortality during these two periods.13
Cardiovascular disease (CVD) in Australia is no longer the major cause of death among young and middle-aged men and women.14 Most deaths in this group are due to cancer. Nonetheless, CVD remains the major cause of death among the elderly of both sexes. However, that despite the significant decline of CHD mortality in both Australia and New Zealand in the past two decades, CHD is still the leading cause of death in these countries. By world standards, CHD death rates in Australia and New Zealand remain high.15
Island populations. China, Taiwan and Japan rank highest in terms of stroke mortality in the region. The mortality rates for cerebrovascular disease in these three countries stand close to 100 or higher per 100,000 population for men and women for all ages.16 In China, stroke is the leading cause of death, while in Taiwan; it currently ranks second, next to cancer, after being the main cause of death for almost 20 years provinces of China have a higher incidence of stroke and mortality rate from stroke then the south.19 Unlike in the case CHD mortality rate where Japan does not belong to the highest category group, in the case of cerebrovascular (stroke) mortality Japan in one of the Asia Pacific countries which has the highest rate. In Japan, workers in agriculture, sales, transportation and service industries have higher rates of cerebrovascular disease than those in managerial and administrative positions.20 It seems that, apart from high fat intake, stress and possibly also other factors, contribute to the development of stroke.
Countries in the region with a lower mortality rate for stroke of 50-100 per 100,000 populations include New Zealand, Australia, Singapore and Hong Kong. Their stroke mortality rate for men in 1991/92 ranged from 39 per 100,000 population in Australia and 72 for Singapore, and among women, the rate ranged from 34 per 100,000 populations for Australia to 68 for Singapore.6
The next group of countries in the region with the lowest level of stroke mortality rate is the Philippines, Malaysia and Thailand,21 and possibly Indonesia. Their stroke mortality rate is below 50 per 100,000 populations. The question that arises is, as previously mentioned with CHD mortality, whether the low stroke mortality rate actually reflects the real situation, or is it due to under-reporting of cases owing to a low level of medically certified death cases in these countries.
Slightly more men than women die from cerebro-vascular disease when the stroke mortality rate between men and women is compared on the basis of age-standardized to world population. The stroke mortality female: male ratio in the region ranges from 0.7 for Japan and China, to 0.8 for Taiwan and Hong Kong and to 0.9 for Australia, New Zealand and Singapore.6, 22
MENU PATTERN AND FAT INTAKE IN INDONESIA
There in no such a thing as “Indonesian menu” as Indonesians consist of many different ethnic groups with their own specific diets. Coconut milk / cream (santan) and oil have always been the main ingredients in most Indonesian menu. In the past, they have given minimal adverse health effects. Nowadays however, people change their life style and modify their food habits. Most Indonesians now tend to do less physical activities; however they largely still retain most of their old food habits (the high intake of santan together with coconut oil). There are also additional problems related to urbanization which further worsen the situation. It is understandable therefore, that Indonesian menu nowadays tends to contribute to the increase of blood lipids.
As it is mentioned before, Indonesian statistics may not be too accurate, but it still is able to provide sufficient information on the increase of energy and fat intakes in Indonesian menu. The mean Indonesian total energy intake is 2631 Kcals, consisting of 8.7% protein (228.9 Kcals, 52.2 g), 76.8% carbohydrate (2020 Kcals, 505 g), and 14.5% fat (381.9 Kcals, 42.4 g).1 Animal fat intake is only 4.3 g/day (38.7 Kcals) which is 1.47% of the total energy intake. At first glance this value appears to be low. However, if compared to the same value fifteen years before, animal fat intake has a 157% increase.1 As a nation, Indonesia still has a relatively low CHD mortality rate which is below 50 per 100,000.10 However, it is only a matter of time that the CHD mortality rate will soon increase in line with the increase of fat (especially animal fat) and total energy intakes.
the actual low intake of energy, but more likely due to the difference in the technique of energy estimation. There are many studies which confirm the suspicion on the inaccurate value of the Indonesian recommended allowance for energy, which is more likely over-estimated and much too high.
Energy derived from fat in the Javanese, Sundanese, Minangese and the Buginese menu are 446 Kcals (49.6 g fat), 576 Kcals (64 g fat), 466 Kcals (57.8 g fat), and 193 Kcals (21.4 g fat) respectively.23 Except for the Sundanese which is higher, all groups show lower values compared with the recommended value for Indonesia, which is 700 Kcals (25% of total energy or 60 g fat).23 And except for the Buginese which is lower, all other groups show a higher value of fat intake compared to the value reported by FAO 1991, which is 381.9 Kcals (42.4 g fat).1 The major proportion of dietary fat of all groups is coconut milk / cream and oil.23
CONCLUSION
The highest daily energy and proportion of fat intakes of the Asia Pacific populations is shown by the New Zealanders (total energy 3475 Kcals; fat proportion 37.2% or 1293 Kcals), while the lowest is lowest is the Siamese (total energy 2288 Kcals; fat proportion 13.1% or 300 Kcals). The Indonesian on the other hand, is at the third from the bottom (total energy 2631 Kcals; proportion of fat is 14.5% or 381.9 Kcals).
Animal fat contributes to 29.7% (1033 Kcals) of the total daily energy intake of the New Zealanders (total 3475 Kcals), while the mortality rate CHD is also the highest (228 per 100,000 populations for men and 173 for women). In contrast, the proportion of animal fat in Indonesian menu is only 1.47% (38.7 Kcals) of the total energy intake, and the Indonesian CHD mortality rate is still below 50 per 100,000 for both men and women. Compared to the same values fifteen years before, animal fat intake of the New Zealanders has a decrease of 90%, Australian 88%, Philippines 99%, however the Indonesian on the other hand, has an increase of 157%.
In New Zealand and Australia, the proportion of mortality attributed to CVD for men accounts for over 40% of total mortality, which is in line with that for most industrialized countries. However, Japan has only less than 30% of total mortality. In this level in, Japan places itself among less industrialized group
such as Malaysia and the Philippines. In the case of cerebro-vascular (stroke) mortality however, Japan belongs to the highest category group. It seems that, apart of high fat intake, stress and possibly also other factors play a major role in the development of stroke.
The mean Indonesian total energy intake is 2631 Kcals, consisting of 8.7% protein (228.9 Kcals, 52.2 g), 76.8% carbohydrate (2020 Kcals, 505 g), and 14.5% fat (381.9 Kcals, 42.4 g). Animal fat intake is only 4.3 g/day (38.7 Kcals) which is 1.47% of the value will soon increase in line with the increase of fat (especially animal fat) and total energy intakes.
REFERENCES
1. Food and Agriculture Organization. Food Balance Sheets for Production and Utilization in the Asia Pacific Region. Bangkok: RAPA, 1991.
2. Lopez AD. Causes of death: an assessment of global patterns of mortality around 1985. World Health Statist Quart 1990; 43:91-104.
3. Malaysia Department of Statistics for Peninsular Malaysia, 1974-1991. Kuala Lumpur: Department of Statistics. 4. Emmanuel SC. Trends in coronary heart disease mortality
in Singapore. Singapore Med J 1989; 30:17-23.
5. World Health Organization. World Health Statistics Annual 1989. Geneva: WHO, 1990.
6. World Health Organization. World Health Statistics Annual 1993. Geneva: WHO, 1994.
7. Yu TS, Wong SL, Lloyd OL Wong TW. Ischemic heart disease: trends in mortality in Hong Kong, 1970-89. J Epidemiol Commun Health 1995; 49:16-21.
8. Lam YM, Lau EMC, Donnan SPB. Geographical and socio-economic variations in ischemic heart disease in men in Hong Kong. Ann Acad Med 1984: 13:211-5. 9. Wong SL, Donnan SPB. Influence of socioeconomic
status on cardiovascular diseases in Hong Kong. J Epidemiol Commun Health 1992; 46:148-50.
10. Boedhi-Darmojo R. The pattern of cardiovascular disease in Indonesia. World Health Statist Quart 1993; 46:119-24. 11. Hatano S. Changing CHD mortality and its causes in Japan
during 1955-1985. Int J Epidemiol 1989; 18:S149-S158. 12. Slattery ML, Randall DE. Trends in coronary heart
disease mortality and food consumption in the United States between 1909 and 1980. Am J Clin Nutr 1988; 47:1060-7.
13. Thom TJ. International mortality from heart disease: rates and trends. Int J Epidemiol 1989; 18:S20-S28.
15. Beaglehole R, Dobson A, Hobbs MST, Jackson R, Martin CA. CHD in Australia and New Zealand. Int J Epidemiol 1989; 18:S145-8.
16. Hu HH, Chu FL, Chiang BN, Lan CF, Sheng WY, Lo YK, Wong J, Luk YO. Prevalence of stroke. Stroke 1989; 20:858-63.
17. Shimamoto T, Komachi Y, Inada H, Doi M, Iso H, Sato S, Kitamura A, lida M, Konishi M, Nakanishi N, Terao A, Naito Y, Kojima S. Trends for coronary heart disease and stroke and their risk factors in Japan. Circulation 1989; 79:503-15.
18. Li SC, Schoenberg BS, Wang CC, Cheng XM, Bolis CL,
Wang KJ. Cerebrovascular disease in the People’s
Republic of China; Epidemiologic and clinical features. Neurology 1985; 335:1708-13.
19. Chonghua Y, Zhaosu W, Yingkai W. The changing pattern of cardio-vascular diseases in China. World Health Stats Quart 1993;46: 113-8.
20. Hatano S. Changing CHD mortality and its causes in Japan during 1955-1985. Int J Epidemiol 1989; 18:S149-58. 21. Poungvarin N, Kanluan T, Chawalitnithikul U. Risk
factors for cerebrovascular disease in urban community of Thailand. J Med Assoc Thai 1990; 73:653-6.
22. Guo W, Li JY, King H, Locke FB. Diet and blood nutrient correlations with ischemic heart, hypertensive heart, stroke mortality in China. Asia Pacific J Publ Health 1993; 6:200-9.
23. Hatma RD. Nutrient intake pattern and relation to lipid profiles in diverse ethnic population. PhD Thesis. Post Graduate Program University of Indonesia. Jakarta, 2001. 24. Widya Karya Nasional Pangan dan Gizi VI. Indonesian