ContentslistsavailableatSciVerseScienceDirect
Field
Crops
Research
j o ur na l ho me p a g e :w w w . e l s e v i e r . c o m / l o c a t e / f c r
Bulk
segregant
analysis:
“An
effective
approach
for
mapping
consistent-effect
drought
grain
yield
QTLs
in
rice”
Prashant
Vikram
a,
B.P.
Mallikarjuna
Swamy
a,
Shalabh
Dixit
a,
Helaluddin
Ahmed
a,1,
M.T.
Sta
Cruz
a,
Alok
K.
Singh
b,
Guoyou
Ye
c,
Arvind
Kumar
a,∗aPlantBreedingGenetics&BiotechnologyDivision,InternationalRiceResearchInstitute,DAPOBox7777,MetroManila,Philippines bDepartmentofGeneticsandPlantBreeding,V.B.S.PurvanchalUniversity,Jaunpur,India
cCropResearchInformaticsLaboratory,InternationalRiceResearchInstitute,DAPOBox7777,MetroManila,Philippines
a
r
t
i
c
l
e
i
n
f
o
Articlehistory:
Received26February2012
Receivedinrevisedform30May2012
Accepted30May2012
Keywords:
QTLs
Quantitativetraitloci
Selectivegenotyping
Bulksegregantanalysis
Grainyieldunderdrought
a
b
s
t
r
a
c
t
MappingQTLsforgrainyieldunderdroughtinriceinvolvesphenotypingandgenotypingoflarge map-pingpopulations.Thehugecostincurredingenotypingcould beconsideredasabottleneckinthe process.Wholepopulationgenotyping(WPG),selectivegenotyping(SG),andbulksegregantanalysis (BSA)approacheswereemployedfortheidentificationofmajorgrain-yieldQTLsunderdroughtinricein thepastfewyears.TheefficiencyofdifferentQTLmappingapproachesinidentifyingmajor-effect grain-yieldQTLsunderdroughtinricewascomparedusingphenotypicandgenotypicdataoftworecombinant inbredlinepopulations,Basmati334/SwarnaandN22/MTU1010.Allthreegenotypingapproacheswere efficientinidentifyingconsistent-effectQTLswithanadditiveeffectof10%ormore.Comparative anal-ysisrevealedthatSGandBSArequired63.5%and92.1%fewerdatapoints,respectively,thanWPGin theN22/MTU1010F3:4mappingpopulation.TheBSAapproachsuccessfullydetectedconsistent-effect droughtgrain-yieldQTLsqDTY1.1andqDTY8.1detectedbyWPGandSG.UnlikeSG,BSAdidnotleadtoan
upwardestimationoftheadditiveeffectandphenotypicvariance.Theresultsclearlydemonstratethat BSAisthemostefficientandeffortsavinggenotypingapproachforidentifyingmajorgrainyieldQTLs underdrought.
©2012ElsevierB.V.Allrightsreserved.
1. Introduction
Advancesinmolecularmarkertechnologyhaveenabled fast-trackimprovementofcropplantsinrecentyears.Marker-based approaches,includingmarker-assistedbackcrossingandQTL pyra-miding,havebeenappliedincerealsforimprovingthetolerance ofbioticandabioticstresses(CollardandMackill,2008;Yeand Smith,2010).Droughtisanimportantabioticstresscausinghuge lossesinriceyields.Progressinbreedingricefordrought toler-ancecouldbemademoreefficientbyapplyingmarker-assisted breeding(Bernieretal.,2007).Tounveilthegeneticbasisofa com-plextraitsuchasgrainyieldunderdrought,itisaprerequisiteto
Abbreviations: BSA,bulksegregantanalysis;MAS,marker-assistedselection;
QTLs,quantitativetraitloci;SG,selectivegenotyping;WPG,wholepopulation
geno-typing.
∗Correspondingauthor.Tel.:+6325805600x2586;fax:+6325805699.
E-mailaddresses:[email protected](P.Vikram),[email protected]
(B.P.M.Swamy),[email protected](S.Dixit),[email protected]
(H.Ahmed),[email protected](M.T.S.Cruz),[email protected](A.K.Singh),
[email protected](G.Ye),[email protected](A.Kumar).
1 Presentaddress:PlantBreedingDivision,BangladeshRiceResearchInstitute,
Joydebpur,Gazipur1701,Bangladesh.
genotypeandphenotypemappingpopulationsconsistingofalarge numberofindividuals.Thecostsassociatedwithlarge-scale phe-notypingandgenotypingareabottlenecktoconductingastudyon severalpopulationsatanyparticulartimeinidentifyingQTLswith consistenteffectsacrossmultipleenvironmentsandgenetic back-grounds.Withlittlealternativeavailabletophenotypeindifferent seasons/environments,thecostsinvolvedwithgenotypingcould beeffectivelyreducedbysuccessfullyapplyingdifferent genotyp-ingapproaches.
Inamodelcerealcropsuchasrice(Oryzasativa)withagenome sizeof389Mb,itisacommonpracticetouse200–400lines (recom-binantinbredlines,backcrossinbredlines,doubledhaploids)asa mappingpopulation.Adensemapcoveringall12chromosomes withanaveragegeneticdistanceof10–15cMhasbeendeveloped toidentifythepreciseQTLs.InmostoftheQTLmapping experi-ments,thewholegenomeisscanned(Gomezetal.,2010;Lanceras et al.,2004; Xu etal., 2005)toultimately findonly a few sig-nificantmarkersshowingassociationwiththetraitunderstudy. Toreducetheextraburden andcostsassociated with genotyp-ingoflargemappingpopulations,alternativestrategieshavebeen proposed.Atrait-basedgenotypicanalysiscalled“selective geno-typing” (SG)wassuggested byLebowitzet al.(1987),in which progeniesarecategorizedintodistinctclassesbasedonthetrait
0378-4290/$–seefrontmatter©2012ElsevierB.V.Allrightsreserved.
typinginsteadofthewholepopulation(LanderandBotstein,1989). Thisapproachwasusedformappingmajor-effectdrought grain-yieldQTLqDTY12.1usingonly169(38.7%)linesfromapopulation sizeof436(Bernieretal.,2007);later,thisQTLwasreconfirmed withonly4.5%ofthelinesfromthewholepopulation(Navabietal., 2009).Anothertimeandeffortsavingapproachisbulksegregant analysis(BSA)(Michelmooreetal.,1991).InBSA,DNAofprogenies correspondingtothephenotypicextremesisextractedandpooled. Therefore,onlytwopoolsofextremelinesalongwiththeparents aregenotypedfortheidentificationofmarkerslinkedwiththetrait ofinterest.BSAwasfirstappliedtotheidentificationofmarkers linkedwithdiseaseresistance.Initially,itwasappliedtothe dis-easesinwhichresistancewasmostlygovernedbymajorgenes, usuallyqualitativeinnature(Michelmooreetal.,1991).Recently, BSAhasbeenappliedforquantitativetraitsalsosuchasQTLsfor heattoleranceinrice(Zhangetal.,2009),salttolerancein Egyp-tiancotton(El-Kadietal.,2006),anddroughttoleranceinwheat andmaize(AltinkutandGozukirmizi,2003;Quarrieetal.,1999; Kanagarajetal.,2010;Venuprasadetal.,2009;Vikrametal.,2011), aswellasQTLsforgrainyieldunderdroughtinmaize(Quarrieetal., 1999).BSAhasbeenusedfortheidentificationofQTLsassociated withhighgrainyieldunderdroughtinrice(Venuprasadetal.,2009, 2011;Vikrametal.,2011).
Wholepopulationgenotypinginvolvesmarkersfromallthe12 chromosomessothattheyrepresentwholegenomeandgenetic backgroundistakenintoaccountwhileQTLanalysis.Contrarily, BSAandSG(selectivegenotyping)approachesmaynotconsider all recombination optionsduring QTL identification due tothe unavailabilityofadditionalmarkerdataonthesamechromosome andotherchromosomes.However,theseapproaches havebeen proventobepowerfulenoughtoidentifymajorQTLsthatare wor-thyforMAS(Bernieretal.,2007;Venuprasadetal.,2009;Vikram etal.,2011).BSAandSGmightfailtodetectQTLswithsmaller effectsbecauseonlytheextremeortaillinesareusedfor analy-sis.Also,interactionsbetweendifferentlociareleastlikelytobe detectedthroughtheseapproaches.QTLanalysisthroughBSAor SGapproachesdoesnottakesintoaccountthebackgroundsothat theymighttiltupwardthemagnitudeofphenotypicvariance,LOD (logarithmofodds)score,andadditiveeffects.
Thestudywasundertakentoperformacomparativeanalysisof SGandBSAinidentifyingmajor-effectQTLsforgrainyieldunder droughtandcomparethefluctuationsinphenotypicvariance, addi-tiveeffect,LOD,andlevelofsignificancevaluesobtainedinBSA andSGcomparedwithWPG(wholepopulationgenotyping).WPG, SG,andBSAapproacheswerecomparedinapopulationderived fromatraditionalvariety(Basmati334)andapopularlowlandrice variety(Swarna).Comparativeanalysisoftheseapproachesmight bebiasedifonlyone populationistakeninto account.To vali-datetheresultsandperformacomprehensiveanalysis,phenotypic andgenotypicdataofaricepopulationappliedtoQTLmappingin earlierstudieswereused(Vikrametal.,2011).
2. Materialsandmethods
Thestudywas conductedat theInternationalRice Research Institute(IRRI), LosBa ˜nos,Laguna, Philippines.AnF3:4 Basmati 334/Swarna population was phenotyped for grain yield under droughtandgenotypedthroughWPG,SG,andBSA.Basmati334isa drought-tolerantlocallandracewhereasSwarnaisapopular low-landricecultivarinIndia(Sivaranjanietal.,2010;Verulkaretal., 2010).Thephenotypicandgenotypic dataoftheN22/MTU1010 population were also used for comparison of WPG, SG, and BSA (Vikram et al., 2011). Basmati334/Swarna population was
mentswereshownonJune17,2008whereas,DS2010experiments onDecember9,2009.
2.1. PhenotypingofBasmati334/Swarnapopulation
TheF3:4 Basmati334/SwarnaRILpopulationwasphenotyped forgrainyieldunderdroughtstressaswellasirrigated/non-stress conditions(SupplementaryTable1).Thenumbersof linesused fordroughtscreeningwere204duringWS2008and367during DS2010.The204linesusedinWS2008wereasubsetof367lines thatwerephenotypedinDS2010.Screeningforgrainyieldunder droughtinthelowlandriceecosystemwascarriedoutatIRRIusing astandardphenotypingprotocol(Kumaretal.,2008;Venuprasad etal.,2007).Dataforgrainyield(gm−2convertedtokgha−1),days to50%flowering(DTF),plantheight(PH),biomass(BIO),and har-vestindex(HI)wererecorded.
2.2. GenotypingofBasmati334/Swarnapopulation
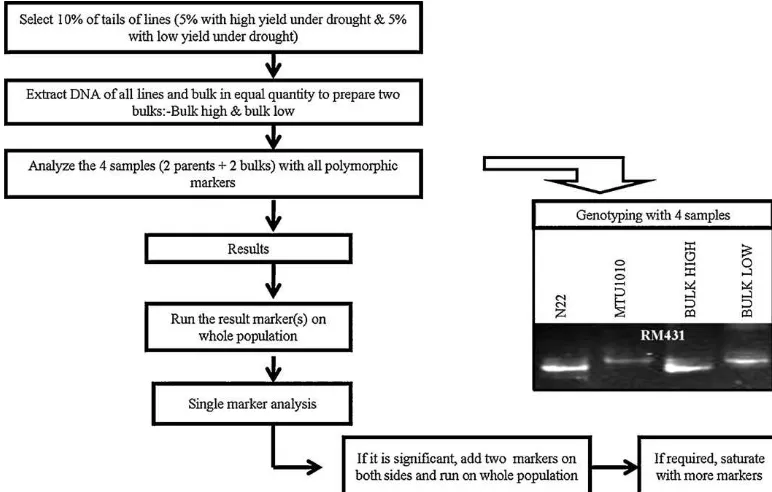
LeafsampleswerecollectedfromawholeF4plotofthe non-stressexperimentandbulked.DNAwasextractedbythemodified CTAB(cetyltri-methylammoniumbromide)methodMurrayand Thompson,1980).DNAwasquantifiedon0.8%agarosegeltoadjust theconcentrationto25ngL−1.QuantifiedDNAwassubjectedto PCRamplificationwitha15-Lreactionmixtureinvolving50ng DNA,1×PCRbuffer,100MdNTPs,250Mprimers,and1unit Taqpolymeraseenzyme.Eightpercentnon-denaturingPAGEwas usedfortheresolutionofPCRproducts(Sambrooketal.,1989).A parentalpolymorphismsurveybetweenBasmati334andSwarna wascarriedoutwith880simplesequencerepeat(SSR)markers (Temnykhetal.,2001;McCouchetal.,2002;IRGSP,2005). Geno-typingoftheBasmati334/Swarnapopulationof367lineswasdone by71polymorphicSSRmarkersspreadthroughoutthe12 chromo-somesofthericegenome.BSAwasalsodoneforQTLidentification withonly10%ofthelinesfromthepopulation(5%withhighyield and5%withlowyieldunderdroughtstress).Grainyielddatafrom thestresstrialofDS2010wereusedforselectinglinesto consti-tuteBSA.DNAofalltheselectedlineswasquantifiedandbulked inequal quantitytopreparehigh-and low-yieldbulks.DNAof thesetwobulkswasscreenedwith203polymorphicSSR mark-ersalongwithparents–Basmati334andSwarna(Fig.1).Asimilar procedureforBSAintheN22/MTU1010populationwascarriedout (Vikrametal.,2011).Polymorphicmarkersfromallthe12 chromo-someswereselectedatequaldistancesothattheyrepresentwhole genome.SGwascarriedoutwiththesamenumberofmarkersused inWPG.BothRILpulations-Basmati334/SwarnaandN22/MTU1010 presentedinthestudywereanalyzedthroughwholegenomeand BSAboth.
2.3. Statisticalanalysis
Statistical analysis was performed through SASv9.1.3 (SAS InstituteInc.,2004).TheREMLalgorithmofPROCMIXEDofSAS v9.1.3wasusedforthedeterminationofmeanvaluesofentries usingamodelin whichlinesweretreatedasafixedeffectand replicationsandblockswithinreplicationsasrandom.Inbredline mean-basedbroad-senseheritability(H)wascomputedas:
H= Vg
Vg+Ve/r
Fig.1.BulkedsegregantanalysisstrategyusedforidentifyingQTLsforgrainyieldunderdroughtinrice.
2.4. LinkagemapconstructionandQTLanalysis
AgeneticlinkagemapoftheBasmati334/Swarnapopulation wasconstructedthroughMapdisto softwareusing theKosambi mapfunctionandanLODscoreof3.0asthethreshold(Kosambi, 1944; Lorieux, 2007). All the non-linked markers were placed ontheirrespectivechromosomesbasedonthephysicalposition (IRGSP,2005).Asimilarprocedurewasfollowedbyearlierworkers (Amrawathietal.,2008).QTLnetworksoftwarev2.1wasusedfor mixedmodel-basedcompositeintervalmapping(Yangetal.,2008). Inthisprocedure,candidatemarkerintervalsweredeterminedand selectedintervalswereusedasaco-factorinaone-dimensional genomescan.Thesignificancelevelforthedeterminationof candi-dateintervals,putativeQTLdetection,andQTLeffectswassetata probabilitylevelof0.05.Thethresholdwasdeterminedusing1000 permutations.Forthegenomescan,awindowsizeof10cMand walkspeedof1cMwerefollowed.QTLanalysisresultswere con-firmedwithQGenesoftwaretovalidatethemagnitudesoftheQTLs identifiedthroughthreedifferentstrategies.Phenotypicvariance andLODoftheQTLswereestimatedthroughcompositeinterval mappingusingQGenesoftware(Nelson,1997).ALODvalueof2.5 wasconsideredasthresholdtodeterminesignificanceofQTLs. Sim-ilarthresholdvaluewasusedbecauseallQTLsusedinthisanalysis werefoundsignificantinanalysisthroughQTLnetworksoftware.
2.5. AnalysisforSGandBSA
QTLanalysiswithalessernumberoflinesinbothpopulations wascarried out to workout the efficiency ofSG and BSA. For analysisthroughSG,36.5%ofthelines(10%highestyielding,10% lowestyielding,and16.5%randomlines)wereused(Bernieretal., 2007).ThelinkagemapconstructedusingWPGwasalsousedto locatetheQTLsidentifiedbySGanalysis.QTLanalysisforBSAwas carriedoutwiththreemarkers–RM210,RM223,andRM339– intheBasmati334/Swarnapopulationandwitheightmarkers– RM315,RM431,RM212,RM3825,RM11943,RM12023,RM12091, andRM12146–intheN22/MTU1010population.
ToestimatethesizeofpopulationforQTLanalysisfor grain yieldunderdrought,QTLanalysiswith90%,80%,70%,60%,and
50%populationsizewasperformedinbothpopulations.Forthis purpose,awholepopulationwassortedbasedongrainyieldunder drought.Equalnumbersofindividualswereomittedfrom high-yieldinglines,low-yieldinglines,andlineswithmediumyieldfrom thestresstrialstomakesurethatthelinesselectedwererandom anddistributionremainednormal.
3. Results
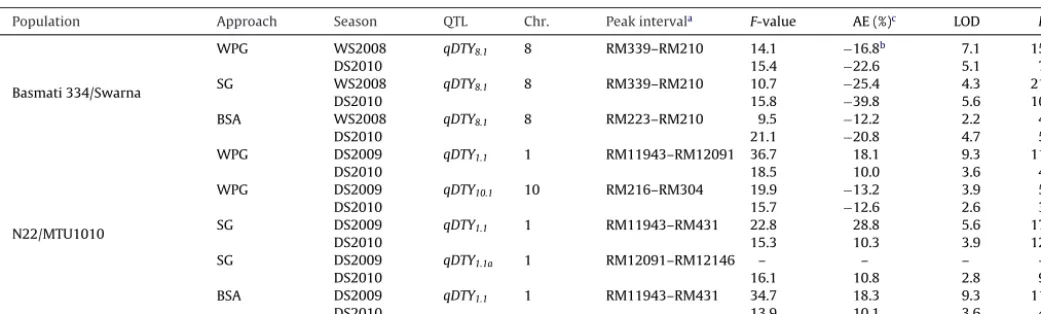
TheresultsofQTLidentificationforgrainyield,daysto50% flow-ering,plantheight,andharvestindexunderdroughtbyWPGin theBasmati334/SwarnaandN22/MTU1010populationsare pre-sentedinSupplementaryTables2and3.QTLsforgrainyieldunder droughtidentifiedthroughWPG,SG,andBSAinbothpopulations arepresentedinTable1.
3.1. QTLsidentifiedforgrainyieldunderdroughtwithWPG
Aconsistent-effectQTL(qDTY8.1)forgrainyieldunderdrought locatedbetweenthemarkerintervalsRM339andRM210on chro-mosome8wasdetectedintheBasmati334/Swarnapopulation. ThisQTLexplained phenotypicvariance(R2)of15.6% and7.1%, withanadditiveeffect(additiveeffectaspercentoftrialmean) of16.8%and22.6%,duringWS2008(wetseason2008)andDS2010 (dryseason2010),respectively(Table1).TwoQTLs,qDTY1.1 and qDTY10.1,werefoundsignificantforgrainyieldunderdroughtin theN22/MTU1010population.qDTY1.1explainedphenotypic vari-anceof11.9%and4.5%,withanadditiveeffectof18.1%and10.0% duringDS2009andDS2010,respectively.qDTY10.1explained phe-notypicvarianceof5.2%and3.2%andanadditiveeffectof13.2% and12.6%duringDS2009andDS2010,respectively(Table1).
3.2. QTLsidentifiedforgrainyieldunderdroughtwithSG
[image:3.612.111.497.56.302.2]Population Approach Season QTL Chr. Peakinterval F-value AE(%) LOD R
Basmati334/Swarna
WPG WS2008 qDTY8.1 8 RM339–RM210 14.1 −16.8b 7.1 15.6
DS2010 15.4 −22.6 5.1 7.1
SG WS2008 qDTY8.1 8 RM339–RM210 10.7 −25.4 4.3 21.9
DS2010 15.8 −39.8 5.6 16.5
BSA WS2008 qDTY8.1 8 RM223–RM210 9.5 −12.2 2.2 4.9
DS2010 21.1 −20.8 4.7 5.8
N22/MTU1010
WPG DS2009 qDTY1.1 1 RM11943–RM12091 36.7 18.1 9.3 11.9
DS2010 18.5 10.0 3.6 4.5
WPG DS2009 qDTY10.1 10 RM216–RM304 19.9 −13.2 3.9 5.2
DS2010 15.7 −12.6 2.6 3.2
SG DS2009 qDTY1.1 1 RM11943–RM431 22.8 28.8 5.6 17.7
DS2010 15.3 10.3 3.9 12.9
SG DS2009 qDTY1.1a 1 RM12091–RM12146 – – – –
DS2010 16.1 10.8 2.8 9.4
BSA DS2009 qDTY1.1 1 RM11943–RM431 34.7 18.3 9.3 11.9
DS2010 13.9 10.1 3.6 4.5
aPeakinterval,peakoftheQTLintervalwasbetweenthesemarkerintervals.R2,phenotypicvarianceexplainedbytheQTL.
b NegativesignindicatesthatallelecontributionisfromsusceptibleparentSwarna.
c AE%(additiveeffect%),additiveeffectasthepercentageoftrialmean[additiveeffect/trialmean×100].
during DS2009 and DS2010, respectively. Additive effects con-tributed by qDTY1.1 were 28.8% and 10.3% during DS2009 and DS2010,respectively.
3.3. QTLsidentifiedforgrainyieldunderdroughtwithBSA
qDTY8.1 in Basmati334/Swarnaand qDTY1.1 in N22/MTU1010
weredetectedbyBSA.RM210wasidentifiedtobeassociatedwith grainyieldunderdroughtintheBasmati334/Swarnapopulation viaBSA.Threemarkerswererunonthewholepopulationtodetect
qDTY8.1.It explained phenotypicvariance of 4.9% and 5.8% and
additiveeffectsof12.2%and20.8%duringWS2008andDS2010, respectively(Table1).InthecaseofqDTY1.1,RM315andRM431 weredetectedaslinkedmarkersforgrainyieldunderdroughtinthe N22/MTU1010population.Eightpolymorphicmarkerswererun onthewholepopulationtodetermineQTLboundaries(Fig.1).The phenotypicvarianceexplainedbyqDTY1.1inDS2009andDS2010 was11.9%and4.5%,respectively.AdditiveeffectsinDS2009and DS2010were18.3%and10.1%,respectively(Table1).
3.4. MagnitudeandefficiencyofQTLsindifferentgenotyping approaches
All three approaches successfully detected two consistent-effect QTLs, qDTY8.1 and qDTY1.1, in Basmati334/Swarna and N22/MTU1010populations,respectively(Table1).qDTY10.1,which wasfoundintheN22/MTU1010population,wasdetectedonlyin WPG.The F-valueofqDTY8.1 waslesserin WS2008and greater inDS2010inSGincomparisonwithWPG.Theadditiveeffectof qDTY8.1 washighestinSG,followedbyWPGandBSAinWS2008 andDS2010.TheLODvaluewashighestinWPGandSGinWS2008 andDS2010,respectively.Thephenotypicvariancewashighestin SG,followedbyWPGandBSAinWS2008andDS2010,respectively (Table1).ComparativeanalysisoftheparametersofqDTY1.1reveals thattheF-valueislowerinSGthaninWPG(Table1).Theadditive effectinSGwashighest,followedbyBSAandWPGinDS2009as wellasDS2010(Table1).Itisnotablethattheadditiveeffectwas leastinWPGinbothyears.TheLODvalueofqDTY1.1wasthesame inWPGandBSAinDS2009andDS2010.ButLODestimatedbySG waslowerduringDS2009and higherinDS2010thanLOD esti-matedwithWPGandBSA.ThephenotypicvarianceofqDTY1.1was thesameinWPGandBSA,whereasitwasgreaterinSGinDS2009 andDS2010(Table1).
3.5. QTLeffectanalysiswithdifferentpopulationsizes
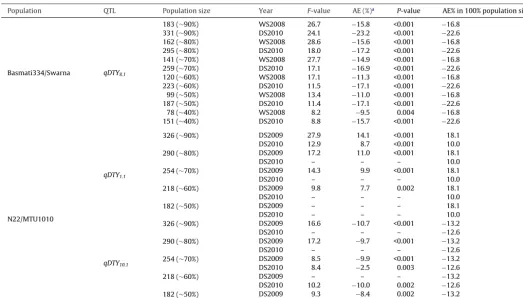
QTLanalysisforgrainyieldunderdroughtwascarriedoutwith differentpopulationsizes.qDTY1.1identifiedwithphenotypicdata (underdroughtstress)ofDS2009withanoriginalpopulationsize of362wasalsosuccessfullydetectedinalesserpopulationsizeof 218lines.ThesameQTLwasdetectedwithphenotypicdata(under droughtstress)ofDS2010intheoriginalpopulationbutfailedtobe detectedinareducedpopulationsize(Table2).Asimilartrendwas observedforqDTY8.1intheBasmati334/Swarnapopulationduring DS2008.Additiveeffectdecreasedwithadecreaseinpopulation size.ThetrendinDS2010forthisQTLwassimilarforadecrease inpopulationsizeupto30%,but thereafterit becameconstant uptoa50%decreaseinpopulationsizeandthendecreasedagain (Table2).TheadditiveeffectofqDTY10.1didnotshowanypattern withrespecttopopulationsize.
4. Discussion
[image:4.612.33.554.73.230.2]Table2
ComparativeanalysisofQTLeffectsindifferentpopulationsizeswithadecreaseinpopulationsize.
Population QTL Populationsize Year F-value AE(%)a P-value AE%in100%populationsize
Basmati334/Swarna qDTY8.1
183(∼90%) WS2008 26.7 −15.8 <0.001 −16.8
331(∼90%) DS2010 24.1 −23.2 <0.001 −22.6
162(∼80%) WS2008 28.6 −15.6 <0.001 −16.8
295(∼80%) DS2010 18.0 −17.2 <0.001 −22.6
141(∼70%) WS2008 27.7 −14.9 <0.001 −16.8
259(∼70%) DS2010 17.1 −16.9 <0.001 −22.6
120(∼60%) WS2008 17.1 −11.3 <0.001 −16.8
223(∼60%) DS2010 11.5 −17.1 <0.001 −22.6
99(∼50%) WS2008 13.4 −11.0 <0.001 −16.8
187(∼50%) DS2010 11.4 −17.1 <0.001 −22.6
78(∼40%) WS2008 8.2 −9.5 0.004 −16.8
151(∼40%) DS2010 8.8 −15.7 <0.001 −22.6
N22/MTU1010
qDTY1.1
326(∼90%) DS2009 27.9 14.1 <0.001 18.1
DS2010 12.9 8.7 <0.001 10.0
290(∼80%) DS2009 17.2 11.0 <0.001 18.1
DS2010 – – – 10.0
254(∼70%) DS2009 14.3 9.9 <0.001 18.1
DS2010 – – – 10.0
218(∼60%) DS2009 9.8 7.7 0.002 18.1
DS2010 – – – 10.0
182(∼50%) DS2009 – – – 18.1
DS2010 – – – 10.0
qDTY10.1
326(∼90%) DS2009 16.6 −10.7 <0.001 −13.2
DS2010 – – – −12.6
290(∼80%) DS2009 17.2 −9.7 <0.001 −13.2
DS2010 – – – −12.6
254(∼70%) DS2009 8.5 −9.9 <0.001 −13.2
DS2010 8.4 −2.5 0.003 −12.6
218(∼60%) DS2009 – – – −13.2
DS2010 10.2 −10.0 0.002 −12.6
182(∼50%) DS2009 9.3 −8.4 0.002 −13.2
DS2010 – – – −12.6
aAE%(additiveeffect%),additiveeffectasthepercentageoftrialmeancalculatedas“Additiveeffect/trialmean×100′′
.
genotypingapproaches,WPG,SG,andBSA,werecomparedfortheir efficiencyinidentifyingconsistent-effectQTLsforgrainyieldunder drought.
4.1. QTLidentificationusingWPG,SG,andBSA
qDTY8.1wasdetectedintheBasmati334/Swarnapopulationby WPG.The increasedyield atthe qDTY8.1 locus wascontributed fromthesusceptibleparentSwarna.Contributionsofthepositive QTLallelefromadrought-susceptibleparentwerealsoreported (Bernieretal.,2007;Kumaretal.,2007).ThepositiveQTLallelefor major-effectdroughtgrainyieldQTLqDTY12.1wascontributedby susceptibleparentWayRarem(Bernieretal.,2007).Asusceptible parent(CT9993)wasfoundtoincreasethegrainyieldoftolerant parentIR62266(Kumaretal.,2007).qDTY1.1wasalsodetected suc-cessfullythroughWPGintheN22/MTU1010population(Table1). QTLmappinginlargepopulationsthroughWPGinvolveshighcost, muchtime,andmuchlabor(Kanagarajetal.,2010).SGhasbeen reportedasanalternativestrategyintheidentificationofQTLswith majoreffects(DarvasiandSoller,1992;LanderandBotstein,1989; Bernieretal.,2007).ThesimulationofQTLmappingwithdifferent populationsizesdemonstratedthatQTLsexplaining15%ormoreof thephenotypicvarianceforpopulationsizecouldbedetectedusing 30outof500lineswithapowerof0.8(Navabietal.,2009).Inour study,theconsistent-effectQTLsqDTY1.1 andqDTY8.1 explaining upto11.9%and15.6%ofthephenotypicvarianceweresuccessfully detectedthroughSGof36.5%ofthelines(Table1).Shashidharetal. (2005)firstappliedBSAfortheidentificationofQTLsforgrainyield underdroughtinrice.Large-effectQTLqDTY3.1forgrainyieldunder droughtwasalsodetectedbyBSA(Venuprasadetal.,2009).Inour study,qDTY8.1andqDTY1.1weresuccessfullydetectedthroughBSA (Table1;Fig.1).BSAhasbeenreviewedasasuitablestrategyfor highlyheritabletraitsthatfollowMendelianinheritance(Tuberosa
etal.,2002).However,ithasalsobeenappliedintheidentification ofQTLsfortraitshavinglowheritability(Grattapagliaetal.,1996). Evenfortraitssuchasgrainyieldunderdroughtwithmoderateto highheritability,BSAcanbeusedtoidentifythemajor-effectQTLs (Venuprasadetal.,2009).
4.2. ComparativeanalysisofWPG,SG,andBSA
ComparativeanalysisoftheparametersofqDTY8.1andqDTY1.1 clearlyindicatesthattheestimatedadditiveeffectwashigherinSG thaninWPG(Table1).PhenotypicvarianceofqDTY8.1andqDTY1.1 wasalsohighestinSGamongallthreeapproaches(Table1). Over-estimationofthephenotypicvarianceintheSGapproachwasalso reported(Valesetal.,2005).qDTY8.1andqDTY1.1wereidentifiedat higherF-valueswithWPGthanwithSGexceptinDS2010inthe Basmati334/Swarnapopulation(Table1).Suchoverestimationof theadditiveeffectinSGisduetotheuseofaselectednumberof genotypes(Collardetal.,2005).Forconsistent-effectQTLsforgrain yieldunderdrought,WPGwascomparablewiththeBSAapproach. PhenotypicvarianceofqDTY8.1waslessinBSAthaninWPG.Onthe otherhand,thisvaluewasthesameforqDTY1.1(Table1).Forboth qDTY8.1andqDTY1.1,theadditiveeffectunderBSAwassimilarto thatunderWPGbutlowerthanthatunderSG(Table1).
[image:5.612.43.566.73.371.2]underdrought,covariateanalysiswascarriedouttopredictthe meangrainyieldafterkeepingdaysto50%floweringasacovariate. Singlemarkeranalysiswascarriedoutwiththepredictedmean grainyieldunderdroughtanditwasfoundtobenon-significant (datanotpresented).ThisanalysisconfirmsthatqDTY10.1is not atrueQTLforgrainyieldunderdroughtandtheadditiveeffect contributedbythisQTLisduetoearlinessratherthantoleranceof drought.
PreciseapplicationofSGandBSAdependsontheproper clas-sificationofindividuals intodistinctgroups thatroughlyreflect thegenotypesoftargetQTLs(QTLstobeidentified).Thiswillbe moreeffectiveifphenotypeisagoodindicatoroftheQTL geno-type.Genetically,theeffectofthetargetQTLmustbesolargethat thecollectiveeffectsofotherQTLsandtheirinteractionswiththe targetQTLdonotresultinsignificantdistortionofthe relation-shipbetweentheQTLgenotypeandthephenotypicperformance. QTLstudiessuggestthatamajorQTLismorelikelytobepresent inthepopulationsderivedfromcontrastingparents,implyingthat SGandBSAwillbemoresuccessfulwhenappliedtosuch popula-tions(Bernieretal.,2007;Venuprasadetal.,2009;Semagnetal., 2010).
4.3. Effectofpopulationsizeintheidentificationof consistent-effectdroughtQTLs
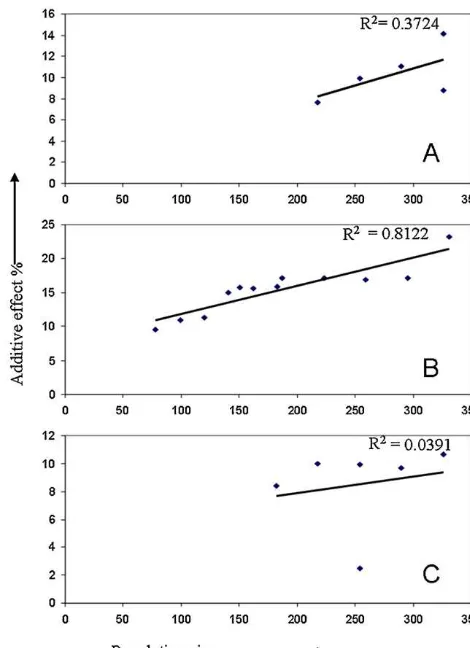
Thesizeofthemappingpopulationtobeusedforthe detec-tionofdroughtyieldQTLsisanimportantfactorforconcluding whetherSGandBSAareadvantageousoverWPG.Increasingthe initialpopulationsizeandreducingtheselectionproportionwill increasethedifferencebetweenthetwoextremegroupsandasa resultimprovedetectionpower.Themostextremegenotypesare thosethatcontaindesirableQTLallelesandoccurinlow frequen-ciesinthemappingpopulation.Populationsizesusedformapping droughtyieldQTLs(qDTY1.1,qDTY8.1,andqDTY10.1)wereplotted againsttheiradditiveeffects (Fig.2).qDTY1.1,which showedan 18.1%additiveeffectwithpopulationsizeof362,wasdetectedwith aslowasa218populationsize.ThisQTLshoweda10%additive effectwithpopulationsizeof362withphenotypicdataofDS2010 and could not bedetected with a populationsize of less than 326(Table2).qDTY8.1 showed15.8%and23.2%additiveeffectin WS2008andDS2010,respectively,andwassignificantlydetected using40%of thepopulationsizesin respectiveyears(Table2). Theseresultsrevealtheimportanceofalargepopulationsizein mappingdroughtyieldQTLs.Severalstudiesconductedinpastfor droughtrelatedtraitswithpopulationsizeslessthan250(Babu etal.,2003;Lancerasetal.,2004)couldnotidentifyadroughtgrain yieldQTLwiththeeffect,largeenoughtodeployinMAS.Onthe otherhand,mostofthestudieswhichidentifiedlargeand consis-tenteffectQTLsinvolvedpopulationswithmorethan300inbred lines(Bernieretal.,2007;Venuprasadetal.,2009;Vikrametal., 2011).Basedontheresultsofpresentstudyandpreviousreports itcouldbeconcludedthatapopulationsizeof300–350 recombi-nantinbredlinesisgoodenoughtomapmajorQTLsforgrainyield underdrought.
4.4. BSA:aneffectiveapproachforgrainyieldunderdrought
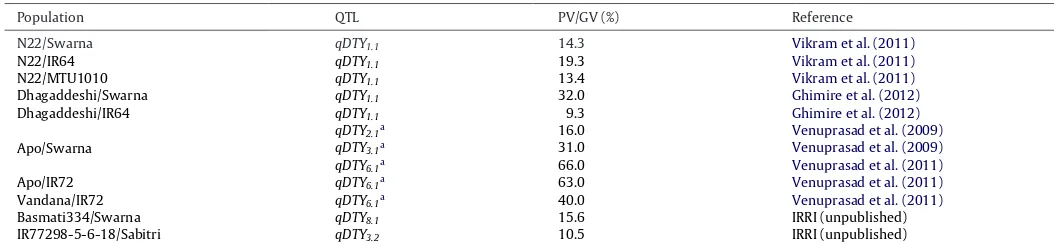
BSAisapowerful,effort-saving,andcost-effectiveapproachfor detectingconsistent-effectQTLs,evenfortraitsshowingcontinual distributionsuchasgrainyieldunderdrought.QTLmappingusing BSAledtotheidentificationofseveralconsistent-effectQTLsfor grainyieldunderdroughtatIRRI(Table3).Thereareafewsamples tobegenotyped,whichinturnreducesthenumberofdatapoints (SupplementaryTable4).LinkedmarkersidentifiedviaBSAcanbe
Fig.2. Graphshowingvariationinadditiveeffectsagainstpopulationsizes.Y-axis
correspondstotheadditiveeffects(AE%,additiveeffectsaspercentageoftrialmean)
andX-axispopulationsize.(A)qDTY1.1;(B)qDTY8.1and(C)qDTY10.1.
confirmedbygenotypingoftaillinesthatarealsousedformaking DNApools(Kanagarajetal.,2010).TheBSAapproachcompared withWPGprovidesopportunitiestogenotypemultiplepopulations asrevealedbythenumberofdatapointsgeneratedinBSAandWPG inourstudywiththeN22/MTU1010population(Supplementary Table4).Forlarge-effectQTLs,itmightbemoreimportanttotest theireffectsinmultiplebackgrounds.SeveralQTLsforgrainyield underdroughtwereidentifiedinthreeN22-derivedpopulations simultaneouslybecauseoftheeaseofapplicationandeffectiveness (Vikrametal.,2011).
TheprecisionandQTLdetectionpowerofBSAcanbeincreased byrepeatingitwithbulkshavingalargenumberofsamplesinthe secondstage.Alternatively,fourDNAbulkscouldbeusedinsteadof justtwoforeachphenotypicextremeconsistingofthefirstand sec-ond5%mosttolerantandsusceptiblelinestoreducefalse-positive bands(Xuetal.,2000).InBSA,onlyafewmarkerswereusedforQTL analysissothattherewaslittleoptiontocontrolthebackground effectsofothersegregatingQTLsusingacofactor.Dependingupon themagnitudeanddirectionoftheeffectofbackgroundQTLs,the effectofthetargetQTLmightbeover-orunder-estimated com-pared toconventional WPG. Therefore, BSA hasa limitation in determiningtheepistaticinteractionsfortheQTLs.Itisadvisable toincludeafewmarkersperchromosomesothatthebackground effectcanbepartiallyremoved.
[image:6.612.311.546.53.377.2]Table3
MajorQTLsforgrainyieldunderdroughtinriceidentifiedandvalidatedindifferentpopulationsatIRRIviaBSA.
Population QTL PV/GV(%) Reference
N22/Swarna qDTY1.1 14.3 Vikrametal.(2011)
N22/IR64 qDTY1.1 19.3 Vikrametal.(2011)
N22/MTU1010 qDTY1.1 13.4 Vikrametal.(2011)
Dhagaddeshi/Swarna qDTY1.1 32.0 Ghimireetal.(2012)
Dhagaddeshi/IR64 qDTY1.1 9.3 Ghimireetal.(2012)
Apo/Swarna
qDTY2.1a 16.0 Venuprasadetal.(2009)
qDTY3.1a 31.0 Venuprasadetal.(2009)
qDTY6.1a 66.0 Venuprasadetal.(2011)
Apo/IR72 qDTY6.1a 63.0 Venuprasadetal.(2011)
Vandana/IR72 qDTY6.1a 40.0 Venuprasadetal.(2011)
Basmati334/Swarna qDTY8.1 15.6 IRRI(unpublished)
IR77298-5-6-18/Sabitri qDTY3.2 10.5 IRRI(unpublished)
PV,phenotypicvariance;GV,genotypicvariance.
aQTLsexplainedonthebasisofgenotypicvariances.
ofinterest.Thisincreasestheprobabilityof identifyingmarkers thatarequiteclosertothetargetQTLwithminimumunwanted linkages. SeveralSNP genotypingplatforms have recentlybeen developed in rice (Affymetrix, Illumina, perlegen) and can be successfullyusedforQTLidentificationstudies.InadditiontoQTL mapping,BSAhasbeenappliedtotranscriptomicsinrecentyears (Panditetal.,2010;Kadametal.,2012).
5. Conclusions
Identifyinggenomicregionsassociatedwithdroughtrequires phenotyping and genotyping of large mapping populations. Resourcesincludingtime,effortandcostinvolvedingenotyping thelargemappingpopulationsisabottleneckintheidentification ofdroughtgrainyieldQTLs.Thethreemappingstrategies,WPG,SG, andBSA,werecomparedwithrespecttotheQTLeffects.SG over-estimatedQTLeffectscomparedwithWPG.BSAwasfoundtobean effectiveapproachintheidentificationofconsistent-effectdrought grainyieldQTLs.AQTLforgrainyieldunderdroughtwasidentified inaBasmati334/SwarnapopulationthroughBSAonchromosome 8(qDTY8.1).BSAcanbeappliedinmultiplericepopulations simul-taneouslytoidentifyconsistent-effectdrought grainyield QTLs worthyforMAS.
Acknowledgments
TheauthorsthanktheGenerationChallengeProgramfor provid-ingfinancialsupportforthisstudy.Theauthorsalsoacknowledge the technical support received from Marilyn Del Valle, Lenie Quiatchon,JocelynGuevarra,andPaulMaturaninthecompletion ofthisstudy.Experimentsconductedinourstudycomplywiththe currentlawsofthePhilippines.
AppendixA. Supplementarydata
Supplementarydataassociatedwiththisarticlecanbefound,in theonlineversion,athttp://dx.doi.org/10.1016/j.fcr.2012.05.012.
References
Altinkut,A.,Gozukirmizi,N.,2003.Searchformicrosatellitesassociatedwithwater
stresstoleranceinwheatthroughbulkedsegregantanalysis.Mol.Biotechnol.
23,97–106.
Amrawathi,Y.,Singh,R.,Singh,A.K.,Singh,V.P.,Mohapatra,T.,Sharma,T.R.,Singh,
N.K.,2008.Mappingofquantitativetraitlociforbasmatiqualitytraitsinrice
(OryzasativaL.).Mol.Breeding21,49–65.
Babu, R.C.,Nguyen,B.D., Chamarerk,V., Shanmugasundaram, P., Chezhian,P.,
Jeyaprakash,P.,Ganesh,S.K.,Palchamy,A.,Sadasivam,S.,Sarkarung,S.,Wade,
L.J.,Nguyen,H.T.,2003.Geneticanalysisofdroughtresistanceinriceby
molec-ularmarkers:associationbetweensecondarytraitsandfieldperformance.Crop
Sci.43,1457–1469.
Becker, A., Chao, D.Y., Zhang, X., Salt, D.E., Baxter, I., 2011. Bulk
segregant analysis using SNP microarrays. PLoS One 6, e15993,
http://dx.doi.org/10.1371/journal.pone.0015993.
Bernier,J.,Kumar,A.,Venuprasad,R.,Spaner,D.,Atlin,G.N.,2007.Alarge-effectQTL
forgrainyieldunderreproductive-stagedroughtstressinuplandrice.CropSci.
47,507–516.
Collard,B.C.Y.,Jahufer,M.Z.Z.,Brouwer,J.B.,Pang,E.C.K.,2005.Anintroductionto
markers,quantitativetraitloci(QTL)mappingandmarkerassistedselectionfor
cropimprovement:thebasicconcepts.Euphytica142,169–196.
Collard,B.C.Y.,Mackill,D.J.,2008.Marker-assistedselection:anapproachfor
pre-cisionplantbreedinginthetwentyfirstcentury.Philos.Trans.Roy.Soc.B363,
557–572.
Darvasi,A.,Soller,M.,1992.Selectivegenotypingfordeterminationoflinkage
betweenamarkerlocusandaquantitativetraitlocus.Theor.Appl.Genet.85,
353–359.
El-Kadi,D.A.,Afiah,S.A.,Aly,M.A.,Badran,A.E.,2006.Bulkedsegregantanalysis
todevelopmolecularmarkersforsalttoleranceinEgyptiancotton.Arab.J.
Biotechnol.9,129–142.
Ghimire,K.H.,Quiatchon,L.A.,Vikram,P.,Swamy,B.P.M.,Dixit,S.,Ahmed,H.U.,
Her-nandez,J.E.,Borromeo,T.H.,Kumar,A.,2012.Identificationandmappingofa
QTL(qDTY1.1)withaconsistenteffectongrainyieldunderdrought.FeildCrops
Res.131,88–96.
Gomez,S.M.,Boopathi, N.M.,Kumar,S.S.,Ramasubramanian,T.,Chengsong,Z.,
Jeyaprakash,P.,Senthil,A.,Babu,R.C.,2010.Molecularmappingandlocation
ofQTLsfordrought-resistancetraitsinindicarice(OryzasativaL.)linesadapted
totargetenvironments.ActaPhysiol.Plant32,355–364.
Grattapaglia,D.,Bertolucci,F.L.G.,Sederoff,R.,1996.Geneticmappingofquantitative
traitlocicontrollinggrowthandwoodqualitytraitsinEucalyptusgrandisusing
amaterialhalf-sibfamilyandRAPDmarkers.Genetics,1205–1214.
IRGSP: International Rice Genome SequencingProject, 2005. Themap-based
sequenceofthericegenome.Nature436,793–800.
Kadam, S., Singh, K., Shukla, S.,Goel, S., Vikram, P., Pawar, V., Gaikwad,K.,
Chopra, R.K., Singh, N.K., 2012. Genomic associations for drought
toler-anceonthe shortarm ofwheatchromosome4B.Func. Integr.Genomic.,
http://dx.doi.org/10.1007/s10142-012-0276-1.
Kanagaraj,P.,Prince,K.S.J.,Sheeba,J.A.,Biji,K.R.,Paul,S.B.,Senthil,A.,Babu,R.C.,
2010.Microsatellitemarkerslinkedtodroughtresistanceinrice(Oryzasativa
L.).Curr.Sci.98,836–839.
Kosambi,D.D.,1944.Theestimationofamapdistancefromrecombinationvalues.
Ann.Eugenics12,172–175.
Kumar,R.,Venuprasad,R.,Atlin,G.N.,2007.Geneticanalysisofrainfedlowlandrice
droughttoleranceundernaturally-occurringstressineasternIndia:heritability
andQTLeffects.FieldCropsRes.103,42–52.
Kumar,A.,Bernier,J.,Verulkar,S.,Lafitte,H.R.,Atlin,G.N.,2008.Breedingfordrought
tolerance:directselectionforyield,responsetoselectionanduseof
drought-tolerantdonorsinuplandandlowland-adaptedpopulations.FieldCropsRes.
107,221–231.
Lanceras,J.C.,Pantuwan,G.,Jongdee,B.,Toojinda,T.,2004.Quantitativetraitloci
associatedwithdroughttoleranceatreproductivestageinrice.PlantPhysiol.
135,384–399.
Lander,E.S.,Botstein,D.,1989.MappingMendelianfactorsunderlyingquantitative
traitsusingRFLPlinkagemaps.Genetics121,185–199.
Lebowitz,R.J.,Soller,M.,Beckmann,J.S.,1987.Trait-basedanalysesforthedetection
oflinkagebetweenmarkerlociandquantitativetraitlociincrossesbetween
inbredlines.Theor.Appl.Genet.73,556–562.
Lorieux,M.,2007.MapDisto,afreeuser-friendlyprogramforcomputinggenetic
maps.In:ComputerDemonstrationGivenatthePlantandAnimalGenomeXV
Conference,Jan13–17,SanDiego,CA,p.958,http://mapdisto.free.fr.
McCouch,S.R.,Teytelman,L.,Xu,Y.,Lobos,K.B.,Clare,K.,Walton,M.,Fu,B.,
Maghi-rang,R.,Li,Z.,Xing,Y.,Zhang,Q.,Kono,I.,Yano,M.,Fjellstrom,R.,DeClerck,
G.,Schneider,D.,Cartinhour,S.,Ware,D.,Stein,L.,2002.Developmentand
mappingof2240newSSRmarkersfor rice(Oryzasativa L.).DNARes.9,
[image:7.612.41.568.74.196.2]Acad.Sci.USA88,9828–9832.
Murray,M.G.,Thompson,W.F.,1980.Rapidisolationofhighmolecularweightplant
DNA.NucleicAcidsRes.8,4321–4326.
Navabi,A.,Mather,D.E.,Bernier,J.,Spaner,D.M.,Atlin,G.N.,2009.QTLdetection
withbidirectionalandunidirectionalselectivegenotyping:marker-basedand
trait-basedanalyses.Theor.Appl.Genet.118,347–358.
Nelson,J.C.,1997.QGENE:softwareformarker-basedgenomicanalysisand
breed-ing.Mol.Breeding3,239–245.
Pandit,A.,Rai,V.,Bal,S.,Sinha,S.,Kumar,V.,Chauhan,M.,Gautam,R.K.,Singh,R.,
Sharma,P.C.,Singh,A.K.,Gaikwad,K.,Sharma,T.R.,Mohapatra,T.,Singh,N.K.,
2010.CombiningQTLmappingandtranscriptomeprofilingofbulkedRILsfor
identificationoffunctionalpolymorphismforsalttolerancegenesinrice(Oryza
sativaL.).Mol.Genet.Genomics284,121–136.
Quarrie,S.,Lazic-jancic,V.,Kovacevic,D.,Steed,A.,Pekic,S.,1999.Bulksegregant
analysiswithmolecularmarkersanditsuseforimprovingdroughtresistance
inmaize.J.Exp.Bot.50,1299–1306.
Sambrook,J.,Fritsch,E.F.,Maniatis,T.,1989.MolecularCloning:aLaboratoryManual,
2nded.ColdSpringHarbor,NewYork.
SASInstituteInc.,2004.SASOnlineDoc9.1.3.SASInstituteInc.,Cary,NC.
Semagn,K.,Bjørnstad,A.,Xu,Y.,2010.Thegeneticdissectionofquantitativetraits
incrops.Electron.J.Biotechnol.13,1–45.
Shashidhar,H.E.,Vinod,M.S.,Sudhir,N.,Sharma,G.V.,Krishnamurthy,K.,2005.
Markerslinkedtograinyieldusingbulkedsegregantanalysisapproachinrice
(OryzasativaL.).RiceGenet.Newsl.22,69–71.
Sivaranjani,A.K.P.,Pandey,M.K.,Sudharshan,I.,Kumar,G.R.,SheshuMadhav,M.,
Sundaram,R.M.,Varaprasad,G.S.,Shobharani,N.,2010.Assessmentofgenetic
diversityamongbasmatiandnon-basmatiaromaticricesofIndiausingSSR
markers.Curr.Sci.99,221–226.
Swamy,B.P.M.,Vikram,P.,Dixit,S.,Ahmed,H.U.,Kumar,A.,2011.Meta-analysisof
grainyieldQTLidentifiedduringagriculturaldroughtingrassesshowed
con-sensus.BMCGenomics12,319.
Swamy,B.P.M.,Kumar,A.,2011.Sustainablericeyieldinwatershortdroughtprone
environments:conventionalandmolecularapproaches.In:TeangShui,Lee(Ed.),
IrrigationSystemsandPracticesinChallengingEnvironments.InTech,Croatia,
pp.149–168.
Temnykh,S.,Declerck,G.,Lukashova,A.,Lipovich,L.,Cartinhour,S.,McCouch,S.,
2001.Computationalandexperimentalanalysisofmicrosatellitesinrice(Oryza
sativaL.):frequency,lengthvariation,transposonassociations,andgenetic
markerpotential.GenomeRes.11,1441–1452.
Tuberosa, R., Salvi, S., Sanguineti, M.C., Landi, P., Maccaferri, M., Conti, S.,
2002.MappingQTLsregulatingmorpho-physiologicaltraitsandyield:case
C.C.,Richardson,K.L.,Sandoval-Islas,J.S.,Utz,H.F.,Hayes,P.M.,2005.Effectof
populationsizeonestimationofQTL:atestusingresistancetobarleystriperust.
Theor.Appl.Genet.111,1260–1270.
Venuprasad,R.,Bool,M.E.,Quiatchon,L.,StaCruz,M.T.,Amante,M.,Atlin,G.N.,
2011.Alarge-effectQTLforricegrainyieldunderuplanddroughtstresson
chromosome1.Mol.Breeding,http://dx.doi.org/10.1007/s11032-011-9642-2.
Venuprasad,R.,Dalid,C.O.,DelValle,M.,Zhao,D.,Espiritu,M.,StaCruz,M.T.,Amante,
M.,Kumar,A.,Atlin,G.N.,2009.Indentificationandcharacterizationof
large-effectquantitativetraitlociforgrainyieldunderlowlanddroughtstressinrice
usingbulk-segregantanalysis.Theor.Appl.Genet.120,177–190.
Venuprasad,R.,Lafitte,H.R.,Atlin,G.N.,2007.Responsetodirectselectionforgrain
yieldunderdroughtstressinrice.CropSci.47,285–293.
Verulkar,S.B.,Mandal,N.P.,Dwivedi,J.L.,Singh,B.N.,Sinha,P.K.,Mahato,R.N.,Swain,
P.,Dongre,P.,Payasi,D.,Singh,O.N.,Bose,L.K.,Robin,S.,Babu,R.C.,Senthil,
S.,Jain,A.,Shashidhar,H.E.,Hittalmani,S.,VeraCruz,C.,Paris,T.,Hijmans,R.,
Raman,A.,Haefele,S.,Serraj,R.,Atlin,G.,Kumar,A.,2010.Breedingresilient
andproductivericegenotypesadaptedtodrought-pronerainfedecosystemsof
India.FieldCropsRes.117,197–208.
Vikram,P.,Swamy,B.P.M.,Dixit,S.,StaCruz,M.T.,Ahmed,H.U.,Singh,A.K.,Kumar,
A.,2011.qDTY1.1,amajorQTLforricegrainyieldunderreproductive-stage
droughtstresswithaconsistenteffectinmultipleelitegeneticbackgrounds.
BMCGenetics12,89.
Vikram,P.,Kumar,A.,Singh,A.K.,Singh,N.K.,2012.Rice:genomics-assistedbreeding
fordroughttolerance.In:Tuteja,N.,Gill,S.S.,Tiburico,A.F.,Tuteja,R.(Eds.),
ImprovingCropResistancetoAbioticStress.Wiley-VCHVerlagGmbH&Co.
KGaA,Germany,pp.715–731.
Xu,J.L.,Lafitte,H.R.,Gao,Y.M.,Fu,B.Y.,Torres,R.,Li,Z.K.,2005.QTLsfordrought
escapeandtoleranceidentifiedinasetofrandomintrogressionlinesofrice.
Theor.Appl.Genet.111,1642–1650.
Xu,K.,Xu,X.,Ronald,P.C.,Mackill,D.J.,2000.Ahigh-resolutionlinkagemapofthe
vicinityofthericesubmergencetolerancelocusSub1.Theor.Appl.Genet.263,
681–689.
Yang,J.,Hu,C.C.,Hu,H.,Yu,R.,Xia,Z.,Ye,X.,Zhu,J.,2008.QTLnetwork:mappingand
visualizinggeneticarchitectureofcomplextraitsinexperimentalpopulations.
Bioinformatics24,721–723.
Ye, G., Smith, K.F., 2010. Marker-assisted gene pyramiding for cultivar
development. Plant Breeding Reviews, vol. 3. John Wiley and Sons,
pp.219–256.
Zhang,G.L.,Chen,L.Y.,Xiao,G.Y.,Xiao,Y.H.,Chen,X.B.,Zhang,S.T.,2009.Bulked
segregantanalysistodetectQTLrelatedtoheattoleranceinrice(Oryzasativa