DOI: 10.12928/TELKOMNIKA.v15i1.4677 399
A Designing Dairy Cattle Facilities Based on
Statics/Dynamic Zoometry by Using Artificial
Intelligence
Sugiono Sugiono*, Rudy Soenoko, Rio Prasetyo Lukodono
Department of Industrial Engineering, Brawijaya University (UB), Indonesia Corresponding author, e-mail: [email protected]*, [email protected], [email protected]
Abstract
The dairy cattle productivity is very depending on the quality of their facilities and their environment condition. A lot of researches have been done in this area, but it is not developing the knowledge of animal dimensions and behaviours correlated with their facilities design. Complexities of dynamics zoometry is very depending on cow behaviours that it forced to use neural network (NN) approaching. Hence, the purposes of the paper is to create the concept of static and dynamic zoometry approach to guide the ergonomics facilities design and the modern of dairy cattle house based on zoometry data by using artificial neural network. The research is started with study literature of anthropometry, CAD design, dairy cattle, facility design and neural network. The next step is collecting the data of cow dimensions for static zoometry (17 variables) and cow behaviours for developing the concept of dynamics zoometry (5 variables). The static data is used as input factor and dynamic data as desire of Back Propagation NN model. The result of BPNN training is used to design the dairy cattle facilities, e.g. 3D CAD house with minimal length = 357.67 cm, minimal width = 132.03 cm (per tail) and minimal height = 205.28 cm. Finally, the paper is successfully developed the concept of zoometry approach and BPNN model as pioneer of implementing comfort knowledge.
Keywords: animal comfort, cattle house, facility design, neural network, zoometry
Copyright © 2017 Universitas Ahmad Dahlan. All rights reserved.
1. Introduction
Milk is very important commodity of food in the world for which providers of calcium, phosphorous, magnesium and protein which is all essential for human healthy. Adequate consumption of milk from early childhood and throughout life can help to make the bones more strong and protect them against diseases in their live. Milk provides the following beneficial nutrients in varying quantities, there are calcium, phosphorous, magnesium, protein, vitamin B12, vitamin A, zinc, riboflavin, folate, vitamin C, iodine [1]. The increasing of people to realize how important of milk product in their life boosted the demand of milk production. As consequence, the number of dairy cattle farmers and also the productivity should be increased in the future. Based on Table 1 we can indentify that the ratio between the milk is produced and the number of dairy cow population experienced a downward trend. If this condition occurs continuously, it will make Indonesia will continue to depend on imports from other countries. Addressing required at Table 1 we need an approach that can increase the productivity of fresh milk. One of method to increase the milk productivity is maintaining the cow facilities more comfortable e.g. house, free stall, floor, etc. There are some researchers investigated the dairy cattle comfort including cow house and their facilities. Cook and friends reported that physical accommodation of dairy cattle should provide a relative dry area for the dairy cattle to lie down and be comfortable [3].
cleanliness and cow comfort. Dairy facilities should be designed to keep the cows and calves comfortable in order to maintain DMI (Dray Matter Intake) and thus maximize economic production. Other studies have reported similar results. Jim Reynolds identified the cow comfort into 5 factors for heat stress, sanitation, free stall design, walking surface and walking distance [6]. In short, dairy cattle facilities are important factor of key success in milk business and it should be designed to keep the cow and calves comfortable in order to maintain milk quality and thus maximize economic production.
Table 1. Ratio between Fresh Milk Production and Dairy Cattle Population 2011-2016 in Indonesia [2]
Period Fresh Milk Production Dairy Cattle Population Ratio
2011 974694 597213 1.632071
2012 959731 611940 1.568342
2013 786849 444266 1.771121
2014 800749 502516 1.59348
2015 805363 525171 1.533525
To cover the problem of comfort design for dairy cow facilities, the physical ergonomics knowledge is needed. The important knowledge of physical ergonomics area for human body is defined as anthropometry. It studies the variation of the human body dimensions in static and in dynamics condition [7]. Using same analogy, the paper converts the concept of anthropometry into the concept of zoometry to study the impact of variation of animal body dimensions. This analogy imagines that animal (cow) need feel comfort in order to produce milk, it’s like human too. Human need feel comfort at work in order to reach high productivity. Zoometry is created
from Greek language ζώο ( o that means an animal and έ ρο (metr ste) that means a measurement. Zoometry concept is defined as static and dynamics measurement of animal dimension in order to know the physical variation of specific animal population. The research used zoometry concept of dairy cattle to design their facility (house, free stall, floor, etc.) with the result that it will increase the dairy cattle comfort and milk production. This study considers static and dynamic measurement because of representing main activity at cattle. There are three main activity of cow at cattle that affected by static and dynamic condition such as feeding, lying and standing or transition events between lying and standing. The concept of zoometry can reduce the risk of cattle from annoyances of uncomfortable facility. It is a pioneer strategic to improve the cow comfort by using zoometry concept.
2. Research Method
2.1. Physical of Dairy Cattle
There are many kinds of dairy cattle e.g. fries Holland (Netherland), Shorthorn (UK), Holstein Friesian (Netherland), Jersey (UK – France), Brown Swiss (Switzerland), Red Danish Denmark), Drought Master (Australia), etc. The dairy cattle in Indonesia is dominated by Holstein Friesian which signed by white and black spot or red spot. Holstein Friesian can produce milk around 57.000 Kg per year per cow with content low fat at approximately 3.5 to 3.7% [8].Cow body dimension will influence the horizontal movement of the cow when it gets up or lie down use around 3 m. The moving forward motion is 0.6 m and minimum distance to the bedding from the head or neck of the cow is approximately 0.2 m [9]. The reach of dairy cattle during feed intake depends on the type of tether and the feed alley height. The body length of the cow, from the shoulder area to the tail head the spine is not flexible which make it difficult for the cow to make sharp changes of direction while it is walking. Similar with human dimension, there are several things that can affect dairy cattle dimension as defined in zoometry measurements are species, phase development, age, gender, and clumps.
2.2. Dairy Cattle Behaviours
simple shapes such as triangles, circles and line. It is important information of colours in cow facilities design to increase dairy cattle more comfort. In the free area, the cow is automatically moving from the dark condition to the light area and they are avoiding strong contrast between sun and shadow. Comparing to the hearing of people, the cow almost has same frequency range and able to listen high tones that human cannot hear. Hearing in cattle is important in inter- and intra-species communication [10]. The sense of touch of cattle is important in determining which herbage is rejected or accepted. The secondary/special olfactory system can detect pheromones, volatile chemicals that are important in reproduction and feed selection [11].
Cattle communicate by sending out different signal such us poses, sound and smells [9]. A high density of cattle inside the house limits the freedom movement of the cow and can increase social stress. Cattle have a distinct circadian rhythm, in which the main rest, feed and rumination activities vary according to fixed pattern. Grazing occupies a large amount of time for dairy cows about 8 hours/day. Grazing behaviour is affected by many factors, including environmental conditions and plant species. In a dairy herd of Friesian cows it was found that there was a consistent order for lying down and standing up [12]. The natural lying down behaviour of cattle begins when the animal sniffs at the ground while it slowly moves forward. The head and body of fully developed cow is thrust 0.60 – 0.70 m forward during the lying down process. When a cow wants to get up in natural way it firstly raises to its knees and afterwards the hind part of its body is swung up via the knees, which function as rocking point.
2.3. Dairy Cattle Facility
The facilities should be supported the main cattle activities of resting, drinking, eating and milking. The facilities must guarantee the cattle will get stuck, injuries, and stress behaviours. Finally, the best facilities are indicated by cattle comfort level and increasing milk production from time to time future. Moreover, better floor is not warm and humid to reduce possible skin injuries and more thermal comfort. The other facility is watering system; a watering cup should have an opening of at least 0.06 m2, approximately 30 cm in diameters or similar opening size [8]. It is recommended that the main of the water supply is ring –connected and that the water is under a constant pressure. The best way watering is supplying via service pipe, it will make sure the fresh water is always supplied. Watering system as possible designed with little dirt as possible is collected. Free stall is very important for cattle to feel in private area concerned with comfort resting. Nigel B. Cook on his research of free-stall design for maximum cow comfort reported that 11.3 hours is needed for time lying down in the stall and 2.9 hours for time standing in the stall a day or totally 14.2 hours per day contacted with free stall (around = 59.17%) [3]. Cow must have free stall design correctly size because of correlating with milk production. A lot of famers reduce stall length and stall width in order to saving construction cost. It will reduce the level of cow comfort and milk production. Free stall should be designed correctly and maintained and should be sloped front to back and comfortable surface provided.
2.4. Research Methodology
The zoometry data of dairy cattle are collected from two regions in Malang and in Blitar with average age between 3.5 to 6 years (optimal daily milk). The total of cow being sample in Malang was around 300 and in Blitar were around 200 samples. Generally, the measurement is divided into two sections for static dimension (mentioned later as static zoometry) data and for cow movement (dynamic zoometry) data. To do the research some equipment was prepared, such us: paper sheet, pen, ruler, stopwatch, and Handy Cam. The static measurement focused on cow body dimension e.g. length of body, length of leg, wide of body, length of neck, etc. The dynamic zoometry is taken under the cow engaged some physical activity. The measurement focused on how the cow movement (walking), moving the tail, moving head during drink or eating and moving from stand up to lay down or conversely. To do detail measurement some videos have been taken during the measurement process. Briefly, statistic test for normality and validity data are presented in zoometry data analysis.
anthropometry concept. To looking for the best correlation between static and dynamic data, the neural network model is employed. As a result, the zoometry concept is strengthened to use as guiding for cattle facilities design in 3D CAD model.
Figure 1. Zoometry Measurement of Dairy Cattle for Static and Dynamic Data
Genetic algorithms have to solve this problem because this method has been used extensively to find the optimum conditions for example in studies following, algorithm genetics is used to predict the onset of tachyarrhythmias ventricle provides an opportunity to reduce the loss due to sudden cardiac death [13], genetic algorithms integrate thinking immunity the biology of the immune system [14], and in the determination of optimal parameter through simulation [15]. The BPNN will train the database with genetic algorithm (GA) optimisation in 2 hidden layers. Mean square error (MSE) is employed to evaluate the training quality until convergence solution is achieved. The detail of BPNN structure is presented below, working in 2 hidden layers, initial neurons = 20 for first hidden layer and 10 for second hidden layer, Delta Bar Delta learning algorithm with initial values for learning rate and momentum are 0.500000 and 0.0166, sigmoid transfer function, number of population is 50 chromosomes and generation number for maximum 100, initial network weight factor is 0.1074. Mutation probability is 0.01, Using heuristic crossover.
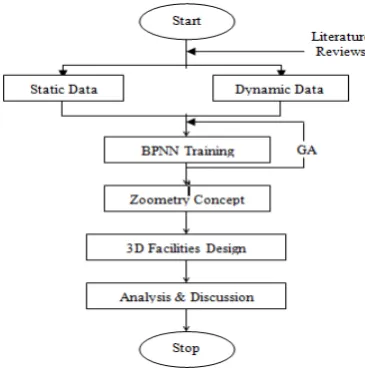
Figure 2. Flowchart of Developing and Implementing the Zoometry Concept using BPNN model
3. Results and Analysis
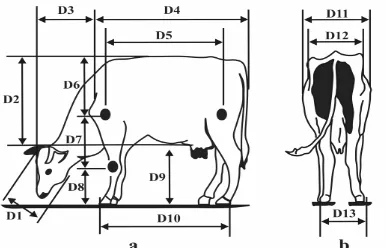
(D1, D2, D3, D16) of static zoometry in the 2D picture. The dimensions of D1 to D10 explain the position in front view of dairy cattle (lengthwise direction) and the dimension of D11 to D13describes in lateral direction of dairy cattle. The D1 is for height of head, D2 is height of body, D3 is the length of neck + head, D14 is head wide, D15 is length of tail, and D16 is length of horns.
Figure 3. Static zoometry dimensions; a. front view of cow dimensions (D1 to D10), b. backside of
cow dimensions (D11 to D13)
Table 2 shows some of the results of static zoometry measurement in 16 dimensions as mentioned before with 25 data respectively. According to the data, the average of data and the deviation standard are calculated for all dimensions (D1 –D16), as example D1 has average ̅=
39.64 and deviation standard ( 1) = 2.68. Moreover, D1 has lower control limit (LCL) = 34.17
and upper control limit (UCL) = 44.47 is categorized in homogeneity data. The same way, the other static cattle dimensions (D2 – D16) also categorized in homogeneity data. As a result the data measurement is ready to use for next step of sufficient data test.
Table 2. Data measurement results from 500 number of source data of cattle for static dairy cattle dimension
calculate the number of data requirement (σ’ , the research select confidence level of collecting data 95% (k =2 and error = 5% (s = 0.005 has σ’ = 7. As a result the data D1 can be
categori ed in sufficient data (σ’ < σ . Using the same way, the data of the other dimension D2 – D16 all are categorized in sufficient data.
There are 7 dimensions for D17 to D23. In purposing of comfort rising or lie down
movement, the resting area must provide cattle with the easy movement for vertical, forward and lateral movement without obstruction, injury or fear. A rising motion of cattle includes the freedom to lunge forward, bob the head up or down, and stride forward. A resting motion of cattle also includes the freedom to lunge forward and bob the head. Each time the cow lies down, they puts about two-thirds of her body weight on her front knees then her knees drop freely to the floor from a height of 20 to 30 centimetres. It is therefore very important to have the best quality bedding, as consequence the cow can painlessly lie down whenever she wants to. The easy method to know the comfort level is to look at and check how fast a cow lies down in a cubicle.
Based on Figure 4, the dynamics zoometry data of dairy cattle is collected from the same cattle of the static zoometry data. The measurement results are putted in Table 3 with 25 replication every dimension of dynamic dimension. According to the data, the average of data and the deviation standard are calculated for all dimensions (D17 –D23), as example D17 has
average ̅= 54.40 and deviation standard ( 17) = 4.75.Moreover, D17 has lower control limit
(LCL) = 44.90 and upper control limit (UCL) = 63.90 is categorized in homogeneity data. The same way, the other static cattle dimensions (D18– D22) also categorized in homogeneity data.
As a result the data measurement is ready to use for next step of sufficient data test. Sufficient data test for static cattle dimensions is determined based on formula 1 above. To calculate the
number of data requirement (σ’ , the research select confidence level of collecting data 95% (k
=2) and error = 5% (s = 0.005 has σ’ = 12. As a result the data D17 can be categorized in
sufficient data (σ’ < σ . Using the same way, the data of the other dimension D18– D23 all are
categorized in sufficient data.
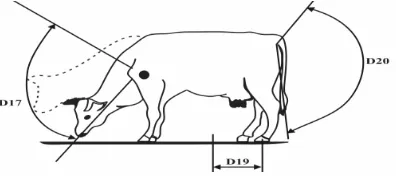
Figure 4. Dynamic Zoometry Dimensions of Dairy Cattle (D17, D19, D20)
Same as anthropometric, the zoometry are specified in term of percentiles with population is divided into 100 percentage categories. The percentiles are ranked from least to greatest with respect to some specified type of cattle body measurement. For example 5th percentile is a value whereby 5% of the population are shorter and 95% are taller, 50th percentile is the medians measurement, and 95th percentile is a value whereby 95% of the cattle population are shorter and 5% are taller. Formula 2 show how to calculate the percentile of zoometry for 5th, 50th and 95th.
Table 3. Data Measurement Results of Cattle for Dynamic Dairy Cattle Dimension
No Explanation Dairy Cattle Dimension
1 2 - 499 500
D17 Vertical head movement (0
) 50 55 - 43 45
D18 Horizontal head movement (0) 200 220 - 225 240
D19 Step walking (cm) 53 72 - 77 64
D20 Cow tail movement (0) 120 110 - 112 103
D21 Space for lay down (cm) 313 309 - 312 318
D22 Space for gets up (cm) 300 296 - 299 205
D23 Width space (cm) 132 130 - 120 118
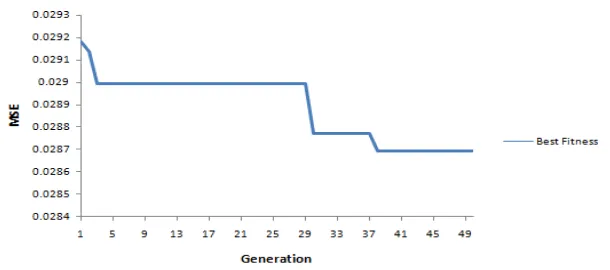
(BPNN) is selected in training process as structured in 3 of research methodology. Figure 5 explains the results of BPNN training using genetic algorithm (GA) optimisation in one replication. According to the graph, the training process will stop in 49 generation with mean square error (MSE) = 0.0287. Finally, the BPNN model is ready to use for predicting of any input data to looking for the output data (dynamics data). The BPNN model is very useful for the user to do some test for looking for cow behaviour correlated with cow dimensions in design process.
Figure 5. Dynamic Zoometry Dimensions of Dairy Cattle (D17, D19, D20)
Next stage is implementing the zoometry concept and BPNN model to evaluate and redesign the cattle facilities. For example, ergonomics cattle house design is presented in this paper. Computer Aided Design (CAD) is used to clarify and to validate the zoometry results. Dairy cattle house is beneficially use 3D CAD model software before making prototype. First step of designing the cattle house is defined the house parameters that are:
1. Length of cattle house (L)
Length of cattle house is defined as the total summation of length for lay down and length for get up minus cattle length or L = ̅21 + ̅22– ( ̅3 + ̅4). L has average 346.67 cm and
deviation standard = 6.71 cm then by using percentile 95th
will produce Lzoometry = 346.67 cm +
1.64 x 6.71 cm = 357.67 cm.
2. Width of cattle house (W)
Width of cattle house is defined as the space for lay down or gets up easily or defined in D23. 23 has value = 125.96 cm and deviation standard = 3.70 cm then by using percentile
95th will produce Wzoometry = 125.96 cm + 1.64 x 3.70 cm = 132.03 cm
3. Height of cattle house (H)
Height of cattle house is defined as the summation of ̅2 + ̅9 + ( ̅3 x tan (0.5 x ̅17)). H
has average 194.64 cm and deviation standard = 6.49 cm then by using percentile 95th
will produce Hzoometry = 194.64 cm + 1.64 x
6.49 cm = 205.28 cm.
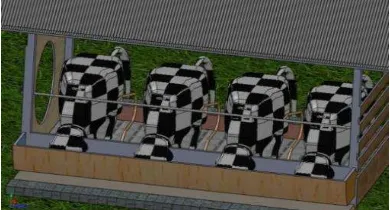
Figure 6. One Example of Implementing Zoometry Concept in Building Dairy Cattle House
4. Conclusion
The paper has successfully developing the concept of zoometry to describe the dimensions of dairy cattle in order to use in facilities design. There are two kinds of zoometry for static and dynamics condition with total number of dimensions is 17 and 7. The paper successfully presented the BPNN training as complexity of dynamic data (cow motion behaviour) correlated with cow dimension The paper also describes how to implement the zoometry concept in order to develop cattle house design. It is a pioneer to do the others facilities such as free stall, watering system, designing floor, and feeding rack. By using 500 number of source data of cattle, the zoometry concept is still fluctuate despite of successfully in homogeny test and data sufficient test. As consequence, there is still need a lot of data dimension to get steady zoometry. The zoometry concept will be an important topic of research in the future correlated with cattle comfort and cattle productivity.
References
[1] The dairy products as part of a healthy balanced diet. 2016. [2] Fresh Milk Production. 2016.
[3] Cook B Nigel, et al. Free Stall Design for Maximum Cow Comfort. WCDS Advances in Dairy Technology. 2009; 21: 255-268.
[4] Krawczel P, Grant Rick. Effects of Cow Comfort on Milk Quality, Productivity and Behavior. NMC Annual Meeting Proceedings. 2009.
[5] Smith F John, Brouk MJ, harner JP. Cow Facilities and Effect on Performance. Advance in Dairy Technology. 2002; 14: 317.
[6] Reynolds Jim. Dairy Facilities and Cow Comfort. Veterinary Medicine Teaching and Research Center. Tulare, CA.
[7] Bridger RS. Introduction to Ergonomics. London: Taylor & Francis. 2003.
[8] Brouk J Michael, Smith F John, Harner P Joseph. Facility and Climate Effect on Dry Matter Intake of Dairy Cattle. 5th Western Dairy Management Conference. Las Vegas, Nevada. 2001.
[9] The Danish Agricultural Advisory Center. Interdisciplinary report, Housing Design for Cattle – Danish Recommendation. Third Edition. The Danish Agricultural Advisory Center. 2002: 122.
[10] Phillips CJC. Cattle Behaviour. Ipswich, U.K: Farming Press Books. 1993. [11] Currie W Bruce. Structure and Function of domestic animals. CRC Press. 1995.
[12] Benham PFJ. Synchronization of behaviour in grazing cattle. Appl. Anim. Ethol. 1985; 8(4): 403-404. [13] Li Qingzhao, Jiang Fei. A Self-adaptive Multipeak Artificial Immune Genetic Algorithm.
TELKOMNIKA. 2016; 14(2): 647-654.
[14] KH Boon, KH Malarvili MB, Khalil-Hani M. Ventricular Tachyarrhythmia Onset Prediction Based on HRV and Genetic Algorithm. TELKOMNIKA. 2016; 14(3): 999-1008.
![Table 1. Ratio between Fresh Milk Production and Dairy Cattle Population 2011-2016 in Indonesia [2]](https://thumb-ap.123doks.com/thumbv2/123dok/235931.502067/2.595.134.461.210.270/table-ratio-fresh-production-dairy-cattle-population-indonesia.webp)