98 Dardjat MedJ Indones
Application
of
an
Image
Processing
Technique
for
Early
Diagnosis and
Monitoring
of
Glaucoma
M. Taufiq
Dardjat
Abstrak
percobaan ini dinmksudlan wûuk nrendetelcsi dini kclainan glaulcona Citra berwarna hasil pentotretanfundus ohtli penderin glaukonn yang nerupa1an penyebab kebutaan dan utenunjukan kelainan ganbaran diiadilan saupel. Dengan petnanfaatan teknologi pengolahan citra berupa proyeksi
radial
ditakttkan analkiscitra
tersebut. Metodaini
tergantung padafakta
bahwa area defek 'ntetipunyairefleksi yang lebih rendah pada panjang gelontbang hijau dan biru dibanding area
nornal.
NiLai intensitos reJleksi Pixel lpiciure-elenènt1 yaitu àlentent terkecil dari gauùar /warnadi
skor nulai 0 saupai 255. Perbedaan refleksi pixel itu sangat kzcil pada kasus glaukonn dini. Metoda ini terdiri dari santplitrg dan sunasi (penjunlahan data) nilai-nilai pixel untuk warna biru dan hiiau sepaniang garis radial antara dua lingkaran yang berpusat pada cup. Citra yang dipergunakan pada penelitian ini berupafoto fundusoirt*
Uir*orna
yangdidijintkæi.
Dari elcsperinen ini dapat disittrpulkan bahwa metoda ini dapat nendetel<si kelainanfundus yang relatifkecildandiniyangbiasanyahanyadapatditetnul<anolehahlinatayangcukupberpengalanan. MetodainijugadapatdikntakanIebii baik
dan praktis dibanding tenik enhansnren karena tidak menbutuhkan iluninasi lanpensasi, selain karena dapat nendeteksi cup secarct otôtt,atis. penelitian ini perlu ditanjutkan ke nhap aptikasi langsung, sehingga hasil penelitian seuakin dekat paàa penanfaatan teknologi cangih untuk bidang kesehatan tnata, Hrususnya kelainan pada retina seperti glaukona.Abstract
Early
stage glaucona can be diagnosed by finding retinal nerve rtber defects using a color image processittg technique. This ,trethod is based on the reflectance of the defective part which has low values in the green and blue wavelengths. The level pixel (picture elenrent)of reflectance is scored fronr O to 255. In early stage glaucona, the difference oJ that reflectance is very snall. This new nethod det"ctstiat sttnll
difference. The nethod consisfs of sanplitrg and sunnntion value of pixels in green and blu.e along the radial lines drawn bern*een tvvo circles whose centers are the sane and located at the center of the eye.It was
fouttd that thesnnll
differences can be detected only by doctors with a suficient experience. This nethod is better than the color enhanceilrent. Also, the detection of cup and blood vessels has been shown to assisr in autonntic processing.It
will be necessary to apply this ntethod to ,nany Patients to check the of the utility of the nethod and develop autonatic processing systen in thefuture.Keywords : Inage Processing, glaucona, early diagnosis
INTRODUCTION
The result
of
eye
morbidity
survey conductpd
by
Re-search and Development
Institution,
Ministry of
Health, Republic of Indonesia
in 1982
showed that theprevalence
of
blindness
in
Indonesia
is
about 1.2
%. There are about 2million
blindness cases inIndonesia
among the population
of
180
million
(1991).
Since blindness is notonly
a healthproblem,
but also asocial
problem,
the Indonesian
Minister
of
Health stated
in
theofficial
document
No.19/Birhup/67
that blindness
is
anational "disaster". Blindness, or
evenvision
lossbefore total blindness occurs,
causes
reductions in
working
hours,
working
capacity
andworking
oppor-tunity.
Blindness
causes
reduction
in
productivity,
which
may be equal tobillions
rupiah
per year. Oneof
the
imoortant
causes
of
blindness
in
Indonesia
is
glau"oÀu.lo
Glaucoma occurs when the inner
pressureof
the eyeball
increases. In the early stageof
glaucoma, someclinical
signs can be seenaround
theoptic
nerve head andin
theretinal
nervefiber
layer.
The changesin
thecup-disc
ratio,
the
changeof
height
in
the
rim of
cup
and
optic nerve
headpallor
occurs around the
optic
nerve head
because
of
the
increased pressure.
To
measure these phenomenon
automatically,
three
Vol 4, No 2, April-June, 1995
dimensional
measurement
method
by
using
a
grateprojection
on theretinal'2
has been proposed andtried.
But
this
procedure takes
a great time
to
search
thecorresponding points
in
thestereo-pair
images.In
theretinal
nerve
fiber layer,
it
appearsthat
retinal
nervefiber
axons arelost,
but
thepatient
still
can seein all
areas.The visual
field
defect
cannot be
detected.A
small
changeof retinal
reflectance
in
the blue
and green wavelengths occurs because oflossoffibers.
Also,
a small changein
height occurs. Several methodshave
beenreported
to
evaluate
theretinal
nerve
fiber
layer.
Hoyt
and colleagues trsedred-free
ophthalmos-copy
andreported
thesignificance
of finding
narrow,
detect
small differences by
these method.In
a recentstudy
wasreported a new
method thatis
basedon
the assumption that the nerve
fiber
layer
has birefringent properties,s'e and thefiber
layerthitk-ness
has linear relation retardation (the
polarization
change) measured
by
Fourier-ellipsometry. This
methodgives
us thevalue
of point
by point.
Here we propose a new method to detect the small
difference by using sampling according
toradial lines
on acolor retinal
photograph
andsummation
of
thesedata.
We also report the experimental
results using
color
retinal
photographs
of
normal and
glaucomà
eyes.METHODS
The
method consists
of
cup
detection,
radial
projec-tion,
andblood
vesseldetection. The cup detection
isused
for
deciding the center
of
the circles
for
thefollowing
processing. Theradial projection
is the mainmethod
for
detecting
the retinal nerve fiber
defects.Blood
vesseldetection
is
usedto classify
the vessels
and theretinal nerve
fiber
defect.1.
Radial Projection
[image:2.595.316.547.91.312.2] [image:2.595.310.549.484.737.2]The difference between defective part and normal parts
of retinal
nervefiber
layer
is detected as the differenceof
density
in
blue and
green images
of
color
retina
photographs. The
quantity of
thedensity difference
isvery small
in
theearly
stageof
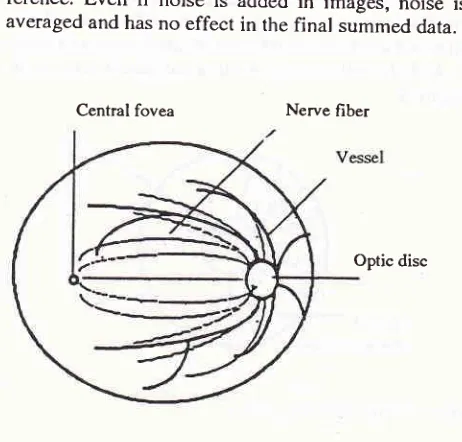
glaucoma. Here, a new method is proposed to detect thissmall difference. The
ideal method
consists
of
sampling the density
dataaccording
to
each nerve
fiber
bundle as shown
in
Figure
l,
summation
andcomparing
the surnmed datafor
each
nerve
fiber
bundle.
By
this
method, small
difference
is
enlarged and can be
seen
as
big
dif-Medical Innge
Processitrg
99ference.
Even
if
noise
is
added
in
images,
noise
is averaged and hasno effect
in
thefinal
summed data.Central fovea Nerve fiber
Optic disc
Figure 1. Projection along retinal
nenefiber
arionBut
it
is not so clear where eachfiber
bundle runs.It
is clear that
eachfiber
bundle
startsradial
from
therim of
thecup. So,
thereal
method
re uses theradial sampling
around thecup
Figure
2.It
may
called
the
radial
project
In
thecomputational method,
two circles
whose
centers are the same andare
in
the cup
aredrown
outside
of
the cup.Many radial
lines aredrown
from
thesmall
circle
to
the large
circle. The
data
is
sampled according
to eachradial line.
100 Dardjat
The method is explained using Figure
3.
Sam-pling
according
to thestraight
linesin
the areawith
thepixel
value
of
sector
100 and99
areshown
in
Figure
[image:3.595.310.544.90.364.2] [image:3.595.49.283.98.291.2] [image:3.595.56.284.325.510.2]3. And the value of
summation
of
data
is shown
in
Figure
4.Figure 3. Projection along
aline
99.0
9920
9900
9860
Line number
Figure 4. Projected data along each line
2.
Cup Detection
The cup is
detected
by finding the brightest part
in
retinal color
photographs.
The
process
is shown in
Figure 5, The retinal
image
is
sampled
roughly, for
example,
in
ten
point intervals to find
the brightest
point. This point is found in the cup
areathat
looks
white in
the image.But
theposition
is not the centerof
the cup.The
four points
denoted
a,b, c,
andd
that
have largevariation in intensity
are searched alonghorizon-tal
andvertical
lines drawn
from
thebrightest
point A
shown
in
Figure
5.The
centerof
thefirst circle
shown as C is decidedby using
the 4points.
Thefirst
circle is
drawn a little bit
outside the
4 points. The
radius
of
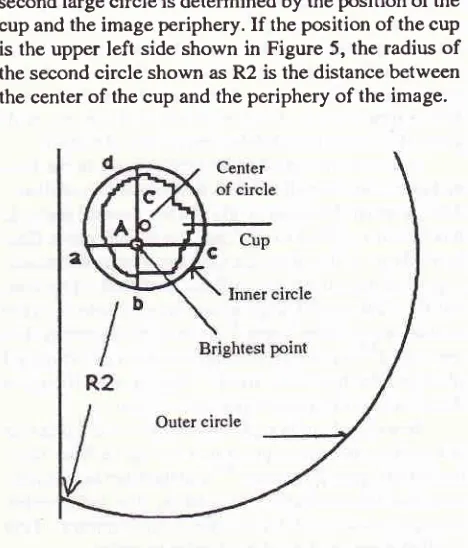
Med J Indones
second large
circle
is determinedby
theposition of
the cup and the imageperiphery.
If
theposition of
thecup
is
theupper
left
side shown
in
Figure 5, the radius
of
the secondcircle
shown
asR2
is the distance between the centerof
thecup
and theperiphery
of
the image.Figure 5. The nethod
for
autonrutic detection of the cup. The retinal inage is resanpled roughly tofind the brightest point A. Thefour point a, b, c, and d have large variationof
the intensity. C is the centerofthefirst
circle. R2 is the radius of the second circle.3.
Blood
Vessel
Detection
The
blood
vesselslook
red and havelower intensity
in
green and
blue wavelength
on images as they runfrom
the cup. Previous methods
classify
theblood
vesselsin
colored
spaces, and areonly
useful when
theretina is
uniformly illuminated.l'6'?'
By this
projection
andsampling method, the uniformly illuminated
photo-graphs
are
unnecessary because each
pixel
(picture
element) value
of
image
will
be
averaged and noises onphotograph
will
be losedThe
new-method
that
usesaround
the cup in
agreen
image is shown in Fig.6a and is plotted on
agraph
in Figure
6b.
In Figure
6b, the
blood
vesselis
detected as the darkpart
or lower
value
pixel in
greenor blue wavelength.
Finally,
in thefigures
of radialprojection (Figures
7- I
l)
thedefective
part can be detected as the partwith
lower
value
in
the slow
continues change
of
thesummed value
dueto
the lack
of
flatness
in
illumina-tion. And
also,
theblood
vesselparts
can be detected asthe
part with
sharp decreasing
in
the
samefigure.
But
theretwo
parts areclearly
classified
by
using
theinformation of
blood
vesseldetection.
(!o o ç ç
VoI 4, No 2, April-June, 1995
Figure 6. Blood vessel parts extracted by the nethod ofcircle
resanpling. (a) shows the resanpling along the circle. (b) shows the result of resamplitrg and classificatiott using
threshold.
RESULTS
Color photographics
of
retina
nervefiber
of glaucoma
eyes were used for
this
experiment. These color
photographic
dinto
images
with
of
1scanner
with
100x1green
an
were
processedby
using
personal
0l
with
image
buffer
andC-Langu
rcles are drawn
automat_ically
after detecting the
center
of the cup and
theimage periphery.
Also,
the
radial
lines were
automat-ically
drawn.
The
data
is
projected along
eachradial
line. The processing time
wasabout
lO seconds.Figure
7 toFigure
11, (a) shows theprojection
lines on
theretina
images and(b)
shows thè summed dataon
each
7a, thedefect can
be
ve andIn
theFigure
showsin blue
and the
lower
graph shows the summation
in
green.
From Figure 7b, we
find
that the values
of
summation
from
the
line
number
of 0'to
140 and 300 to 370 aresmall. Of
course, thesetwo parts
correspondwith
the defective
part
shown
in Figure
a.The
sharpMedical
luage
Processittg
l0l
decreasing
part
painted red at the
line
number
of
50,150 and 390 is due
to
theeffect of
blood
vessels.In
Figure
8a, a wedge shapeddefect
is seenfrom
the upper
right
side to thelower
left
sidein
the center.In Figure
8b, the
line
number
of this
defect
is
200 to
270. This part looks like a mountain
becausethe
il-lumination
was
not flat. If
the defect were
not
there,the shape
would
be aperfect
hemisphere.In Figure
9a,it
is
difficult to find
the defecrive parr. Ar
the line
number
of
100, sharp
decreasesare
seen becauseof
blood
vesselsnoted
in the lower
graph
of Figure
9b.The defective part
cannot
befound
from
the summeddata in green.
At
theline
numberof
150to23Oand
300low
values
in
the
upper nosed asdefective part by
In
theFigure l0a, two
defective parts are detected. One isclearly
observed atline number
l0Oto
150 in theretinal
photograph
and
in the radial projection
mapshown
in Figure
10b. The other is detected at linenuml
ber 300
in
theradial projection
map, butit
isdifficult
tofind
it
in
the retinal photography due
to its
small
dif-ference. This part is also detected as the
low
value atline
number 250
in Figure
1lb.
Through
these
experiments,
it
was found
thatsmall differences between nerve
fiber
defects and thenormal parts
can be detected, evenif
theillumination
is not
flat. If
thedefective
part and the marked changesin
blood
vesselscan be
separated,the diagnosis
will
become easy.
CONCLUSIONS
The
radial
projection
method is
proposed to detect thenerve
fiber
defect
in
theearly
stageof
glaucoma. The
method depends on the
fact
that thedefect
has alower
reflectance compared
to
thenormal part. The method
consists
of sampling
and summation along radiating
lines
drawn
betweentwo
circles
whose""ni".,
are thesame
and located
at the center
of the cup
of
eye.Through experiments,
it
wasfound that
thesmall
dif_ference
of
the defective and normal parts can
bedetected
only
by physicians
with
experience.Sometimes, the
problem in
photography
techni_que
and processing
is to
make
the
homogen
or flat
illumination
to
theobject. For
thesepu.por"
we makecompensation
illumination. The bad or unflat
il_luminous
will
changeintensity of
thecolor,
andfinally
will
cause misdiagnosis. The compensation
of
il_lumination
is
neededto
reduce theerror
in
interpreta-tion
of
photograph.
Therefore this method
does not
need
compensation
of illumination. The
detection
of
cup and
blood
vesselshave
beenshown
to
assist thet02
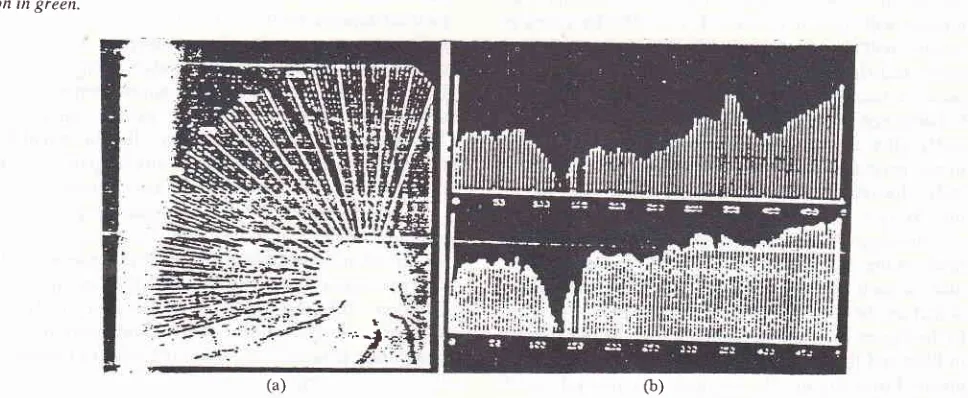
Dardjat Med J IndonesFigure 7- Experinental result. (a) shov,s the radial projection on the retinal inage. The original intage is color photograph. The wedge shaped defect is seen clearly itt the up and down
directionfroil
lhe cup. (b) the upper graph shov,s the projectio,l itt blue and the Iower gralth shov's the projectiotr in green.(a) (b)
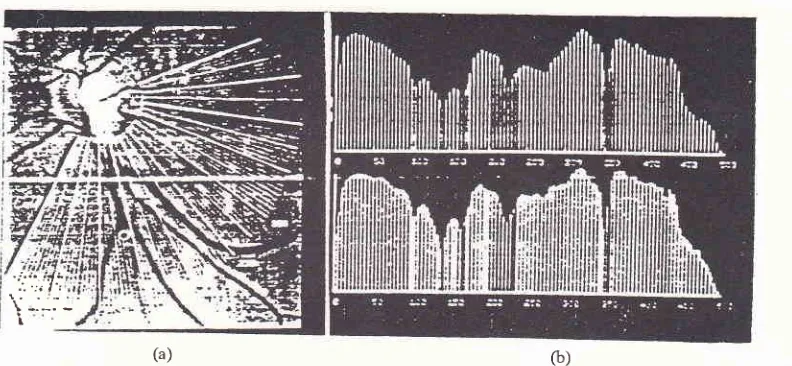
Figure 8. Et'perirnental resuh.
righr side to the lov,er left side tion in green.
(a) shows the radial projection on the retinal image. The wedge shaped defect is seenfrom the upper in the cettter. (b) the upper graph shows the projection in blue and the lower graph shows the
projec-(b)
(a)
Figure 9. E.\Periiltental result. (a) shows the radial projection ot't the retinal ittnge. This is the
rlfficult
e.rartrple to.fin4 the defect part. (b) the upper graph shows the projection in blue and the lov,er graph shou,s the projectiorr in greenVol 4, No 2, April-June, 1995 Medical hnage Processing 103
[image:6.595.56.532.80.266.2] [image:6.595.101.497.316.499.2](b)
Figure IO- Experiuental result. (a) shows the radial projection on the retinal itnage- (b) the upper graph shows the projection in blue and the lower graph shows the projectiott in green.
(a)
G)Figure 11. Experinental resub. (a) shou,s the radial proiectiott otr the retinal itilage. (b) the upper graph shows the projectio, itt blue and the lower graph shows the projectiot't i,'t green.
I ':; l't
...-.
As
it
is
mentioned before, the
scanner was usedin
this experiment to replace
the video-camera, dueto
the budget
limitation. This limited
the
application
of
this
methodto
thepatients. We
will
apply thjs
methodto many patients to check the usefulness
of
the method andwe
will
develop
full
automatic processing
in
thefuture. Advanced
research and experiments are neededto apply
anddevelop
the method.Acknowledgements
I
especially
appreciate
and
acknowledge
the
useful
guidance and
advice
from
prof.
y.
yasuda,
my
academic
advisor during my period
of
study
of
theimage processing technique
at
Chiba University,
Japan.
I
also acknowledge
my
special thank to
Asso.Prof.
K.
Ohnuma
who
gave me
important
assistanceduring
theconducting
of
this
research.REFERENCES
l.
CornsweetTN,
HershS,
HumpriesJC,
Beesmer RI,Cornsweet
DW
editors. euantificationof
the Shape and Color of the Optic Nerve Head proceeding of the SecondInternational Symposium; 1982; October 23-5:Tucson Arizona, Spring Verlag, 1983.
2. Yoshimura T, Fujita
y,
Nakaya H, Suzuki N. Developmenrof
Three Dimensionally Measuring Instrumentof
OcularFundus
in
Kogaku. Iapan Journalof
Optics 1973;lg:495_ 501.3. Hoyt WF, Frisen
L,
NewmanNM.
Funduscopy of Nerver04
Dardjat4. Sommer
A,
QuigleyHA,
RobinAL,
Miller
NR, KatzI,
Arkell
S. Evaluationof
Nerve Fiber t ayer Assessment in Arch Ophthalmology 1984;98:566-7l.
5. Airaksinen
Pf,
Drance SM, Douglas GR, Mawson DK,Nieminen
H.
Diffuse and [-ocalized Nerve Fiber [,oss in Glaucoma. AmI
Ophthalmol 1984;98:566-71.6. Peli E, Hedges TR, Schwarts B. Computerized Enhancement
of
RetinalNerve Fiber Layer. Acta
Ophthalmologica1986;64:.113-22.
7. Cooper RL, Eikelboom RH, Barry C. Computerized Den-sitometry of Red-free Retinal Photographs Correlated with Automated Perimetry. Curr Eye Res 1988;7:789-92.
Med J Indones
8. Brink HB, Van Blokland GI. Birefringence of the Human Foveal Area Assessed
in Vivo
with Mueller-matrixEllip-sometry.
I
Opt Soc Am 1989; A.5:49-57.9. White RN, Andreas WD, Anne C, Harry Q, Blake S, Klaus
R.
HistopathologicValidation
of
Fourier-EllipsometryMeasurements of Retinal Nerve Fiber I-ayer Thickness, Arch Ophthalmology 1990; 108:5?7-5600.