Physical Sciences
A R T I C L E
1
‡
Correspondence: [email protected]
Received: 20 April 2012; Accepted: 9 October 2012
Porosity and mineral fraction estimation of carbonate
rock with an integrated neural network / image
processing technique
J. Adler1‡, P.D. Wardaya2, L. Hendrajaya3, B.E.B. Nurhandoko1,4, D. Noeradi5
1 Wave Inversion and Subsurface Fluid Imaging Laboratory (WISFIR Lab.), Earth Physics Research Division,
Department of Physics, Institut Teknologi Bandung
2 Department of Petroleum Geoscience, Universiti Teknologi Petronas, Tronoh, Malaysia
3
The Earth Physics Research Division, Department of Physics, Institut Teknologi, Bandung
4 Rock Fluid Imaging Laboratory, Bandung
5 Department of Geology, Institut Teknologi, Bandung
Porosity and mineral fraction information are crucial in reservoir characterization, however the exact value of these parameters is difficult to measure. We propose a new method for estimating the porosity and mineral fraction of carbonate rock from thin section images using an integrated neural network/image processing technique. Neural networks were built and trained to classify porosity and minerals of carbonate (calcite and dolomite) based on their color after chemical treatment. Pixel values of these colors were attributed with a target code value and represented in a 2D image (matrix) from which a simple image processing pixel filtering and counting algorithm was employed to calculate each fraction. Computation time was less than 40 seconds and classification error was less than 2%. This method may be useful as a cost-effective alternative for estimating 2D-porosity and mineral fraction for thin section images of rock. Unlike porosimetry or X-ray diffraction (XRD) measurements, this method does not require liquid injection at the core-plug scale.
KEYWORDS: Backpropagation; Lavenberg-Marquadt; mean square error; convergence
COPYRIGHT: © 2013 Adler. This is an open-access article distributed under the terms of the Creative Commons Attribution License, which permits unrestricted use, distribution, and preproduction in any medium, provided the original author and source are credited.
C
arbonate rocks are estimated to hold more than 60% of world’s hydrocarbon reservoir [1, 2, 3, 4]. They have a higher degree of complexity than clastic rocks, due to the biological processes involved intheir deposition. Carbonate secreting organisms have a powerful chemical and physical impact on the porosity and matrix of carbonate formations, overruling even the influence of gravity. This is unlike the grain sorting of sandstone which is guided predictably by gravity and hence results in a simple porosity matrix.
very well, we still do not understand the means by which they are deposited or organized in carbonate rock. This complexity of carbonate matrices is believed to cause the high variation in wave propagation, electric transport, and heat transfer properties of carbonate rock [5]. It may also explain why the physical theory for carbonate is not as well established as for sandstone. The Gassmann equation has been used for calculating the effect of fluid substitution on seismic properties using a rock’s frame properties [6, 7]:
(1)
Where Ksat is the bulk modulus of a rock saturated
with a fluid of bulk modulus Kfl, K* is the frame bulk
modulus, K0 is the matrix (grain) bulk modulus, and
φ is porosity. The matrix of a rock consists of the rock-forming minerals, the frame refers to the skeleton rock sample, and the pore fluid can be a gas, oil, water, or a mixture of all three. The basic assumptions made when using the Gassmann equation are [8]:
1. The rock (both the matrix and the frame) is macroscopically homogeneous.
2. All the pores are interconnected or communicating
3. The pores are filled with a frictionless fluid (liquid, gas, or mixture)
4. The rock-fluid system under study is closed (undrained)
5. The pore fluid does not interact with the solid in a way that would soften or harden the frame
Carbonate rock violates the Gassmann assumptions [9]. Firstly, both the matrix and frame of carbonate rock is heterogeneous. The porosity types of carbonate have been classified by Choquette and Pray [10]. Carbonate rock has complex origins and a high degree of variations, with no guarantee that only one type of porosity exists in each rock. Secondly, the pores of carbonate rock are not all interconnected. Many marine biological organisms, e.g., from the classes of Algae, Brachiopoda, Mollusca, Coelenterata, and Echinodermata, have a major influence in pore formation. Cavities inside the fossil’s body can increase the total porosity with no connectivity. One of the difficulties in characterizing carbonate reservoirs is the presence of these isolated cavities which cannot be filled with fluid and are not included in the Gassmann equation.
I. Conventional methods for evaluating porosity and mineral fractions
The conventional method for evaluating the porosity of rock is by liquid injection porosimetry at the core-plug scale. This technique can only estimate rock formations with connected pores because the injected fluid cannot fill the unconnected pore. Despite this, this technique has been employed for decades in energy and petroleum industries. It requires the core-plug of the sample and porosimetry equipment which is costly. An alternative to this method, used often by geologists, is a digital image processing technique which quantifies porosity from thin section images [11- 13]. This technique is more cost effective, and is able to predict the size of unconnected pores but the accuracy of the predictions is not optimal. Current image processing techniques can only predict 2D porosity and not volumetric porosity.
The most common technique for determining mineral composition of rocks is by X-ray diffraction. Since minerals have different crystal structures with different atoms, dimensions, and orientations - the diffraction pattern for one crystal differs from another crystal and this information can be used to determine rock composition. However this technique may not give a precise estimation of mineral composition because the sample measured is very small (only several grams) and hence may not be a true representation of the entire rock.
In this paper we propose a technique which stains minerals in carbonate so that they can be detected visually. Thin section images of these samples, showing stained carbonate rock and its pores, can thus be used to estimate the mineral fraction and porosity. Our analysis method integrates neural network and image processing techniques. We assume that Aragonite is absent from the rock. Due to difficulties in current staining techniques for aragonite, this method only provides a measurement of calcite and dolomite minerals.
II. Methodology
Backpropagating neural network for pattern classification
the pixel value of RGB image, ranging from 0-256 for each of the three layers.
Figure 1. Neural network architecture
We used the backpropagating neural network, a type of supervised neural network where the error or difference between network output and target is back-propagated through neurons until reaching the convergence or minimum error. Neural network parameters, such as the number of neurons involved, determine how quick the network reaches the convergence. Faster convergence was achieved by increasing the numbers of neurons.
Sample preparation and image capture
Thin section images of chemically stained carbonate rock were obtained from Dr. Peter A. Scholle from New Mexico Bureau of Geology and Mineral Resource. Briefly, carbonate rock was stained as per [14] so that calcite appeared as red, dolomite was white, and porosities were blue.
Sample characteristics
Samples consisted of sedimentary rocks with skeletal grains (e.g., bioclasts such as microbes, foraminifers, nano-fossils, etc.) and non-skeletal grains (e.g., ooids, intraclasts, matrices, etc. ) [14]. Sample #1 (fig. 6) came from pleistocene coral rock Fm., corehole, Bottom Bay, Barbados. Calcite here is stained red and dolomite is unstained. High-Mg calcite allochems, such as these red algae, tend to be the first components dolomitized and are the ones that most commonly retain primary fabrics. Note also the partial dolomitization of micritic matrix. Sample #2 (fig. 7), collected at Jameson Land, East Greenland is an oblique cut through stylolite-associated porosity. Uplift and load release commonly lead to separation of the rock fabric along weak, sometimes clay-rich stylolites, generating elongate, often unconnected,
secondary porosity zones. Hydrocarbon residues are seen throughout these stylolitic pore spaces. Sample #3 (fig. 8), was collected at Jameson Land, East Greenland. In this view, dead-oil residues covered an early non-ferroan calcite spar cement. After partial flushing of the hydrocarbons, cementation continued with ferroan and then non-ferroan calcite spar. With close examination, it may be noted that the early calcite spars contact the later ferroan and non-ferroan spars at only a few points. Hydrocarbons essentially coated the calcite preventing direct nucleation on the earlier cements. Continued meteoric flushing removed some of the hydrocarbons and resulted in an irregular linear pore (with some asphaltic residues) separating the two cements. In the same location with third sample, the sample #4 is another view of how hydrocarbons can affect cementation. In this case, early non-ferroan calcite and a thin zone of ferroan calcite spar were followed by hydrocarbon migration into the rock. After some flushing, cementation continued with further precipitation of ferroan calcite and fluorite. The hydrocarbon residues were later largely removed, leaving irregular pore spaces and scattered asphaltic residues between cement generations [14].
Figure 2. Illustration of training data collection for dolomite, calcite, and pores. Cropped areas show dolomite (white), calcite mineral (red), and pores (blue). Dolomite was cropped four times, pores were cropped four times, and calcite 3 times.
Image analysis routine
of the pixels in the image and attribute them with a target code. The output data was a 2D image (matrix) with completely classified pixel values. This matrix was then filtered based on the pixel value by a simple filtering algorithm. The unfiltered pixels and the fraction of each constituent was calculated using a pixel counting algorithm.
The training process (illustrated in fig.2) was performed by cropping regions of interest out of each colored section. The image pattern in each cropped segment served as the training input.
III. Results and discussion
Neural Network Classification
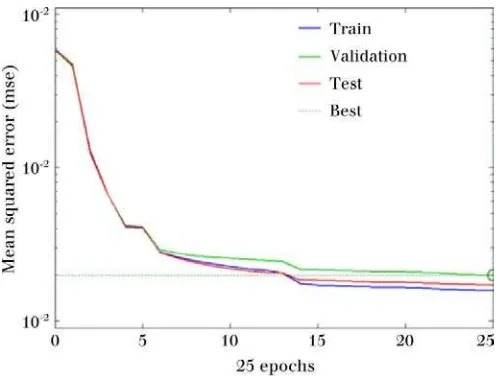
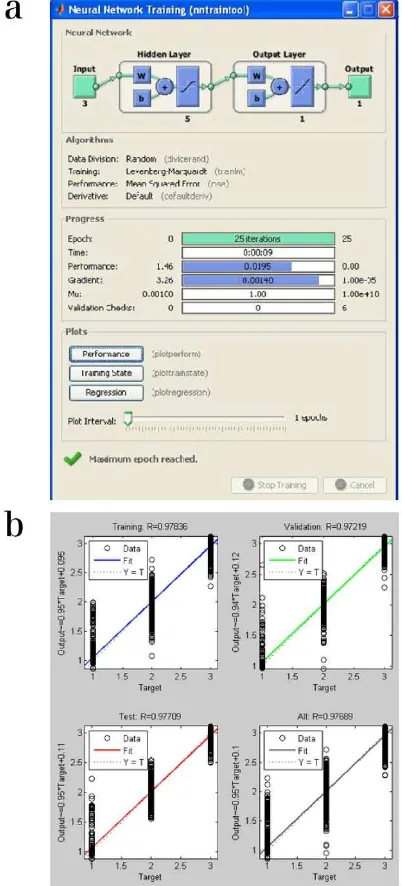
Carbonate rock thin section images from four samples were evaluated. A neural network was employed to work at a maximum of 25 iterations and the mean square error was defined as 10-10 (fig. 3). The algorithm could classify the image with an average computation time of less than 40 seconds. Network training used the Lavenberg-Marquadt algorithm. Network learning performance and regression of training data, validation data and testing data are shown in figures 3 and 4. The activation function (eq. 2, table 1), a linear combination between inputs and the weights, was used to determine the neuronal output:
(2)
The images and classification results of Samples #1-4 are shown in figures 5a, 6a, 7a, and 8a. The color look up table (LUT) on the right side of each image shows the pixel value attributed by the network.
Table 1. Commonly used activation functions of artificial neural
networks. The sigmoid activation function was used in this study.
Figure 3. Learning performance of the network (25 iterations
maximum; X axis)
Sample #1 was 384x521 pixels. It contained skeletal grain from fossils composed of dolomite mineral as seen in light brown with small amounts of calcite spread in the middle of the fossil body. Pore space in this sample was very small, seen in blue at top left corner and bottom right corner. The network yielded perfect classification results as shown in
figure 5b .Classification error, as reported in table 2
was very small for this sample (0.52), likely because of its simple pixel pattern. The fraction of each constituent is also presented in table 2. Calcite dominated the fraction by more than 50%. We thus classified this sample as limestone.
Sample #2 was 357x564 pixels. Calcite and dolomite were stained very well, with calcite as light pink and dolomite as bright white. Blue pore spaces were abundant. Dead oil residue was observed in black, filling a small part of pore space region. Classification results report an accurate network result (fig.6b). Error for this sample was only 0.44 % (table 2). This sample was also classified as limestone, as calcite dominated the fraction by more than 70%.
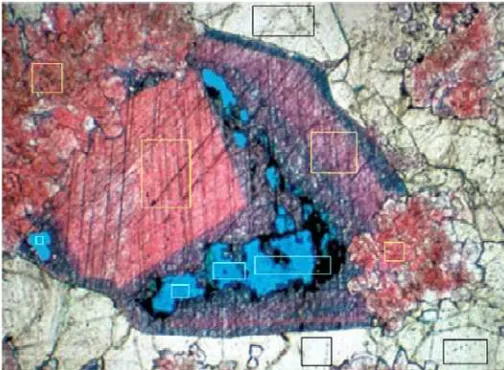
Sample #3 was 384x518 pixels. It contained a large crack in the pore space, death oil residue, and also dolomite mineral in very small amount. The error in classification results is seen in the red dot inside the dolomite classified region shown in the right panel of figure 7. The network also yields the very small error by only 0.48%. Pores and calcite share nearly equal fraction close to half of the total fraction while dolomite holds only 4% of fraction. Sample #4 was 384x521 pixels. This sample contained a complex variation of constituents. Ferroan Calcite was colored purple or dark blue.
Table 2. Constituent fractions of the samples
Figure 4. a) Neural network training with 25 iterations. b) regression line of training, validation, and testing data.
Death oil residue filled part of the pore space region. This image was treated differently from the three previous samples. The network was trained to classify all of the constituents, not only the pore spaces, calcite and dolomite, but also the ferroan
calcite. From figure 8, it can be seen that the error in fraction calculation (1.6%) was higher than the previous samples, likely due to increased image complexity. Ferroan calcite was colored purple, which made it difficult to distinguish with calcite (red) and pores (blue). This sample contained mostly dolomite by 37.9% followed by calcite and ferroan calcite (table 2). Pores and death oil residues made up 5.4% of the fraction.
IV. Conclusion
The Lavenberg-Marquadt method may be a cost-effective, efficient, and accurate alternative for estimating the 2D porosity and mineral fraction of carbonate rock. The network provided a good estimate of fraction of calcite, dolomite, and pore constituents of the sample. The network yielded perfect classification results as shown in figure 5b
(Sample #1). The average classification error was very small, less than 1%. The error depended to a large extent on the color pattern complexity the sample image. Accuracy in this method greatly depends on the sample staining technique.
Sample Pores (%) Calcite (%) Dolomite (%) Ferroan calcite (%) Error (%)
1 0.8489 56.6818 42.9889 - 0.5196
2 10.06 78.8668 11.5186 - 0.4454
3 47.6257 48.5736 4.2845 - 0.4838
Figure 5. a) Sample #1 with very small porosities seen blue, calcite in red and dolomite white-brown [14]. b) The classification result where red is dolomite, yellow is calcite and dark-blue is pore space.
Figure 7. a) Sample #3 of with large pore space with small dolomite fraction and several death oil residues [14]. b) The classification result. A small error is seen in red.
Figure 8. a) Sample #4 has the most complex composition of minerals in sample. Mg-ferroan calcite is present (purple). Death oil
Acknowledgements
We would like to deeply thank Dr. Peter A. Scholle for his permission to use his documentation. His support is greatly appreciated. We also wish to thank Muhammad Aria for many discussions about MATLAB.
Works Cited
1. Flugel, E. (2010). Microfacies of carbonate rocks: Analysis, interpretation and application. Springer, p. 877. 2. Schlumberger Industries. Technical Article: Carbonate
Reservoirs. Retrieved February 2012.
www.slb.com/services/industry_challenges/carbonate.as
px.
3. Sun, Y. F., Berteussen, K., Vega, S., Eberli, G. P., Baechle, G. T., Weger, R. J., Massaferro, J. L., Bracco, G. L., and Wagner, P. D. (2010). Effects of pore structure on 4D seismic signals in carbonate reservoirs. Geophysics Society of Exploration Geophysicists (SEG), 76th Annual Meeting, New Orleans, 1-2.
4. Zhang, X. (2010). Compaction of granular carbonates under conditions relevant to diagenesis and fault sealing.
Dissertation, Universiteit Utrecht, 332, p. 5 .
5. Kneib, G. and Shapiro, S. A. (1995). Viscoacoustic wave propagation in 2D random media and separation of absorption and scattering attenuation. Geophysics, 60, pp. 459-467.
6. Gassmann, F. (1951). Uber die elastizitat poroser medien. Verteljahrss-chrift der Naturforschenden Gesellschaft in Zurich, 96, pp. 1-23.
7. Berryman, J. G. (1999) Origin of Gassmann’s equation. Stanford Exploration Project, Report 102, pp .187-192. 8. Wang, Z. (2001). Fundamentals of seismic rock physics.
Geophysics, 66, pp. 398-412.
9. Adler, J. (2005). Feasibility study of Gassmann equation for fluid substitution of carbonate reservoir rock at Parigi formation. Thesis, Institut Teknologi Bandung, pp. 66-67. 10. Choquette, P.W. and Pray, L.C. (1970). Geologic
nomenclature and classification of porosity in
sedimentary carbonates. American Association of
Petroleum Geologists Bulletin, 54, pp. 207-250.
11. Richa, R., Mukerji, T. and Mavko, G. (2006). Image analysis and pattern recognition for porosity estimation
from thin sections. Journal SEG Annual Meeting, New
Orleans, Louisiana, 1 – 6.
12. Fauzi, U. (2011). An estimation of rock permeability and its anisotropy from thin sections using a renormalization group approach. Energy Sources, Part A: Recovery, Utilization, and Environmental Effects. 33(6), pp. 540-544.
13. Kameda, A and Dvorkin, J. (2004). To see a rock in a grain of sand. The Leading Edge, 23, pp. 790-792. 14. Scholle, P. A., and Ulmer-Scholle, D. S. (2003) A color
![Figure 5. a) Sample #1 with very small porosities seen blue, calcite in red and dolomite white-brown [14]](https://thumb-ap.123doks.com/thumbv2/123dok/468435.51133/6.612.47.569.326.515/figure-sample-small-porosities-calcite-dolomite-white-brown.webp)
![Figure 7. a) Sample #3 of with large pore space with small dolomite fraction and several death oil residues [14]](https://thumb-ap.123doks.com/thumbv2/123dok/468435.51133/7.612.45.568.315.524/figure-sample-large-space-small-dolomite-fraction-residues.webp)