Introduction
In areas that support tropical and subtropical dry forests, environmental degradation has been developing as a result of over-grazing, over-cultivation, inadequate irrigation, and over-logging, among other problems.
Afforestation combined with revegetation is the dominant focus for landscape planning designed to promote the recovery of the goods and services provided by these eco-systems. These efforts improve the livelihoods of people in local communities and yield other environmental ben-efits such as biodiversity conservation and the prevention of desertification. However, they can also lead to
nega-Tree Biomass of Planted Forests in the Tropical Dry
Climatic Zone: Values in the Tropical Dry Climatic
Zones of the Union of Myanmar and the Eastern
Part of Sumba Island in the Republic of Indonesia
Yoshiyuki KIYONO1
*
, Min Zaw OO2, Yasuo OOSUMI3 andIsmail RACHMAN4
1
Bureau of Climate Change, Forestry and Forest Products Research Institute (Tsukuba, Ibaraki 305–8687, Japan)
2
Forest Research Institute, Forest Department, Ministry of Forestry (Yezin, Yangon, Myanmar) 3
Japan International Forestry Promotion and Cooperation Center (JIFPRO) (Bunkyo-ku, Tokyo 112–0004, Japan)
4
Indonesian Institute of Science, Research Center for Biology (Bogor 16122, Indonesia)
Abstract
We measured the values for biomass and mean annual biomass increment (MAI) of planted forests in two parts of the Tropical Dry climatic zone (mean annual precipitation [MAP] < 1,000 mm) and in one site adjacent to one of the two parts and outside the Tropical Dry climatic zone to provide a comparison value for wet forests in the same region. MAI values of four planted forests averaged 2.60 (± 1.61 SD) Mg ha–1 y–1 at a MAP of 637 mm in the central dry zone of Myanmar. The MAI of exotic fast-growing tree species (Eucalyptus camaldulensis Dehn.) did not differ significantly from those of three native non-fast-growing tree species in the central dry zone of Myanmar. MAI values appeared to be lower on land with a high gravel content in the soil or with a higher degree of erosion. In the eastern part of Sumba Island in Indonesia, MAI of planted Tectona grandis L. forest equaled 3.76 Mg ha–1 y–1 at a MAP of 500 mm and 4.49 Mg ha–1
y–1
at a MAP of 1,500 mm. A Leucaena leucocephala de Wit stand produced a higher MAI (9.62 Mg ha–1 y–1) at a MAP of 500 mm. The MAI values for fast-growing tree species that we measured or collected in the Tropical Dry climatic zone were less than 20% of those recorded in the Tropical Moist and Tropical Wet climatic zones and about one-third the value for forests of non-fast-growing tree species. Accordingly, fast-growing tree species may not be capable of achiev-ing their fast growth rates under the Tropical Dry climate. This information will be useful in developachiev-ing land-use programs based on plantation forestry in dry forest areas.
Discipline: Forestry and forest products
Additional key words: afforestation, dry forest, fast-growing trees, MAI, reforestation
This paper reports the results obtained in “Afforestation basic data collection aiming at small-scale afforestation CDM (Clean Development Mechanism) in environmental planting (the Forestry Agency of Japan), Forest Department and Dry Zone Greening Department, Ministry of Forestry, Myanmar, 2004–2005” and “Reproduction strategy and carbon sequestration function of Schima wallichii (the Japan Society for the Promotion of Science Funds affiliated with the Ministry of Education, Culture, Sports, Science and Technology, Japan), Bogor Agricultural University (IPB), Indonesia, Indonesian Institute of Science, Research Center For Biology, Indonesia, 2004–2006.”
tive social impacts such as a loss of grazing land and of a source of livelihood. When we reallocate land to forestry activities to promote the sustainability of an area’s land-use system, understanding the existing livelihoods of the affected people and predicting the expected biomass pro-duction are necessary. However, there is little reliable data on biomass growth in dry forest areas16,18
. Land allocation based on inaccurate forestry data is likely to be ineffec-tive; therefore a careful assessment of the expected pro-ductivity will provide useful information on the amount of carbon that will be sequestered by the planted forests and the expected benefits of the development program for the local people and ecosystems in dry forest areas.
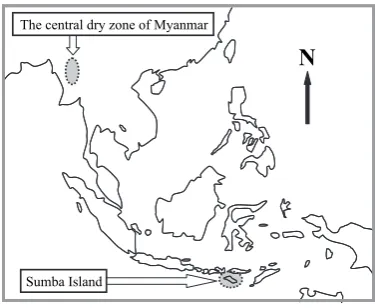
In our present study, we selected the central dry zone of the Union of Myanmar and the eastern part of Sumba Island in the Republic of Indonesia (Fig. 1) that have a relatively long history of plantation forestry as examples of tropical dry forest areas to obtain field observations and estimates of the biomass of planted forests. We then obtained data from the research literature on tropical for-ests to evaluate biomass growth of the planted trees in the dryland forest areas versus values from wetter tropical zones.
Study sites and methods
1. The central dry zone, Myanmar
The central dry zone of Myanmar includes the Sagaing, Mandalay and Magway regions and accounts for about 10% of the nation’s land area. The land receives a mean annual precipitation (MAP) of < 1,000 mm and the ratio of annual precipitation to potential evapotranspira-tion ranges between 0.05 and 0.6522
. About one-third of the country’s total population lives in the region (about 285 persons km–2
). Nyaung U town, in the central part of the dry zone, receives a MAP of 637 mm (mean of 1994– 2005)16
and the land is categorized as belonging to the
Tropical Dry climatic zone (MAP < 1,000 mm)4
and the “tropical dry region” (MAP < 900 mm)23
. The dry period lasts for 6 months (from November to April) and tempera-tures exceeding 40ºC are not unusual during March, April and May. Dryland farming is practiced in more than half of the area. Although the Ayeyarwady River passes through the region, its water is not yet available for use in agriculture or forestry.
The major soil types for the planted forests16 are Vertisols in the northern part of the area and Xanthic Ferralsols, Lithosols and Vertisols in the southeastern part. Volcanic Andosols are also found. The dominant soil tex-ture is a sandy loam.
The main land use is agriculture (with peanuts and sesame as primary crops), with palmyra palm trees (Borassus flabellifer) grown on level land and cattle and goat husbandry carried out on slopes (Fig. 2). Fuel collec-tion is common throughout the study area. The main source of energy for the residents of the town and its sur-rounding areas is agricultural residues. Because of the lack of other energy sources, the local people also depend strongly on natural forest resources to meet their daily energy requirements. The primary vegetation type can be classified as dry forest, and the dominant species of the original forest include Acacia catechu, Acacia leuco-phloea, Tectona hamiltoniana, Azadirachta indica, and
Zizyphus jujuba8
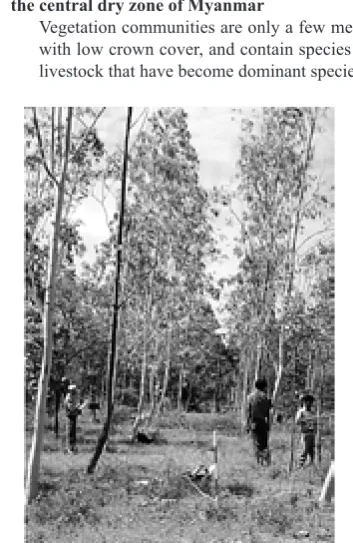
. However, natural stands are currently rare and sparse and dominated by shrubby vegetation, even in protected public forest areas. The vegetations are only a few meters tall, with low crown coverage, and con-tain abundant vegetation that is toxic to livestock, includ-ing A. catechu, Moringa sp. and Rhus sp. (Fig. 3).
The Forest Department and the Dry Zone Greening Department of Myanmar, which are currently managing 17% of the study area’s land, have been trying to remedy the depletion of the local vegetation by conserving rem-nant vegetation and establishing fuelwood forests. Groups
Sumba Island
N
The central dry zone of MyanmarFig. 1. Locations of the study sites
Agricultural land Managed
forests Grazing land
Fuel production
Slopes
Level land
Fig. 2. Illustration of the relationship between landforms and typical land use in the central dry zone of Myanmar
such as Yomiuri, the Japan International Forestry Promotion and Cooperation Center (JIFPRO), the Japanese government, and the Korea International Cooperation Agency (KOICA) have supported afforesta-tion and revegetaafforesta-tion projects. The main planted trees have been A. catechu, Albizia lebbek, Cassia siamea,
Leucaena leucocephala, Tamarindus indica, Dalbergia paniculata, Chukrasia tabularis, A. indica, Eucalyptus camaldulensis, T. hamiltoniana, Acacia senegal, Acacia auriculiformis, Acacia arabica, and Ficus spp., among others. The oldest planted forest that has been studied was established in 1973 (E. camaldulensis)16
. Most exist-ing plantations are on level and relatively fertile land. Initial tending was carried out carefully, and advanced regeneration was preserved during the site preparation. Trenches were dug for planted seedlings to collect soil moisture. The planted seedlings were usually relatively large and had been grown in containers. Watering was performed for some time. Special watering techniques and facilities were sometimes used (e.g., drip-irrigation systems, digging of wells, installation of pipelines, machinery supply). Grazing and the collection of fuel-wood were generally prohibited for about 5 y after planting.
The fieldwork was carried out in August 2004. We selected four planted forests (8-y-old T. hamiltoniana, non-fast-growing species, here after NFS, 8-y-old C. sia-mea, NFS, 8-y-old E. camaldulensis, fast-growing spe-cies, here after FS, Fig. 4, and 6-y-old A. catechu, NFS) established by the Forest Department near Nyaung U (Table 1). In each forest, we established two or four cir-cular sample plots (314 m2
) and the ground differed among the plots except plots for T. hamiltoniana: some were cov-ered with soils and in others, gravel appeared (Fig. 5). The overstory was open (i.e., no canopy closure) in all forests. We recorded the dbh and species of all planted and naturally established trees with dbh ≥ 1 cm in the plots, then estimated tree biomass using the dbh values and the estimated basic density in the plots as inputs for the following generic equation for estimating each indi-vidual tree biomass including belowground organs (kg d.w. tree-1
)7 :
Tree biomass = 5.29ba1.24
D1.28 (R2
= 0.978),
where ba is the basal area of a stem at 1.3-m height (m2 ) and D is the basic density (kg m–3
) of stem wood. The D values we used were 713 kg m–3
for E. camal-dulensis1
, 875 kg m–3
for A. catechu2
and 623 kg m–3 for
C. siamea7
. The D for other indigenous species was assumed to be 550 kg m–3
, which represents a mean basic wood density for a range of tropical tree species4
.
Fig. 3. Shrubby vegetation (here, Acacia catechu) develops under pressure from grazing and fuel collection in the central dry zone of Myanmar
Vegetation communities are only a few meters tall, with low crown cover, and contain species toxic to livestock that have become dominant species.
Fig. 4. Planted 8-y-old Eucalyptus camaldulensis forest in the central dry zone of Myanmar
Fig. 5. The appearance of the ground surface under a planted Cassia siamea forest in the central dry zone of Myanmar
Forest biomass is obtained as the sum of each indi-vidual tree biomass within a certain ground area for every planted forest.
2. The eastern part of Sumba Island, Indonesia
Sumba Island is in the Small Sunda Archipelago, east of Bali. About 350,000 people live on the island, which covers 10,854 km2 12
. The population density in the study area (Kabupaten Sumba Timor) is about 25 persons per km2 21
. MAP varies from less than 500 to more than 1,500 mm, according to the region12
. Most of the lowland of eastern Sumba Island belongs to the Tropical Dry cli-matic zone. The dry period lasts for 8 to 9 months, from February or March to October or November. Soils are
mostly Calciustolls (Mollisols) and Ustropepts (Inceptisols), but in coastal areas, Ustorthents (Entisols)12 are dominant. The Sumba people have had a tradition of breeding horses for the past several hundred years. Savannas are extensively distributed, mostly on terraces (Fig. 6), and there are scattered trees of species that are less vulnerable to fire (i.e., pyrophytic species; Fig. 7). Savannas that receive MAP > 500 mm y–1
have been invaded by Chromolaena odorata, an alien shrub species from the Americas. According to the local people, stock farmers have burned the savannas almost every year to make grasses sprout and produce young shoots to feed their cattle, water buffalo and horses. More than half of the people in the study area practice small-scale dryland
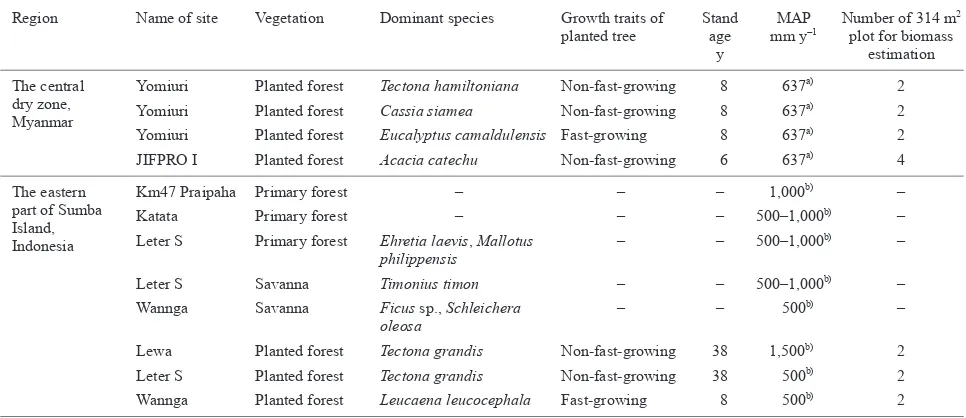
Table 1. Study vegetation in the central dry zone, Myanmar and the eastern part of Sumba Island, Indonesia
Region Name of site Vegetation Dominant species Growth traits of planted tree
Stand age
y
MAP mm y-1
Number of 314 m2
plot for biomass estimation
The central dry zone, Myanmar
Yomiuri Planted forest Tectona hamiltoniana Non-fast-growing 8 637a) 2
Yomiuri Planted forest Cassia siamea Non-fast-growing 8 637a) 2
Yomiuri Planted forest Eucalyptus camaldulensis Fast-growing 8 637a) 2
JIFPRO I Planted forest Acacia catechu Non-fast-growing 6 637a) 4
The eastern part of Sumba Island, Indonesia
Km47 Praipaha Primary forest – – – 1,000b) –
Katata Primary forest – – – 500–1,000b) –
Leter S Primary forest Ehretia laevis, Mallotus philippensis
– – 500–1,000b) –
Leter S Savanna Timonius timon – – 500–1,000b) –
Wannga Savanna Ficus sp., Schleichera oleosa
– – 500b) –
Lewa Planted forest Tectona grandis Non-fast-growing 38 1,500b) 2
Leter S Planted forest Tectona grandis Non-fast-growing 38 500b) 2
Wannga Planted forest Leucaena leucocephala Fast-growing 8 500b) 2
a): Mean annual precipitation at the meteorological station near the study vegetation. b): Monk et al. (1997).
Fig. 6. Grasslands (savannas) of the eastern part of Sumba Island, Indonesia
farming in valleys and along the coasts. The main agri-cultural crops include peanuts and maize. There is little arable land, and this land has been used continuously for agriculture and has rarely been fallowed for more than 1 y. Thus, natural forest cannot find a niche within the
pres-ent range of agricultural land, and only occasional pyro-phytic trees have become established.
The forests of Sumba Island have been a major source of sandalwood (Santalum album)12
. Small primary forests remain in valleys and as fragmented groups of
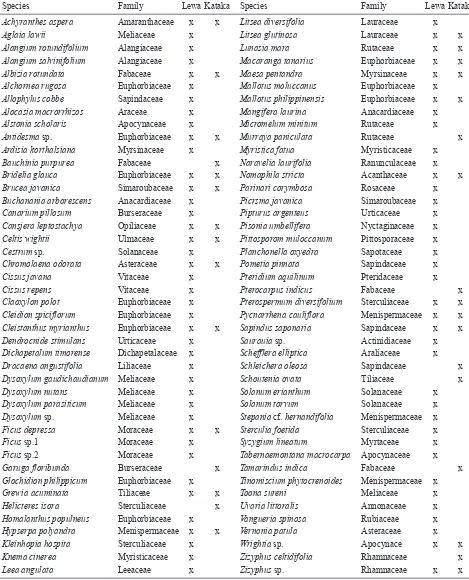
Table 2. Tree species recorded in primary forests at Lewa and Kataka on the eastern part of Sumba Island, Indonesia
Species Family Lewa Kataka Species Family Lewa Kataka
Achyranthes aspera Amaranthaceae x x Litsea diversifolia Lauraceae x
Aglaia lawii Meliaceae x Litsea glutinosa Lauraceae x x
Alangium rotundifolium Alangiaceae x Lunasia mara Rutaceae x x
Alangium salvinifolium Alangiaceae x Macaranga tanarius Euphorbiaceae x x
Albizia rotundata Fabaceae x x Maesa pentandra Myrsinaceae x x
Alchornea rugosa Euphorbiaceae x Mallotus moluccanus Euphorbiaceae x
Allophylus cobbe Sapindaceae x Mallotus philippinensis Euphorbiaceae x x
Alocasia macrorrhizos Araceae x Mangifera laurina Anacardiaceae x
Alstonia scholaris Apocynaceae x Micromelum minitum Rutaceae x
Antidesma sp. Euphorbiaceae x x Murraya paniculata Rutaceae x
Ardisia korthalsiana Myrsinaceae x Myristica fatua Myristicaceae x
Bauchinia purpurea Fabaceae x Naravelia laurifolia Ranunculaceae x
Bridelia glauca Euphorbiaceae x x Nomaphila stricta Acanthaceae x x
Brucea javanica Simaroubaceae x x Parinari corymbosa Rosaceae x
Buchanania arborescens Anacardiaceae x Picrsma javanica Simaroubaceae x
Canarium pillosum Burseraceae x Pipturus argenteus Urticaceae x
Cansjera leptostachya Opiliaceae x x Pisonia umbellifera Nyctaginaceae x
Celtis wightii Ulmaceae x x Pittosporom muloccanum Pittosporaceae x
Cestrum sp. Solanaceae x Planchonella oxyedra Sapotaceae x
Chromolaena odorata Asteraceae x x Pometia pinnata Sapindaceae x
Cissus javana Vitaceae x Pteridium aquilinum Pteridaceae x
Cissus repens Vitaceae x Pterocarpus indicus Fabaceae x
Claoxylon polot Euphorbiaceae x Pterospermum diversifolium Sterculiaceae x x
Cleidion spiciflorum Euphorbiaceae x Pycnarrhena cauliflora Menispermaceae x x
Cleistanthus myrianthus Euphorbiaceae x x Sapindus saponaria Sapindaceae x x
Dendrocnide stimulans Urticaceae x Saurauia sp. Actinidiaceae x
Dichapetalum timorense Dichapetalaceae x Schefflera elliptica Araliaceae x
Dracaena angustifolia Liliaceae x Schleichera oleosa Sapindaceae x
Dysoxylum gaudichaudianum Meliaceae x Schoutenia ovata Tiliaceae x
Dysoxylum nutans Meliaceae x Solanum erianthum Solanaceae x
Dysoxylum parasiticum Meliaceae x Solanum torvum Solanaceae x
Dysoxylum sp. Meliaceae x Stepania cf. hernandifolia Menispermaceae x
Ficus depressa Moraceae x x Sterculia foetida Sterculiaceae x
Ficus sp.1 Moraceae x Syzygium lineatum Myrtaceae x
Ficus sp.2 Moraceae x Tabernaemontana macrocarpa Apocynaceae x
Garuga floribunda Burseraceae x Tamarindus indica Fabaceae x
Glochidion philippicum Euphorbiaceae x Tinomiscium phytocrenoides Menispermaceae x
Grewia acuminata Tiliaceae x x Toona sureni Meliaceae x
Helicteres isora Sterculiaceae x Uvaria littoralis Annonaceae x
Homalanthus populneus Euphorbiaceae x Vangueria spinosa Rubiaceae x
Hypserpa polyandra Menispermaceae x x Vernonia patula Asteraceae x
Kleinhopia hospita Sterculiaceae x Wrightia sp. Apocynace x x
Knema cinerea Myristicaceae x Zizyphus celtidifolia Rhamnaceae x
trees on the southern part of the island. Pilot afforestation with T. grandis and other species has been attempted since the middle of the 1960s by the Forestry District Office (Forestry Department, Indonesia). The German Agency for Technical Cooperation (GTZ) and various nongovern-mental organizations have also supported land rehabilita-tion through afforestarehabilita-tion in the study area and have planted A. auriculiformis, Acacia sp., Albizia lophantha,
Calliandra calothyrsus, C. siamea, Casuarina equisetifo-lia, Eucalyptus deglupta, Gliricidia sepium, Gmelina arborea, Lannea coromandelica, L. leucocephala,
Paraserianthes falcataria, Swietenia mahagoni, T. gran-dis, and Timonius timon, among others.
The field observations and data sampling were car-ried out in July 2005. We selected three primary forests in the study area, at “km47 Praipaha” in Lewa, at 9°40.670′S, 120°11.336′E (449 m asl) in Leter S and at 9°50.271′S, 120°34.180′E in Kataka, and two savannas, at 9°40.670′S, 120°11.336′E (449 m asl) in Leter S and at 9°40.223′S, 120°28.895′E (21 m asl) in Wannga (Table 1). All sites were in areas with a MAP of about 500 to 1,000 mm12
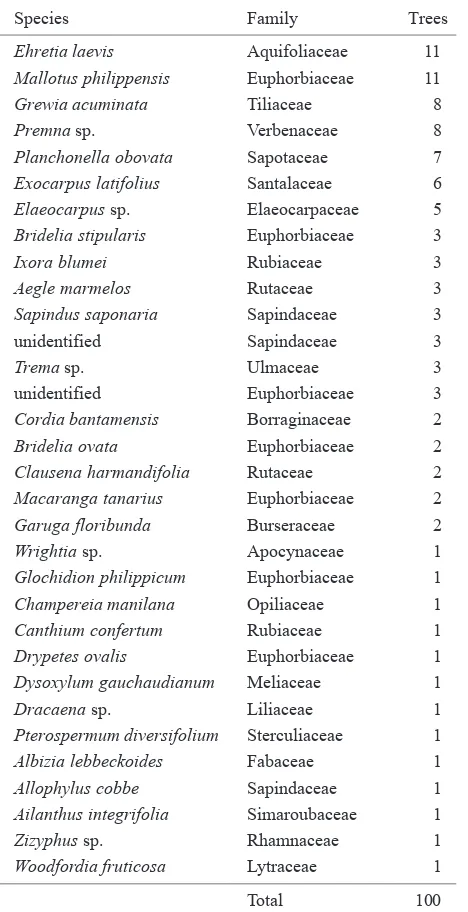
. Tree species were recorded in primary forests in Lewa and Kataka (Table 2), in a random sample of 100 trees > 5 cm in dbh in primary forests in Leter S (Table 3) and in the two savannas (Tables 4 & 5). Dominant grass species were also recorded in the savannas. For planted forests, we selected two plantations of 38-y-old T. grandis, NFS, established by the Forestry District Office at 9°44.199′S, 119°57.257′E (195 m asl, MAP about 1,500 mm) in Lewa and at 9°40.681′S, 120°12.027′E (303 m asl, MAP about 500 mm) in Leter S and one 8-y-old private forest of L. leucocephala, FS, at 9°40.223′S, 120°28.895′E, (21 m asl;
MAP about 500 mm) in Wannga to estimate tree biomass (Table 1). The overstory of the three plantations exhibited nearly complete crown closure. Two circular sample plots (314 m2
) were established in each forest. The dbh and tree species were recorded for trees with dbh ≥ 1 cm in each
Table 3. Tree species composition in a sample of 100 trees > 5 cm in dbh in a primary forest at Leter S on the eastern part of Sumba Island, Indonesia
Species Family Trees
Ehretia laevis Aquifoliaceae 11
Mallotus philippensis Euphorbiaceae 11
Grewia acuminata Tiliaceae 8
Premna sp. Verbenaceae 8
Planchonella obovata Sapotaceae 7
Exocarpus latifolius Santalaceae 6
Elaeocarpus sp. Elaeocarpaceae 5
Bridelia stipularis Euphorbiaceae 3
Ixora blumei Rubiaceae 3
Aegle marmelos Rutaceae 3
Sapindus saponaria Sapindaceae 3
unidentified Sapindaceae 3
Trema sp. Ulmaceae 3
unidentified Euphorbiaceae 3
Cordia bantamensis Borraginaceae 2
Bridelia ovata Euphorbiaceae 2
Clausena harmandifolia Rutaceae 2
Macaranga tanarius Euphorbiaceae 2
Garuga floribunda Burseraceae 2
Wrightia sp. Apocynaceae 1
Glochidion philippicum Euphorbiaceae 1
Champereia manilana Opiliaceae 1
Canthium confertum Rubiaceae 1
Drypetes ovalis Euphorbiaceae 1
Dysoxylum gauchaudianum Meliaceae 1
Dracaena sp. Liliaceae 1
Pterospermum diversifolium Sterculiaceae 1
Albizia lebbeckoides Fabaceae 1
Allophylus cobbe Sapindaceae 1
Ailanthus integrifolia Simaroubaceae 1
Zizyphus sp. Rhamnaceae 1
Woodfordia fruticosa Lytraceae 1
Total 100
Table 4. Tree species composition in a sample of 100 trees > 5 cm in dbh in a savanna at Leter S on the eastern part of Sumba Island, Indonesia
Species Family Trees
Timonius timon Rubiaceae 57
Alstonia spectabilis Apocynaceae 21
Wendlandia paniculata Rubiaceae 10
Buchanania arborescens Anacardiaceae 6
Glochidion littorale Euporbiaceae 3
Albizia procera Fabaceae 2
Alyxia sp. Apocynaceae 1
Total 100
Table 5. Tree species composition in a sample of 100 trees > 5 cm in dbh in a savanna at Wannga on the eastern part of Sumba Island, Indonesia
Species Family Trees
Ficus sp. Moraceae 47
Schleichera oleosa Sapindaceae 40
Bridelia ovata Euphorbiaceae 4
Pittosporum ramiflorum Pittosporaceae 3
Opuntia elatior Cactaceae 2
Morinda tinctoria Rubiaceae 2
Zizyphus jujuba Rhamnaceae 2
plot, and tree and forest biomass were estimated using the dbh values and estimated basic density as inputs for the generic equation for each individual tree biomass estima-tion described in the previous secestima-tion7
. The basic densi-indigenous species was assumed to be 550 kg m–3
, the mean basic wood density for a range of tropical tree species4
.
Results and discussion
1. The central dry zone, Myanmar
Biomass estimates of the planted forests ranged from 6.29 to 27.78 Mg ha–1
. The corresponding mean annual biomass increment (MAI) value averaged 2.60 (± 1.61 SD) Mg ha–1
y–1
, and the MAI of E. camaldulensis (an exotic fast-growing tree species) did not differ signifi-cantly from those of the native non-fast-growing tree spe-cies (Fig. 8). Oo et al.16
estimated biomass MAI values of nine planted E. camaldulensis forests (6- to 11-y-old) in the same region at 1.68 (± 1.01) Mg ha–1 values were not significantly different from the values in the present study. Afforestation may increase the biomass stock of degraded land in a relatively short time period, because the biomass of shrub and grass communities is about 11 Mg ha–1
(including litter)16 .
MAI values appeared to be lower at sites whose soils had a higher gravel content or a higher degree of erosion (Fig. 8). This suggests that erosion may decrease tree growth through increased soil degradation and that MAI values on steep slopes, which usually suffered from severe surface soil erosion, are likely to be much smaller than the rates observed in the present study. An afforestation trial in mountains near the study area began in 1998 with the support of KOICA, and the results of this trial will con-firm whether this hypothesis is correct.
2. The eastern part of Sumba Island, Indonesia
Dominant grasses in the savanna areas were Themeda triandra, Chrysopogon subtilis, Heteropogon contortus,
Pogonatherum crinitum, Sorghum nitidum, Heteropogon insignis, and Sorghum propinquum; and Fimbristylis sp. was also common. We found 32 species in our sample of a primary forest (Table 3), versus only 7 species for both savannas (Tables 4 & 5). Among the species recorded at all three locations, only one species (Bridelia ovata) was found in both the primary forest and a savanna site. This suggests that only a few primary forest species are able to survive under the disturbance regimes that occur at savanna sites.
The biomass of planted T. grandis forest was esti-mated at 142.9 Mg ha–1
, respectively, at these two sites. For the L. leucocephala forest, biomass was estimated at 77.0 Mg ha–1
and MAI was 9.62 Mg ha–1 y–1
. The L. leucocephala forest thus showed higher MAI than the T. grandis forest at the same level of MAP.
3. MAI of planted forests in the Tropical Dry climatic zone
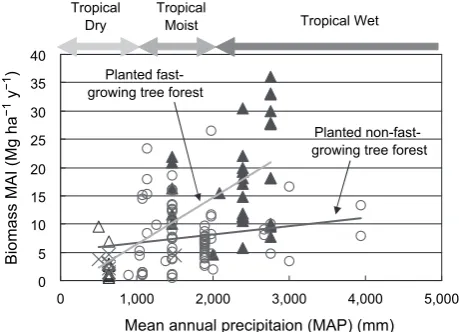
MAI values of the planted trees ranged greatly, between 0.5 and 36.1 Mg ha–1
y–1
(Fig. 9). MAI values also differed significantly between fast-growing and
non-0
Fig. 8. Mean annual increments (MAI) for planted forests in the central dry zone of Myanmar
The stands are either 6- or 8-y-old. Arrows repre-sent plantations growing on soils with a high gravel content or a relatively higher level of erosion.
0
0 1,000 2,000 3,000 4,000 5,000
Mean annual precipitaion (MAP) (mm)
Biomass MAI (Mg ha
−1 y
−1) growing tree forestPlanted
fast-Planted
non-fast-Fig. 9. Relationship between mean annual precipitation (MAP) and mean annual increment (MAI)
Values for forests of fast-growing trees represent data from the Carbon Fixing Forest Management Project (CFFMP) and the literature3,5,9,10,13
( ) and from the present study and the literature16
( ). Values for forests of non-fast-growing trees repre-sent data from CFFMP, the literature3,5,6,9,11,13-15,18-20 ( ), and the present study and the literature16
( ). The three climatic zones were divided according to the guidelines in the IPCC National Greenhouse Gas Inventories Programme4
fast-growing species in the Tropical Moist and Wet cli-matic zones (P < 0.0001), but did not differ significantly between these two groups of species in the Tropical Dry climatic zone (P = 0.999). MAI of fast-growing species increased as MAP increased (P < 0.0001). For non-fast-growing trees, MAI values were significantly smaller in the Tropical Dry climatic zone (P = 0.0022) than in the Tropical Moist and Wet climatic zones. However, MAI values did not show a special tendency in the Tropical Moist and Wet climatic zones. It is reasonable to expect that in areas where growth is limited by water availability, net primary production (NPP) will be positively correlated with MAP. We found studies that investigated this rela-tionship (e.g., Schuur (2003)17
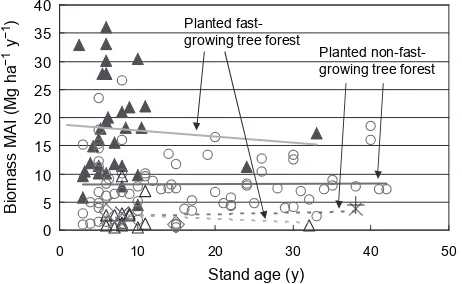
). Since MAI values depend strongly on NPP, the MAI values in the present study may exhibit a similar tendency, although Schuur (2003)17 inferred that NPP values decreased when MAP exceeded about 4,000 mm and we cannot confirm this without addi-tional research on MAI. Stands of fast-growing tree spe-cies older than 10 y were relatively rare in our study area (Fig. 10) because these species are often harvested before they grow older than 10 y. Their growth rate may decrease after about 10 y and therefore, their economic life is short. Non-fast-growing tree species did not show any obvious trend in MAI as a function of stand age. These species are likely to be long-lived and to maintain a somewhat
con-stant MAI for decades. MAI values for fast-growing tree species in the Tropical Dry climatic zone were less than 20% of the values for the Tropical Moist and Wet climatic zones, versus about one-third of the corresponding values for non-fast-growing species. Accordingly, the fast-grow-ing tree species may not exhibit fast growth in the Tropical Dry climate.
Because MAI values varied widely among the stands (Figs. 9 & 10), we must remember the possibility that a given stand’s MAI may differ greatly from the norms for a species. The causes of such deviations include differ-ences in species, genetics, climate, soils, human interven-tions (e.g., forestry practices), diseases, and sampling error in measurements. Ways to reduce these estimation uncertainties will require further examination in future research.
Conclusions
The research described in this paper provided MAI values for planted forests in the Tropical Dry climatic zone. The productivity of the planted forests was much lower than that in locations with higher MAP. Such infor-mation was rare before the present study, and the new data will thus be useful in developing land-use programs based on plantation forestry in dry forest areas. The need to ensure the provision of a similar amount of goods and ser-vices to that offered to people before the afforestation and the need to avoid negative social impacts of afforestation will also require further research to provide improved data and to identify suitable technologies for such projects, as well as to ensure their judicious use (i.e., using the meth-ods appropriately) in integrated land-use planning.
Acknowledgments
This study was conducted as part of a project funded by the Forestry Agency of Japan, “Forestation: basic data collection aiming at small scale afforestation/reforestation CDM in environmental planting” and with financial sup-port from the Japan Society for the Promotion of Science Funds affiliated with the Ministry of Education, Culture, Sports, Science and Technology, Japan. Our special thanks are due to the Forest Department of Myanmar for their acceptance of our field study in Myanmar, to Professor Cecep Kusmana (dean of the Faculty of Forestry, Bogor Agricultural University) for sponsoring our research in Indonesia, and to the LIFE (Live with friends on the Earth) nonprofit organization and Mitra Bina Daya (a nongovernmental organization in Indonesia) for their help during our activities on Sumba Island.
0
Fig. 10. Relationship between stand age and MAI (Kiyono et al.7
, revised)
Values for forests of fast-growing trees represent data from the Carbon Fixing Forest Management Project (CFFMP) and the literature3,5,9,10,13
in the Tropical Moist and Wet climatic zones ( ) and from the present study and the literature16
in the Tropical Dry climatic zone ( ). Values for forests of non-fast-growing trees represent data from CFFMP and the literature3,5,6,9,11,13-15,19,20 ( ) and the present study ( ) in the Tropical Moist and Wet climatic zones and from the literature18 ( ) and the present study and the literature16