Procedia Engineering 00 (2013) 000–000
The Malaysian International Tribology Conference 2013, MITC2013
Overall Equipment Efficiency Improvement Using Time Study In
An Aerospace Industry
A.
P. Puvanasvaran, C. Z. Mei, V. A. Alagendran
Universiti Teknikal Malaysia Melaka (UTeM), Ayer Keroh, 75450 Melaka, Malaysia
Abstract
This paper highlights a methodology used to improve the Overall Equipment Efficiency (OEE) of the autoclave process through the implementation of time studies. In this paper, two types of time study are employed where the initial time study conducted was the direct stopwatch time study used to validate the current OEE standard. Maynard’s Operation Sequencing Technique (MOST) is then adopted to conduct the secondary time study. MOST study revealed the significant value added and non-value added activities at each sub process which conclude to the standard prior to improvement steps. In the final stage, MOST is used once again to evaluate the percentage of improvement contributed to the OEE. The major findings of this paper is that the significant problem in computing the OEE is the inaccuracy of the data used and the lack of a medium to evaluate the improvement ideas before it is implemented. MOST is an effective method to evaluate and show the gain from the improvement ideas proposed without investing in costly implementations. The limitation of this study is mainly concerned with the direct stopwatch time study performed during the initial stage as it might varies from one person to another. The other concern is that the operation steps performed might be different from one labor to another which might contribute to the variation of the time studies performed. A MOST methodology is adapted to identify the value added and non-value added activities. The use of MOST encompassed the overall study from the time study step until the evaluation of final outcome.
Keywords: MOST( Maynard’s Operation Sequencing Technique), Time Study, (OEE) Overall Equipment Efficiency
1.Introduction
In the conduct of this study, it is identified that the significant issue in the operations of the autoclave process is pertained to the excessively long setup time which deduced to the unsatisfactory OEE. The world class standard of OEE as stated by Frost and Sullivan (2005) is at 85 % derived from the three OEE factors with Availability (90%), Performance (95 %) and Quality (99%). However, based on the OEE rating claimed by the research company it is impossible to be able to meet the actual demand. Based on the initial observation conducted, it is found that the actual setup time required is actually much longer than the setup time claimed by the production. There are a few possible causes of this condition such as:
(a)
Data used to calculate OEE not based on real time study(b)
Work scheduling problems(c)
The 6 big losses of OEE are not define and measured accuratelyReal time data is important especially when accounting for the time losses and it is apparent that the successful computation of OEE depends on the ability to collect data. If the data collected are unreliable, the OEE value computed may not reflect real equipment utilization. It is also important to recognize that each loss classified corresponds to an equipment state. For example, if the interest is in the scheduled maintenance time for a machine, the data must be collected when the machine is in a state of scheduled maintenance. In computing OEE, each company may require different equipment states due to the level of accuracy and their data collection ability (Ki and Philip, 2001).
estimation technique MOST.
This paper is will discuss the topics related to time study ,OEE and other relevant topics in section two through the literature review conducted. The time study is conducted in an aerospace manufacturing company for a period of 6 months to obtain the necessary cycle time and labour working time. The methodology is discussed in Section 3 includes the methodology to validate the current performance, time study implementation, data analysis and results evaluation. The results of implementation are shown in the following section followed by a conclusion in the final section.
2.Literature Review
2.1 Time study techniques
Motion and time study aim to eliminate unnecessary work and design the most effective methods and procedures while providing methods of measuring work for determining a performance index for an individual or group of workers, department or entire plant.
Motion and time study as stated by Barnes (1980) consists of four parts, where the two main parts are:
(a)
Motion study or work methods design—to find the preferred method of conducting work.(b)
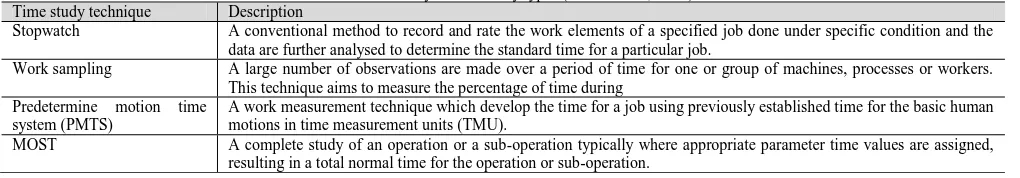
Time study or work measurement— to obtain the standard time to perform a specific task.Table 1: Summary of time study types (Thakre et al., 2009) Time study technique Description
Stopwatch A conventional method to record and rate the work elements of a specified job done under specific condition and the data are further analysed to determine the standard time for a particular job.
Work sampling A large number of observations are made over a period of time for one or group of machines, processes or workers. This technique aims to measure the percentage of time during
Predetermine motion time system (PMTS)
A work measurement technique which develop the time for a job using previously established time for the basic human motions in time measurement units (TMU).
MOST A complete study of an operation or a sub-operation typically where appropriate parameter time values are assigned, resulting in a total normal time for the operation or sub-operation.
2.2 Maynard’s Operation Sequencing Technique Methodology
In the implementation of the MOST system there are five steps procedure used to develop the normal time of the operation based on Rabie (2000) as follow:
(a) Observe and document the methods of operation
(b) Break down the sub-operation into logical activities
(c) Select the appropriate sequence model for each activity
(d) Select the appropriate ‘indices values’ for the parameters of the models, including their repetitions
(e) Synthesis the normal time of the operation
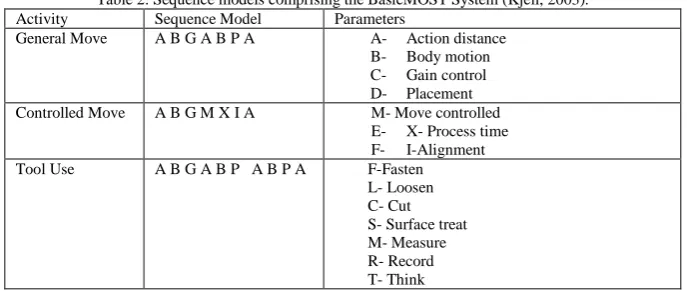
Three activity sequences are needed in MOST for describing manual work.
(a) The general move sequence model is used for spatial movement of an object freely through air
(b) The controlled move sequence model is sued for the movement of an object when
it remains in contact with a surface or is attached to another object during the movement.
(c) The tool used sequence model is used for the use of common hand tools.
Table 2: Sequence models comprising the BasicMOST System (Kjell, 2003). Activity Sequence Model Parameters
General Move A B G A B P A A- Action distance observation depending on duration and frequency of occurrence, in order to get a reliable sample. Furthermore, time study requires additional time to subjectively break down the method into steps, to conduct performance rating and to relate method descriptions to times. MOST uses clearly defined and easily understood rules, and eliminates the subjective aspects or time study. Therefore, the time required to review a MOST analysis with an operator, supervisor and/or union representative is much shorter. The difference between time study and MOST is that time study is used as a direct measurement tool and MOST as a tool for developing standard data, the application time for creating complete engineered standards is significantly shorter using MOST. MOST is at least five times faster than conventional time study.
2.3 Overall Equipment Efficiency(OEE)
OEE is a measurement method that is commonly used by companies on their way towards a Lean production where in specified it is a percentage number that is usually defined by multiplying the calculated availability rate, performance rate and quality rate. It is a measure of how well equipment of lines are utilizes in relation to their full potential. The main objective to measure OEE is to make constraint or bottleneck equipment run more effectively. OEE and its individual factors will give the plant numbers to see where the equipment is losing time (Hogfeldt, 2005).
Successful computation of OEE requires reliable data which reflects the real equipment utilization Based on the utilization estimated, managers can identify the causes of the time losses and attempt to reduce these losses (Ki and Philip, 2001).
OEE is the product of three percentage factors: availability, performance efficiency and quality rate. Equation 4 shows the calculations for OEE as defined by Frost and Sullivan (2005).
Availability = Actual Production Time Setup/Adjustments which is the downtime that is measured at the equipment. As shown in equation 1 above, availability is calculated by dividing actual production time by planned production time.
(b)
PerformancePerformance efficiency takes into account the unrecorded downtime which is the 3rd and 4th of the 6 Big Losses. The ideal cycle time is needed to calculate the performance efficient where it is multiplied with the total parts produced divided by the actual operating time.
(c)
QualityThe quality rate captures the last two of the 6 Big Losses; time lost due to the rejected parts during production and the losses from initial start-up to process stabilization. The quality rate is calculated by dividing the good parts that meet the quality definition the first time.
Equation (1)
Equation (2)
Equation (3)
3.Methodology
3.1 Process identification and verification
In the verification stage, an all through observation is conducted to identify the processes and steps involved in the autoclave curing process. Prior to the time study, the observation is done before dividing the operation into elements. The implementation steps taken to verify the operation and identify the processing steps are:
Step 1: Observe the entire operation for a few cycles and identify the process flow
Step 2: Divide the curing operation into elements and record a complete description of the method Step 3: Observe and record the time taken by the operator
Step 4: Determine the time standard for the operation Step 5: Develop the arrow diagram
Step 6: Develop the work combination Table
3.2 Data collection
The time study is conducted on the entire autoclave curing operation to obtain real time data in order to first validate the actual overall equipment efficiency. There are three types of the time study performed:
(a)
Equipment/Machine Time StudyReal time data were obtained from the Autoclave machine’s real time monitoring system database. The data are extracted from the system and recorded into the time study sheets.
(b)
Labour Time Study using direct stopwatchA digital stopwatch is used to obtain the time required for the operator to perform each and every job elements. The time taken is recorded in the time study sheets.
(c)
Labour Time Study using predetermine motion time studyMaynard Operation Sequencing Technique is employed to perform a time study on the operator’s job. A customized template is used to develop the man machine optimization ratio (MMO).
3.3 Data analysis
As stated by Hamlin (1978) is that before any improvement can be made, it is essential that the present status be known. Two stages of data analysis are conducted for the current state analysis where first MOST technique is used to analyse and identify the value added and non-value added activities of the operation. Followed on, a work element analysis is conducted to show the cause and effect of the problem for the setup process. Data analysis is a vital step to be done as it classifies the problems before any improvements are done as stated by Puvanasvaran et al., (2010) where in a performance measurement conducted without classification of wastage, problem solving cannot be done.
3.4 Improvement of setup operation
The improvements are focused on the setup process as it is the area with significant problems associated with the unsatisfactory OEE percentage. There are three improvement phases carried out in this study which is the conversion of internal setup into external setup, motion waste analysis, and line balancing using network diagram. A SMED methodology is adapted based on Ulutas (2011), where some of the internal setup is converted into external setup. In the motion waste analysis, the steps with excessive motion waste are identified through MOST analysis. In the analysis, steps with high index parameters are identified through MOST as Thakre (2009) has stated that the parameters with higher index values represents a higher probability of non-value added activities. A network diagram for the setup process is developed based on the PERT/CPM Analysis where the critical path and critical time are identified to balance the activities sequence of the setup process.
3.5 Results evaluation
4.Results
4.1 Standardized work
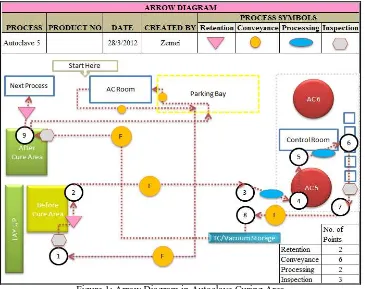
The entire autoclave curing process was observed for a few cycles where the process flow and work elements are identified. Figure 1 below shows the arrow diagram developed to show the movements of the operators performing their work cycle. There are a total of 8 workstations; the AC Room, After Cure Area, Before Cure Area, AC5, AC Control Room, TC/Vacuum Storage Area, Parking Bay and Information Board.
Figure 1: Arrow Diagram in Autoclave Curing Area
The arrow diagram shows the total number of retention, conveyance, and processing and inspection station in the production floor. Through this diagram, the sequence of jobs performed by the operators can be seen clearly. The total manual working time obtained is 179.54 minutes, automated machine time is 51.60 minutes and walking time is 52.20 minutes. Based on the standardised work sheet, the operators had to wait for the curing cycle to complete before carrying on his job cycle.
4.2 Validation of OEE through time study
The OEE of Company ABC is validated first to know where their standard are through the time study conducted. Figure 2 below shows the graph of comparison between the overall equipment efficiency claimed by Company ABC and the actual OEE obtained through time study.
The result of the time study validated the actual overall equipment efficiency where the actual OEE are found to be lower than the OEE claimed. The biggest difference between the claimed OEE and actual OEE is seen for the month of September 2011 with a 7.58 % difference. Overall the actual OEEs are found to be lesser than claimed by the company. The result obtained lead to a conclusion that the three OEE ratios which are the availability, performance and quality ratio are not defined accurately.
4.3 Current state analysis
A customized MOST templates are used to analyse the current state condition of the autoclave process using the data obtained from the time study performed. From the MOST analysis, the total operation time per lot and man machine optimization ratio is obtained. In the existing operation floor, the work forces are shared between Autoclave 5 and Autoclave 6 machine where 2 operators are handling 2 machines. The initial operation time per lot is 13.83 hours and the MMO ratio is 1 operator to 1.4 autoclave machines.
4.4 Improvements
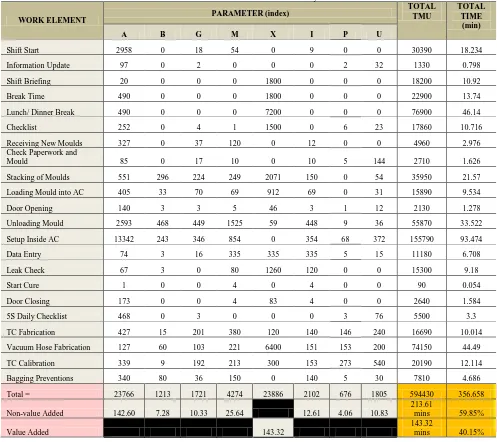
Work sequence of the operators analysed according to the predetermined parameter index are shown in Table 1 which summarise the index parameters for the setup process. The index parameters are total up in time measurement units (TMU). As obtained from MOST, high index parameter indicates high motion wastes in the process. It can be seen that the highest index parameter is found to be of A (Action Distance) which are mainly due to the walking distances during the setup process.
From the observations of the motion work of the operators, the high action distances are actually due to the highly repetitive trial and error setup operation. The operators who were performing the setup of thermocouples and vacuum hoses repeatedly walk back and forth from the inside of the autoclave machine to the control panel to check on the status of the thermocouples and vacuum hoses. Excessive motion waste was also observed during the setup where the operators need to travel long walking distances to obtain thermocouples and vacuum hoses. Thus, to reduce the amount of unnecessary motion waste a specialized changeover cart is used. Consecutively with the conversion of internal setup to external setup, this cart is used to carry all necessary tools and materials needed for the setup operation. A handheld receiver is used during the leak check. Hence, during the leak check the operators need not to walk in and out of the autoclave machine to the control panel to observe the readings. One operator can monitor the readings of the leak check while the other will remove and replace the malfunction thermocouples and vacuum hoses.
The current setup process involves all internal setups. Thus, the setup process is broken down into work elements based on the time study data from MOST and then separated into internal and external setup accordingly.
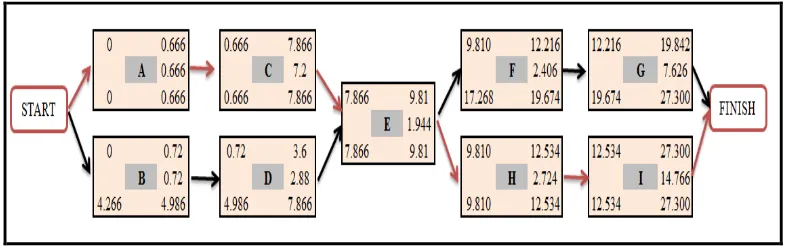
Figure 4: Critical path of the setup process
A PERT/CPM analysis is conducted to balancing the steps of setup process as shown in figure 4. From the network diagram, the critical path is shown in red arrows which are A-C-E-H-I path with a critical time of 27.30 minutes. Thus, through the usage of network diagram the activities in the setup process can be balanced and arranged according to its predecessors.Initially the completion time of setup process is 93.49 minutes as the activities are done independently. However, through external setup conversion and excessive motion waste elimination the net time required to complete the setup process improved to a total of 40.932 minutes.
4.5 Future state analysis
The effectiveness of the proposed improvements are measured in time measurement units (TMU) using a secondary MOST time study. The improvements in terms of time units are then used to evaluate the percentage of improvements in the OEE of the autoclave curing process.
MOST is used to evaluate the percentage of improvements that will result from the proposed steps as it is accurate enough as stated by Thakre et al., (2009) where he stated that the result does not deviate from analyst to analyst as the standard calculation sheet with standard motion sequence and index values are available. The results of improvements proposed are evaluated using MOST as it is an economical predetermined motion time system where its main functions are to accomplish planning, determine performance and establish cost ( Kjell, 2003). This way the improvements evaluation can be done economically without incurring any implementation cost.
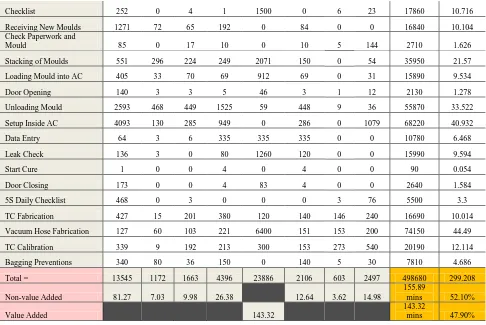
Table 2: Future State Index Parameter Analysis
WORK ELEMENT PARAMETER (index)
TMU TIME
(min)
A B G M X I P U
Shift Start 983 0 3 9 0 9 0 0 10040 6.024
Information Update 97 0 2 0 0 0 2 32 1330 0.798
Shift Briefing 20 0 0 0 1800 0 0 0 18200 10.92
Break Time 490 0 0 0 1800 0 0 0 22900 13.74
Checklist 252 0 4 1 1500 0 6 23 17860 10.716
The future state of the entire operation is shown in Table 2. This analysis is based on the previous current state analysis which has identified the area of high parameter index value. The results of suggested improvements steps are evaluated here in Table 3 showing the improved results. From the evaluation, it is seen that the total non-value added reduced from 213.34 minutes to 155.89 minutes with a total of 7.72 % difference. The significant changes are summarized in Table 3 below.
Table 3: Summary of the results improvements reflected in the overall equipment efficiency of the autoclave curing process. The significant changes are observed at the setup time during the setup inside the autoclave machine where operators have to perform setup of thermocouples and vacuum hoses. The average setup time for the month of February 2012 is 94.82 minutes; where else the newly improved setup time is 40.93 minutes. Thus, the new setup time is assume as the new average setup time and is used to generate the new OEE. The OEE percentage on the month of February 2012 is used to evaluate the improvement results.
Table 4: Summary of OEE improvements
Period Availability Performance Quality OEE
Before 84.62 % 99.64 % 100 % 84.32 %
After 89.26 % 99.64 % 100 % 88.94 %
are on the output produced. The increase in the availability ratio is mainly due to higher operating time which directly contributes to the increase in the OEE percentage from 84.32 % to 88.94 %.
5.Conclusion
The most significant findings of this paper is that MOST time study can be applied to determine the VA and NVA associated with the work elements rather than the normal graphical display of results. Through MOST, the percentage of improvements to each step can also be quantified accurately based on the predetermine motion time standard. This paper also shows a methodical step to apply time study technique to improve the Overall Equipment Efficiency. MOST is found to be useful in streamlines of operations in order to indentify inefficient methods in the work performed. It is reliable as it provides consistent standards and accuracy to within ± 5% with a 95 % confidence level. MOST not only can be applied in an aerospace industry, it is also applicable in other industry that involves method-defined manual work performed by human workers as the motion index parameters are based on human motion standards. Through MOST, the time required for data development and standard setting is significantly reduced. The limitation of this study is the scheduling between the two autoclave machines which share their work force. The scheduling was only conducted within one autoclave machine due to the constraints of this study. Further study in this paper may include the scheduling of operations between both machines that shares resource to further reduce the lead time.
Acknowledgements
The author would like to acknowledge the Ministry of Science, Technology and Innovation (MOSTI) for the project granted for this study: PROJECT NO.: 06-01-14-SF0046
References
[1] A.P. Puvanasvaran, Megat, H., Tang, S.H., Razali, M.M. and Magid, H.A. (2010). Lean process management implementation through enhanced problem solving capabilities. Journal of Industrial Engineering and Management, 3(3), pp. 447-493.
[2] Barnes, R. (1980). Motion and Time Study Design and Measurement of Work (7th ed.). United States: John Wiley & Sons. Inc.
[3] Frost & Sullivan’s Industrial Automation Practice (2005). Improving Plant Performance: Overall Equipment Effectiveness (OEE). A White Paper.
[4] Hamlin (1978). Productivity Improvement: An organized effort. Proceedings of the AIIE Annual Spring Conference.
[5] Hogfeldt, D. (2005). Plant efficiency: A value stream mapping and overall equipment effectiveness study. Lulea University of Technology.
[6] Kjell, B.Z. (2003). MOST: Work Measurement Systems (3rd ed.). United States: CRC Press.
[7] Ki, Y.J and Phillips, D.T. (2001).Operational efficiency and effectiveness measurement. International Journal of Operations & Production Management, 21( 11), pp. 1404-1416.
[8] Rabie, A. (2000). A case Study: Application of BasicMOST in a Lock’s Assembly, James Madison University Harrisonburg.
[9] Thakre, A.R., Jolhe, D.A. & Gawande, A.C. (2009). Minimization of engine assembly time by elimination of unproductive activities through ‘MOST’. Second international conference on emerging trends in engineering and technology (ICETET).