i
EXPERIMENTAL INVESTIGATION OF BAMBOO-FILLED ALUMINIUM TUBE SUBJECTED TO QUASI-STATIC LOADING
JOSEPH TIONG KING ING
This report is implemented as to fulfill the requirement of the title of Bachelor in Mechanical Engineering (Structure and Materials)
FACULTY OF MECHANICAL ENGINEERING UNIVERSITI TEKNIKAL MALAYSIA MELAKA
ii
PAGE OF CONFESSION
“I admitted that this report is the work of my own except each summary and extraction which I had explained its sourse.”
Signature : ...
Writer‟s Name : ………..
iii
ACKNOWLEDGEMENT
First of all, I all would like to express our deeply thankfulness to God because I manage to finish this “Projek Sarjana Muda 2” (PSM 2) report on time and could submit it to fulfill the requirements of the subject of “Projek Sarjana Muda 2” (BMCU 4983).
Besides that I also like to state my gratitude to everyone who has assisted and guided me in producing this report especially to my beloved Supervisor, Prof Dr. Md Radzai Bin Said. He had advices me how to carry out the study on “Experimental Investigation of Bamboo-Filled Aluminium Tube Subjected to Quasi-Static Loading”.
Besides that, I would also like to share my gratitude to the Laboratory‟s technician, Mr. Faizol Bin Kamarul Zahari and Mr. WanSaharizal Bin Wan Harun. They were willing to arrange a time for me to perform any experimental test
Finally I also like to express my gratitude to any other individuals or group who I have not mentions that has also played an important role in my PSM 2 report. I hope that my PSM 2 report will fulfill the conditions as requested in “Projek
iv
ABSTRACT
The research involved experimental works of axial compression of aluminium hollow square tube and bamboo-filled under quasi-static loading condition. The main purpose of the research is to compare the energy absorption between hollow tube and bamboo-filled tube. Initially, related journals and articles were obtained through any resources. Total of eighteen specimens of aluminium with different cross-section dimension were cut off with 300mm in length (9 specimens) and 150mm (9 specimens). The cut area is ensured flat and perpendicular to the length of the tube. Bamboo specimens are all oven-dry. After bamboo specimens had been oven-dry, it is cut into slides. Six specimens with length of 150mm are filled in with slides bamboo. All the specimens (empty tube and bamboo-filled tube) were then subjected to compression load by using INSTRON Universal Testing Mesin Model 5585. The rate of compression is 10mm per minute. Throughout the compression period, photos are taken with every
v
ABSTRAK
Tajuk penelitian eksperimental melibatkan mampatan axial pembebanan kuasi-statik balang aluminium persegi berongga dan buluh diisi. Tujuan utama penelitian ini adalah untuk membandingkan penyerapan tenaga antara balang hampa dan balang buluh diisi. Pada permulaaan, jurnal dan artikel yang berkaitan diperolehi melalui sumber maklumat. Lapan belas spesimen dari aluminium dengan dimensi penampang yang berbeza dipotong dengan panjang 300mm (9 spesimen), dan 150mm (9 spesimen). Kawasan memotong dipastikan datar dan bersudut tegak terhadap panjang balang. Semua buluh spesimen dioven-keringkan. Setelah spesimen buluh telah dioven-keringkan, buluh tersebut dipotong. Seterusnya, enam spesimen dengan panjang 150mm diisikan dengan buluh yang telah dipotong. Kemudiannya, semua spesimen (balang kosong dan balang berisi buluh) mengalami mampatan pada mesin mampatan Instron Universal Testing Mesin Model 5585.
vi
TABLE OF CONENT
CHAPTER CONTENT PAGE
TITLE i
CONFESSION ii
ACKNOWLEDGEMENT iii
ABSTRACT iv
ABSTRAK v
TABLE OF CONTENT vi
LIST OF TABLE ix
LIST OF FIGURE x
LIST OF SYMBOL xviii
CHAPTER 1 INTRODUCTION 1
1.1 Background 1.2 Objective 1.3 Scope
1.4 Problem Statement 1.5 Project Methodology
1 5 5 6 6
CHAPTER 2 LITERATURE REVIEW 7
2.1 Energy Absorption 2.1.1 Quasi-Static Loading 2.1.2 Dynamic Loading 2.1.3 Oblique Loading
vii
CHAPTER CONTENT PAGE
2.2 Test Specimen Shape (Structural Shape)
2.2.1 Circular Tube 2.2.2 Square Tube
2.2.3 Frusta
2.3 Mode of Deformation 2.4 Bamboo
2.4.1 The Stem of Bamboo 2.4.2 Branch of Bamboo
2.4.3 Bamboo‟s Moisture Content 2.4.4 Bamboo‟s Dry Density 2.4.5 Bamboo‟s Shrinkage
14 14 17 18 20 22 23 24 25 25 26
CHAPTER 3 EXPERIMENTAL DEVELOPMENT 27 3.1 Preparation of Specimen
3.1.1 Empty Square-shape Tube 3.1.2 Bamboo Specimen
3.2 Quasi-Static Loading 3.2.1 Empty Square Tube
3.2.2 Bamboo-Filled Square Tube 3.2.3 Load-Displacement Curve
27 27 28 29 29 30 31
CHAPTER 4 EXPERIMENTAL RESULTS AND DISCUSSION
32
4.1 Experimental Observation 4.2 Bamboo
4.3 The Length of Bamboo-Filled Aluminium Tube.
4.4 Fold Formation Process, Load-Displacement Curves and Crush Characteristic.
32 61 61
viii
CHAPTER CONTENT PAGE
4.5 Energy Absorption Capability
4.5.1 Hollow Tube. 4.5.2 Bamboo
4.5.3 Bamboo-Filled Tube
63
64 65
65
CHAPTER 5 CONCLUSION AND RECOMMENDATION 67 5.1 Conclusion
5.2 Recommendation
67 68
REFERENCE 69
APPENDIX
Appendix A : Aluminium Square Tube Cross Section with Length= 300mm. Appendix B : Aluminium Square Tube Cross
Section with Length = 150mm. Appendix C : Flow Chart of PSM 1 (PSM 2)
Activities.
Appendix D : Grant Chart of Activities Carry Out in PSM 2
72 72
73
74
ix
LIST OF TABLE
TABLE TITLE PAGE
4.1 Summary of Solid Bamboo Specimen Property 55
4.2 Summary of The Result For Hollow Aluminium Square Tube.
(t=1.5mm, L=300mm)
56
4.3 Summary of the Result for Hollow Aluminium
Square Tube ( =100mm)
57
4.4 Summary of the Result of Density For Bamboo-Filled Aluminium Square Tube
(L=150mm)
58
4.5 Summary of the Comparison Results For Both Empty and Bamboo-Filled Aluminium Square Tube (L= 150mm)
59
4.6 Summary of the Comparison Results For Both
Empty and Bamboo-Filled Aluminium Square Tube (L= 150mm and =13mm)
x
LIST OF FIGURE
FIGURE TITLE PAGE
1.1 Symmetric axial crush response mode – ductile metallic alloy, square box component: (a) axial crush and undeformed tube specimens, (b) curve sections and (c) crush characteristics.
(Source: Dipaolo and Tom, 2006)
3
1.2 Configuration A response – prototype specimen S1-18: fold formation and load–displacement curve.
(Source: Dipaolo and Tom, 2006)
4
2.1 Test Specimen Geometry and Support Conditions (Source: Tarigopula et al., 2006)
9
2.2 Oblique Loading of Column (Source: Reyes et al., 2003)
12
2.3 Test Rig
(Source: Reyes et al., 2003)
12
2.4 Deformation Modes of Oblique Loading (Source: Reyes, et al., 2003)
xi
FIGURE TITLE PAGE
2.5 Sample Specimen‟s Deformation of Oblique
Loading
(Source: Reyes et al., 2003)
13
2.6 Typical load–detection curve for an axially loaded thin-walled metal tube which collapsed by progressive folding.
(Source: Guillowa et al., 2001)
14
2.7 Schematic axial view of non-symmetric or diamond collapse mode. Two cases are shown, N = 3 and4 circumferential lobes.
(Source: Guillowa et al., 2001)
15
2.8 Axi-symmetric collapse mechanism assumed by Alexander
(Source: Guillowa et al., 2001)
15
2.9 Axi-symmetric model used by Abramowicz and Jones.
(Source: Guillowa et al., 2001)
16
2.10 Tube Deformation Response Mode (Source: Dipaolo and Tom, 2006)
17
2.11 (a) Geometrical details of specimen and (b) specimens before test.
(Source: Gupta et al., 2006)
19
2.12 Load-Deformation Curve For Frusta (Source: Gupta et al., 2006)
xii
FIGURE TITLE PAGE
2.13 Axisymmetric concertina mode and Cut view of concertina mode.
(Source: Pled et al., 2007)
21
2.14 Diamond 3 lobe mode and Bottom view of diamond mode
(Source: Pled et al., 2007)
21
2.15 The structural of Bamboo (Source: Wong, K. M., (2004)
23
2.16 Bamboo‟s Branch Complements: (A) many branches from many individual primary buds, (B) many slender branches from a single primary bud, (C) dominant primary branch and smaller branches proliferating from its base, (D) pair of unequal main branches from one primary bud, and (E) three subequal main branches arising together.
(Source: Wong, K. M., 2004)
24
3.1 Quasi-Static Axial Crush: (a) Square Tube Geometry (L=300mm) and (b) Square Tube Geometry (L=150mm)
29
3.2 Instron Universal Testing Machine 31
4.1 Final Permanent Fold Formation of specimen (a) 1A-1C, (b) 2A-2C, (c) 3A-3C; and (d) 1D, 2D, and 3D.
xiii
FIGURE TITLE PAGE
4.2 Final Permanent Fold Formation of bamboo filled specimen (a) 1i-1ii, (b) 2i-2ii, and (c) 3i-3ii.
33
4.3 Fold Formation and Load-Displacement Curve of Hollow specimen
(a) 1A, (b) 2C, and (c) 3C with L=300mm.
34
4.4 Fold Formation and Load-Displacement Curve of Bamboo-Filled specimen (a) 1D, (b) 2D, and (c) 3D with L=150mm.
35
4.5 Fold Formation of Tube 1A (38X38mm) with L=300mm in Load-Displacement Curve Under Quasi-Static Loading.
36
4.6 Deforming Mode For Tube 1A Under Quasi-Static Loading.
36
4.7 Fold Formation of Tube 2C (44.5X44.5mm) with L=300mm in Load-Displacement Curve Under
Quasi-Static Loading.
37
4.8 Deforming Mode For Tube 2C Under Quasi-Static Loading.
37
4.9 Fold Formation of Tube 3C (51X51mm) with L=300mm in Load-Displacement Curve Under Quasi-Static Loading.
38
4.10 Deforming Mode For Tube 3C Under Quasi-Static Loading.
xiv
FIGURE TITLE PAGE
4.11 Fold Formation of Tube 1D (38X38mm) with L= 150mm in Load-Displacement Curve Under
Quasi-Static Loading.
39
4.12 Deforming Mode For Tube 1D Under Quasi-Static Loading.
39
4.13 Fold Formation of Tube 2D (44.5X44.5mm) with L= 150mm in Load-Displacement Curve Under Quasi-Static Loading.
40
4.14 Deforming Mode For Tube 2D Under Quasi-Static Loading.
40
4.15 Fold Formation of Tube 3D (51X51mm) with L= 150mm in Load-Displacement Curve Under Quasi-Static Loading.
41
4.16 Deforming Mode For Tube 3D Under Quasi-Static Loading.
41
4.17 Fold Formation of Bamboo Ax (with L= 300mm) in Load-Displacement Curve Under Quasi-Static Loading.
42
4.18 Deforming Mode For Bamboo Ax Under Quasi-Static Loading.
42
4.19 Load-Displacement Curve for Bamboo-filled Square Tubes 1a (38X38mm) with L=150mm.
xv
FIGURE TITLE PAGE
4.20 Deforming Mode For Bamboo-Filled Square Tube 1a Under Quasi-Static Loading.
43
4.21 Load-Displacement Curve for Bamboo-Filled Square Tubes 1b (38X38mm) with L=150mm.
44
4.22 Deforming Mode For Bamboo-Filled Square Tube 1b Under Quasi-Static Loading.
44
4.23 Load-Displacement Curve for Bamboo-Filled Square Tubes 2a (44.5X44.5mm) with L=150mm.
45
4.24 Deforming Mode For Bamboo-Filled Square Tube 2a Under Quasi-Static Loading.
45
4.25 Load-Displacement Curve for Bamboo-Filled Square Tubes 2b (44.5X44.5mm) with L=150mm.
46
4.26 Deforming Mode For Bamboo-Filled Square Tube 2b Under Quasi-Static Loading.
46
4.27 Load-Displacement Curve for Bamboo-Filled Square Tubes 3a (51.0X51.0mm) with L=150mm.
47
4.28 Deforming Mode For Bamboo-Filled Square Tube 3a Under Quasi-Static Loading.
47
4.29 Load-Displacement Curve for Bamboo-Filled Square Tubes 3b (51.0X51.0mm) with L=150mm.
xvi
FIGURE TITLE PAGE
4.30 Deforming Mode For Bamboo-Filled Square Tube 3b Under Quasi-Static Loading.
48
4.31 Comparison of Load-Displacement Curve of All Empty Tube Specimen 1 with constant length, 38mm X 38mm cross-section, thickness 1.5mm, and compression displacement of 220mm.
49
4.32 Comparison of Load-Displacement Curve of All Empty Tube Specimen 1 with constant length, 44.5mm X 44.5mm cross-section, thickness 1.5mm, and compression displacement of 220mm.
49
4.33 Comparison of Load-Displacement Curve of All Empty Tube Specimen 1 with constant length, 51mm X 51mm cross-section, thickness 1.5mm, and compression displacement of 220mm.
50
4.34 Comparison of Load-Displacement Curve for All Empty Tube Specimen 1 with 38mm X 38mm
cross-section, thickness 1.5mm corresponding to compression displacement of 100mm.
50
4.35 Comparison of Load-Displacement Curve of All Empty Tube Specimen 2 of 44.5 mm X 44.5 mm with thickness 1.5 mm corresponding to compression displacement of 100mm.
xvii
FIGURE TITLE PAGE
4.36 Comparison of Load-Displacement Curve of All Empty Tube Specimen 3 of 51 mm X 51 mm with
thickness 1.5 mm corresponding to compression displacement of 100mm.
51
4.37 Comparison of Load-Displacement Curve of Empty Tube (1D) and Bamboo-Filled Tubes (1a and 1b) with Cross-section 38 mm X 38 mm.
52
4.38 Comparison of Load-Displacement Curve of Empty Tube (2D) and Bamboo-Filled Tubes (2a and 2b) with Cross-section 44.5 mm X 44.5 mm.
52
4.39 Comparison of Load-Displacement Curve of Empty Tube (3D) and Bamboo-Filled Tubes (3a and 3b) with Cross-section 51 mm X 51 mm.
53
4.40 Comparison of Load-Displacement Curve of Empty Tube (1D) and Bamboo-Filled Tubes (1a and 1b) with Cross-section 38 mm X 38 mm and
compression displacement of 13mm.
53
4.41 Comparison of Load-Displacement Curve of Empty Tube (2D) and Bamboo-Filled Tubes (2a and 2b) with Cross-section 44.5 mm X 44.5 mm and compression displacement of 13mm.
54
4.42 Comparison of Load-Displacement Curve of Empty Tube (3D) and Bamboo-Filled Tubes (3a and 3b) with Cross-section 51 mm X 51 mm and compression displacement of 13mm.
xviii
LIST OF SYMBOL
Pmax = peak load, N
Pmean = mean or average load, N EA = energy absorption, Nmm
= axial displacement, mm
t = thickness, mm
L = length, mm
A = area, mm2
Mc = moisture content, %
m0 = initial mass of the test specimen, g
m0 = final mass of specimen after oven-dry, g
D = density of test specimen, kg/m3
m = mass of specimen after dry, g
V = volume of the test specimen after dry, mm3
SH = shrinkage of the test specimen, %
I = initial diameter or length, mm
F = final diameter or length, mm
= material yield strength, MPa
Pm = average folding force, N
h = wall thickness of the column, mm
1
CHAPTER 1
INTRODUCTION
1.1 Background
Based on reference [1], the axial crush response of thin-wall, ductile metallic alloy components (specific geometry and material combination) have been extensively studied for irreversible directional energy absorption capability. It had been studied by Coppa [2], Ezra and Fay [3], Johnson and Reid [4], and finally Reid and Reddy [5]. Due to the significant energy can be absorbed by plastic deformation during the progressive fold formation process that is characteristic of this response, axial crush has many important engineering safety applications in areas including
crashworthiness and blast-resistant design of structures.
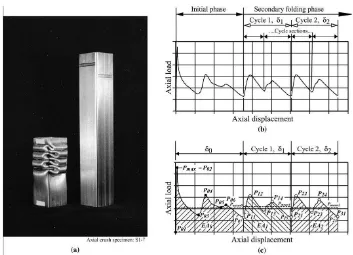
In early time, an example of the symmetric axial crush response mode by Abramowicz and Jones for an AISI 304 stainless steel, welded square box component tube specimen is shown in Figure 1.1. A crush specimen showing the fold formation and an undeformed tube specimen are shown in Figure 1.1(a). The corresponding axial load-axial displacement curve (subsequently referred to as the load–displacement curve) is shown in Figure 1.1(b) and (c). As also mentioned in reference [1], the axial crush response can be considered to consist of phases or stages. The type of response shown in Figure 1.1 is divided into an „initial‟ phase
and a „secondary‟ phase. The initial phase phase includes the pre-collapse response
2
and exterior folds on sets of opposite sidewalls with corresponding increases and decreases in the load–displacement curve. The secondary folding phase consists of the „„steady state‟‟ fold formation process and the adjacent sidewall interactions and contacting of folds produce subsequent fold formations of constant wavelength along
the remaining length of the specimen. Therefore, a cycle in the curve (Figure 1.1(b)) corresponds to the formation of one exterior or one interior fold on both sets of opposite sidewalls with load magnitudes fluctuating between minimum and maximum values. The cycles can be further divided into sections with each section represents the formation of an exterior fold on a specific set of opposite sidewalls and the corresponding formation of an interior fold on the other opposite sidewall pair.
For axial crush response, investigators have used or defined „„crush characteristics‟‟, also called indicators or parameters, to evaluate and compare the performance of components. These characteristics include both direct data and derived quantities. The emphasis of the current investigation is on the direct data quantities from the load–displacement curve. The characteristics of interest are shown in Figure 1.1(c) for the square box component and include: the initial phase peak load, Pmax (or P02); maximum and minimum loads, Pij; mean or average loads,
Pmeani; energy absorptions, EAi; and axial displacements, ��. The subscript i refers to the initial phase if i = 0 and the ith cycle in the secondary phase for i = 1, 2, etc. The subscript j is a sequential number indicator for the maximum and minimum loads in the initial phase or in an ith cycle. In general, an energy absorption quantity, EAi, is the area under the load–displacement curve, and � �� �is equal to the energy
absorption divided by the axial displacement, �� for the initial phase or the ith cycle.
3
The analyses involved peak load and overall crush displacement and energy absorption quantities. Secondary folding phase characteristics and details of the
materials undergoing severe plastic deformation could not be evaluated because of significant differences in the fold formation process and the load–displacement curve
shapes for specimens within each individual study.
Figure 1.1: Symmetric axial crush response mode – ductile metallic alloy, square box component: (a) axial crush and undeformed tube specimens, (b) curve sections and (c)
crush characteristics. (Source: Dipaolo and Tom, 2006)
4
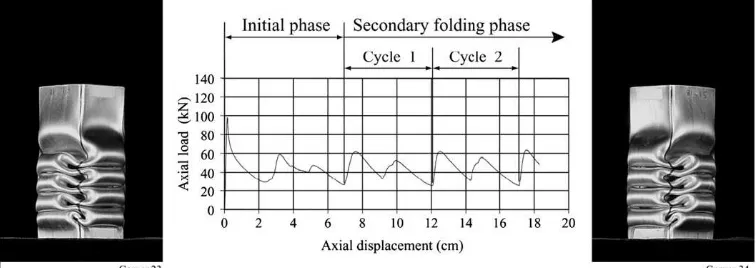
previous research [1] is given in Figure 1.2. The results of the research showed that there were several configuration responses of the symmetric axial crush mode and
that these configuration responses differed in stationary fold-line locations and traveling fold-line paths for right-circular cylindrical polyvinyl chloride specimens, idealized models, plastic „„hinge lines‟‟, and for right-circular cylindrical and square specimens. Therefore, there were differed in load magnitudes, energy absorption processes and material performance requirements.
It had demonstrated that axial crush response could be controlled and restricted to a specific configuration response for tube specimens with constant geometry and material and, also, for tube specimens with constant geometry and of the same alloy, but having different uniaxial tensile strength levels.
This capability is important not only for the practical application of axial crush response, but also because it provides the ability to research the influence of material parameters on axial crush characteristic magnitudes and to study details of material behavior such as microstructural evolution and deformation mechanisms during severe plastic deformation.
Figure 1.2: Configuration A response – prototype specimen S1-18: fold formation and load–displacement curve.
5
1.2 Objective
The main objective of this research is focused on the capability of the bamboo-filled and hollow empty square aluminium tube to absorb energy during
compression. Different cross-section with constant wall thickness and length were studied and tested to compare the behavior of its capability in energy absorption.
In order to achieve the above goal, each tube was investigated its peak and mean loads, plastic folding and energy absorbed of bamboo-filled hollow empty aluminium tube subjected to axial compression. In additional, the study also compared empty and bamboo-filled tube with respect to energy absorption.
1.3 Scope
Aluminium thin-walled tube is selected as the experiment specimen. For comparison among the empty tubes, the tube had three different cross section dimensions but had same thickness and length of 1.5mm and 300mm. While for comparison between empty and bamboo-filled tubes, the length of the tube is decrease to 150mm. The type of bamboo chosen is Dendrocalamus Asper. All specimens subjected quasi-static loading with compression speed of 10mm per
minute. The characteristic of the empty tube for each cross section is determine through its‟ peak and mean loads, number of plastic folding, and capability of energy absorbed. As for the characteristic between empty tube and bamboo-filled tube, the
specimen‟s peak and mean loads, and the capability of energy absorbed are also been