i
THE EFFECT OF INTELLECTUAL CAPITAL,
CORPORATE SOCIAL RESPONSIBILITY
DISCLOSURE, AND GOOD CORPORATE
GOVERNANCE ON THE VALUE OF
MINING COMPANIES LISTED IN INDONESIA
STOCK EXCHANGE
PENGARUH MODAL INTELEKTUAL, PENGUNGKAPAN TANGGUNG JAWAB SOSIAL PERUSAHAAN, DAN GOOD CORPORATE GOVERNANCE PADA NILAI PERUSAHAAN PERTAMBANGAN YANG
TERDAFTAR DI BURSA EFEK INDONESIA
THESIS
By:
Nadia Azalia Putri 120810201220
UNIVERSITY OF JEMBER
FACULTY OF ECONOMICS
i
THE EFFECT OF INTELLECTUAL CAPITAL, CORPORATE
SOCIAL RESPONSIBILITY DISCLOSURE, AND GOOD
CORPORATE GOVERNANCE ON THE VALUE OF MINING
COMPANIES LISTED IN INDONESIA STOCK EXCHANGE
PENGARUH MODAL INTELEKTUAL, PENGUNGKAPAN TANGGUNG JAWAB SOSIAL PERUSAHAAN, DAN GOOD CORPORATE GOVERNANCE PADA NILAI PERUSAHAAN PERTAMBANGAN YANG
TERDAFTAR DI BURSA EFEK INDONESIA
THESIS
A Thesis submitted in Partial Fulfillment of the Requirement for the Award of Bachelor of Economics (Management)
By:
Nadia Azalia Putri 120810201220
UNIVERSITY OF JEMBER
FACULTY OF ECONOMICS
ii
MINISTRY OF RESEARCH, TECHNOLOGY, HIGHER EDUCATION UNIVERSITY OF JEMBER-FACULTY OF ECONOMICS
STATEMENT OF THESIS AUTHENTICITY
Name :Nadia Azalia Putri Identification Number :120810201220 Department :Management
Concentration :Financial Management
Thesis Title :The Effect Of Intellectual Capital, Corporate Social Responsibility Disclosure, And Good Corporate Governance On The Value Of Mining Companies Listed In Indonesia Stock Exchange
Certify that this thesis does not incorporate, without acknowledgement, any material previously submitted for a diploma in any institution of higher education and that, to the best of my knowledge and belief, it does not contain any material previously published or written by another person except where due reference is made in the test. I am aware of the potential consequences of any breach of the procedures and guidelines, e.g. cancellation of my academic award.
Jember, March 2016
iii
SUPERVISOR’S APPROVAL
Thesis Title :The Effect Of Intellectual Capital, Corporate Social Responsibility Disclosure, and Good Corporate Governance on The Value Of Mining Companies Listed In Indonesia Stock Exchange
Name :Nadia Azalia Putri Identification Number :120810201220
Faculty :Economics
Department :Management
Concentration :Financial Management Approval date :31st March 2016
Supervisor II Supervisor I
Prof. Tatang AG., M.Buss.,Acc.,Ph.D. Prof. Dr. Istifadah, SE, MSi. NIP. 19661125 199103 1 002 NIP. 19661020 199002 2 001
Approved by,
Head of Bachelor of Management Program
iv
APPROVAL OF THE EXAMINATION COMMITTEE
THE EFFECT OF INTELLECTUAL CAPITAL, CORPORATE SOCIAL RESPONSIBILITY DISCLOSURE, AND GOOD CORPORATE GOVERNANCE ON THE VALUE OF MINING COMPANIES LISTED IN
INDONESIA STOCK EXCHANGE
This thesis is prepared and compiled by:
Name :Nadia Azalia Putri Identification Number :120810201220
Department :Management
It has been defended before the Examination Committee on the date:
And declared to fulfill all complete requirements to be accepted as graduate at the Faculty of Economics, University of Jember
EXAMINERS:
The Chairperson : Drs. Marmono Singgih, M.Si : (………...)
NIP. 19660904 199002 1 001
The Secretary : Drs. Sudaryanto, MBA.,Ph.D : (………...)
NIP. 19660408 199103 1 001
The Member : Dr. Purnamie Titisari SE., M.Si: (………...)
NIP. 19750106 200003 2 001
Approved by,
Dean of Faculty of Economics University of Jember
v
DEDICATION
This thesis is gratefully dedicated to:
1. The sake of Allah, my Creator and my Master
2. My great teacher and messenger, Muhammad SAW, who taught us the purpose of life.
3. My incredible family, Lilik Farida, Hari Murti, Ahsin Kusuma, Tuty Sumiati, and Bramantya Anggara who never stop giving of themselves in countless and coloring the deserted home.
4. My supervisors, Prof. Dr. Isti Fadah, M.Si.and Prof. Tatang Ary Gumanti, M. Buss. Acc.,Ph.D. and all of my tireless teachers from kindergarten till university for the direction, boost, and support.
5. The glaze on my donut, Bimantara Mahardhika.
vi
MOTTO
“Go forth, whether light or heavy, and strive with your wealth and your lives in the cause of Allah. That is better for you, if you only knew.”
(QS. At-Taubah: 41)
“You are not here just to fill space or to be a background character in someone else’s movie. Consider this : nothing would be the same if you didn’t exist. Every
place you have ever been and everyone you have ever spoken to would be different without you”
(Anonim)
“Don’t waste your time, or time will waste you”
vii SUMMARY
The Effect Of Intellectual Capital, Corporate Social Responsibility Disclosure, and Good Corporate Governance on The Value Of Mining Companies Listed In Indonesia Stock Exchange; Nadia Azalia Putri; 120810201220; 2016; 65 pages; Management Department Faculty of Economics University of Jember
A company will always attempt to reach its goal by increasing its efficiency and effectiveness. One of the ways to achieve the goal is by improving Intellectual Capital (IC), Corporate Social Responsibility (CSR) and Good Corporate Governance (GCG). Intellectual capital is intellectual material that has been formalized, captured, and leveraged to produce higher valued asset. CSR is social involvement, responsiviness, and accountabilitty of companies apart from their core profit activities. Whereas GCG is a healthy corporate principles to be applied in the management of the company that carried out solely in order to maintain the company's interests in order to achieve the aims and objectives of the company. This study was conducted with the aim of finding empirical evidence about the effect of Intellectual Capital, Corporate Social Responsibility, and Good Corporate Governance on the value of company using multiple linear regression.
Intellectual capital was proxied using three components of VAICTM, those are Value Added Capital Employed (VACA), Value Added Human Capital (VAHU), and Structural Capital Value Added (STVA). CSR disclosure is proxied using CSR index from Global reporting Index. Good Corporate Governance is proxied using independent commissioner, managerial ownership, audit committee, institutional ownership. Company value is proxied using Tobin’s Q. This study used secondary data. The population consisted of mining companies listed in Indonesia Stock Exchange in the period of 2010-2014. The data were collected from annual reports of the companies. The sample consisted of 15 mining companies selected using purposive sampling. The hypotheses were tested using t-test.
viii
FOREWORD
First and foremost, I would like to express my greatest gratitude to Allah SWT, for all his gift so I can finish my thesis entitled “The Effect Of Intellectual Capital, Corporate Social Responsibility Disclosure, And Good Corporate Governance On The Value Of Mining Companies Listed In Indonesia Stock Exchange”.
I would like to express my deepest appreciation and sincerest thanks to the following people:
1. My first consultant,Prof. Dr. Istifadah, SE, MSi and my second consultant, Prof. Tatang AG., M.Buss.,Acc.,Ph.D for the guidance and valuable suggestons that helped me compile and finish my thesis.
2. The lecturers who have taught and given me a lot of knowledge.
3. My big family, my classmates, and all of LPME Ecpose members for their support.
4. Bimantara, for the laugh and sincere care.
Finally, I hope this thesis will provide some advantages to the readers. Any criticism, suggestions, and input will be appreciated to make this thesis better.
Jember, March 2016
x
2.4 Hypotheses Development...
CH 3. RESEARCH METHOD ...
3.1. Research Design ...
3.2 Population and Sample ...
3.3 Types and Sources of Data ...
3.4 Operational Definition and Variable Measurement...
3.4.1 Identification of Variables ... 3.4.2 Operational Definition and Variable Measurement Scale ...
3.5 Method of Analysis ...
3.5.1 The Measurement of Company’s Value ... 3.5.2 The Measurement of Value Added Capital Employed
(VACA) ... 3.5.3 The Measurement of Value Added Human Capital
(VAHU) ... 3.5.4 The Measurement of Structural Capital Value Added
(STVA) ... 3.5.5 The Measurement of Corporate Social Responsibility ... 3.5.6 The Measurement of Institustional Ownership ... 3.5.7 The Measurement of Independent Commissioner ... 3.5.8 The Measurement of Audit Committee ... 3.5.9 The Measurement of Managerial Ownership ... 3.5.10 Normality Test ...
4.1. General Description of Research Object ...
xi
4.2.3 Multiple Regression Analysis... 4.2.4 Classical Assumption Test ... 4.2.5 Hypotheses Test (t-test) ...
4.3 Discussion ...
4.3.1 The Effect of Value Added Capital Employed (VACA) on Company’s Value ... 4.3.2 The Effect of Value Added Human Capital (VAHU) on Company’s value ... 4.3.3 The Effect of Structural Capital Value Added on
Company’s value ... 4.3.4 The Effect of Corporate Social Responsibility (CSR) on Company’s value ... 4.3.5 The Effect of Independent Commisioner on Company’s value ... 4.3.6 The Effect of Managerial Ownership on Company’s
value ... 4.3.7 The Effect of Audit Committee on Company’s value ... 4.3.8 The Effect of Institutional Ownership on Company’s
xii
TABLE OF TABLES
2.1 Previous Studies ... 4.1 The Process of Sampling ... 4.2 Descriptive Statistics of Variables ... 4.3 The Result of Normality Test using Kolmogorov-Smirnov Test ... 4.4 The Result of Multiple Regression Analysis ... 4.5 The Result of VIF Value to Test the Multicollinearity ... 4.6 The Result of Glejser Test ...
xiii
TABLE OF FIGURES
2.1 Conceptual Framework ... 2.2 Problem Solving Framework ...
xiv
TABLE OF APPENDIX
1 Companies Selected as Research Sample ... 2 Indicator of Environmental Performance based on Global Reporting
Initiative (GRI) ... 3 Calculation Result of Variables ... 4 Descriptive Statistics of Variables ... 5 Result of Normality Test of Data ... 6 Result of Multiple Linear Regression Analysis ... 7 Result of Normality Test of Model ...
8 Result of Multicollinearity Test ... 9 Result of Heteroscedasticity test ... 10 Result of Autocorrelation Test ... 11 Result of Correlation Test ...
1
CHAPTER I. PREFACE
1.1 Research Background
One of the main objectives of a company is to maximize its value. The value of the company itself is the price that potential buyer is willing to buy. The higher the value of company, the greater the prosperity of company owner from the proceeds (Husnan and Pudjiastuti, 2012:7).Company’s value is the center of corporate finance, however, calculating value of a company is not easy. First, different companies should be valued differently (for example, public company vs. private company). Second, company’s value depends on the aim of the valuation as well (one company can have several values, depending on the method). In the past, the company is evaluated through performance evaluation and firm tangible assets evaluation; today, type of assets named intangible assets is proposed to be used more for evaluating firms, generally theses intangible assets call intellectual capital (Pouraghajan, et al, 2013).
2
in the global business environment. Only a few developed countries that have begun implementing this concept, such as America, England, Australia and Denmark.
In addition to the application of intellectual capital-based business for profit maximization, companies are also required to keep paying attention to the role of stakeholders, so the company should be able to develop Corporate Social Responsibility (CSR) program. Corporate sustainability will only be assured if the company cares about the social and environmental dimensions as well. It is a fact how local community resistance, in different places and time, comes to companies that are considered not pay attention to social, economic and environmental life aspects (Octavia, 2014).
According to Nurlela and Islahuddin (2008), CSR is conceptually developed since the 1980s triggered by at least 5 of the following: (1) the rise of "take over" phenomenon between corporations triggered by financial engineering skills, (2) the fall of Berlin Wall which is a symbol of the collapse of communism and the raise of capitalism, (3) the spread of multinational corporations operating in developing countries, resulting protest in order to pay attention to: human rights, social conditions and fair treatment of workers, (4) globalization and the shrinking role of public sector (government) almost all over the world have led to the growth of non-governmental organization (including professional associations) started from the issue of poverty until the concerns about the extinction of various species so that the ecosystem is getting unstable, (5) the company's awareness of the importance of brands and the company's reputation in bringing the company into a sustainable business.
3
enhance the company's growth, and maintain the viability of the company. Unfortunately, according to the survey conducted by McKinsey and Company and the Political and Economic Risk Consultancy (PERC) in 2010 showed that Indonesia occupied the lowest position in the implementation of Good Corporate Governance in Southeast Asia. This indicates a very unfavorable position for Indonesia. According to PERC, poor corporate governance threatens the entry of foreign investors to Indonesia (Sutedi, 2011:55).
This research is conducted on mining companies listed in Indonesia Stock Exchange period 2010-2014. According to Malinda (2015), mining companies in Indonesia have become one of the strategic industries that play significant role in national economic development. Based on data from Indonesia Mining Association in 2014, Indonesia was the sixth biggest country that is rich in mineral resources, ranging from coal, oil and gas, gold, tin, etc. However, the uncertainty of global economic conditions has caused some strategic sectors of national economy decreased, one of which is mining sector. Since the early of 2011 until now, the performance of mining companies continues to weaken up to 48% (CNN Indonesia, August 5th, 2015). According to BPS data, the declining productivity of mining companies in 1st quarter 2015 amounted to -1.23% and in 2nd quarter reached -5.87%. The weakening was due to the price of goods, especially coal mines which still continue to decline, then it caused many companies out of business.
4
companies. Social responsibility of mining companies is certainly very necessary for the continuation of its business and to maximize the company's value in the eyes of investors. GCG is also necessary to improve the financial performance and enhance the company’s valuein the investor’s perspective.
1.2 Problem Formulation
During its development, the company always tries to maintain their business advantage to increase its value, likewise mining companies in Indonesia. Potential mineral resources that is not supported by a good investment climate makes make mining company managers should look for strategies to increase the company’s value. All this time, mining companies are still classified in the low-intellectual capital company, while companies in other sectors have been competing in implementing intellectual capital with the application of knowledge management (Setiawan, 2015). In fact, by increasing its intellectual capital, a company can increase its value (Chen et al, 2010). Pulic (2000) proposed the indirect method to measure intellectual capital in a company using VAICTM (Value Added Intellectual Capital Coefficient). The main components of VAIC consist of the company's resources, those are physical capital (VACA - value added capital employed), human capital (VAHU-value added human capital), and structural capital (STVA-structural capital value added). Ming-Chin, Shu-ju, and Yuhchang (2010) examined the effect of VACA, VAHU, and STVA to the market value which is proxied using Market to Book Value (MtBV). The result showed that the VACA, VAHU, and STVA have positive impact on firm value (MtBV).
5
that CSR disclosure positively affect firm value. In other side, Nurlela and Islahuddin (2008) found no effect of CSR on company’s value . So does the research’s result of Yosefa and Wondabio (2007) which states CSR negatively affects the company’s value.
In addition to intellectual capital and CSR, there is one factor that also affect company’s value, that is the implementation of GCG. According to FCGI (2001), GCG implementation in a company can be identified by knowing the percentage of institutional ownership, independent commissioner, managerial ownership, and the existence of audit committee. Those four aspects are considered capable to reduce agency problems within a company and increases the company’s value (Bhojraj and Sengupta, 2003).
According to those empirical studies, the main problems to be discussed in this research is whether the variable of VACA, VAHU, STVA, CSR, institutional ownership, independent commisioner, audit committee,and managerial ownership affect the value of mining company listed in IDX period 2010-2014.
Based on the background that has been described, the problems formulation of this research are as follows:
1. Does Value Added Capital Employed (VACA) positively affect the value of mining company?
2. Does Value Added Human Capital (VAHU) positively affect the value of mining company?
3. Does Structural Capital Value Added (STVA) positively affect the value of mining company?
4. Does Corporate Social Responsibility (CSR) Disclosure positively affect the value of mining company?
5. Does institutional ownership positively affect the value of mining company? 6. Does independent commisioner positively affect the value of mining
company?
6
1.3Research Goals
Based on the problem formulation above, the goals of this research are:
1. To analyze the effect of Value Added Capital Employed (VACA) on the value of mining company
2. To analyze the effect of Value Added Human Capital (VAHU) on the value of mining company
3. To analyze the effect of Structural Capital Value Added (STVA) on the value of mining company
4. To analyze the effect of Corporate Social Responsibility (CSR) Disclosure on the value of mining company
5. To analyze the effect of institutional ownership on the value of mining company
6. To analyze the effect of independent commisioner on the value of mining company
7. To analyze the effect of audit commitee on the value of mining company 8. To analyze the effect of managerial ownership on the value of mining
company
1.4Research Benefits
This research is expected to provide benefits to some parties, those are academics, for companies, investor, and potential investor.
1. For academics
Result of this study is expected to increase knowledge and insight into the field of financial management especially on how the influence of IC, CSR and GCG on the value of mining company listed on Indonesia Stock Exchange in 2010-2014.
2. For companies
7 3. For investors and potential investors
8
CHAPTER 2. LITERATURE REVIEW
2.1 Theoritical Review
2.1.1 Intellectual Capital
Intellectual capital is all of firms’ intangible assets which highlight itself through difference between market and book value of firms that relied on knowledge and can cause creating value in firm financial potential (Bontis, 2003). Intellectual capital is essentially defined as the knowledge assets that can be converted into value (Edvinsson and Sullivan, 1996). Stewart (1997) defined intellectual capital as new capital of organization where intellectual resources like knowledge, information and experience are as instrument for creating this capital. Fincham and Roslender (2003) called intellectual capital as hidden assets of firm where recognizing , measuring, and representing it in financial statement are difficult. Kamal et al. (2011) defined intellectual capital as net value added to firm assets.
We can argue from all represented definitions that intellectual capital is the use of knowledge, experience, and intangible asset at production or service which cause creating value for organization. Firm real value can increase with using intellectual capital in organization continuously.
Scientists and theorist of intellectual capital area believe that intellectual capital consists of three parts: (1) capital employed, (2) human capital, (3) structural capital. Capital employed includes all relationships between organization with people and other institutions for its survival. The concept of capital employed is the use of organization knowledge in marketing and relationship with costumer at business (Bontis et al., 2002). The increase of capital employed is possible through growing human and structural capital. Capital employed is the main factor in converting intellectual capital into market value and enhancing organization business performance.
9
knowledge and experience of its employers. This knowledge is at employers mind and human capital exit from organization since employers leave it, so human capital isn’t owned organization. If knowledge and ability of employers are used effectively, it will cause improvement in efficiency, productivity and innovation in product and service. Human capital is a start of development stages, insight source and innovation source (Stewart, 1997). Human capital leads organizations to rely on knowledge, ability and experience of their employers for improving financial performance. Human capital consists of ability and experience of employers that is useful for organization’s success.
The third is structural capital. Structural capital is the supportive infrastructure that enables human capital to function. Structural capital is owned by an organization and remains with an organization even when people leave. It includes patents, commercial signs, data base, organization chart and strategies. An organization that has strong structural capital has supportive culture for its employers that allow new experience, learning and failure experience to them (Bontis et al, 2002).
2.1.2 Value Added Intellectual Coefficient (VAIC ™)
10
Pulic (2000) described that VA is calculated as the difference between the output (OUT) and the input (IN) with the following formula:
VA = OUT – IN (2.1)
Description:
VA = Value Added
OUT = Output (total sales and other revenues)
IN = Input (sales cost and other costs except labor cost)
Pulic (2000) also explained that the value added can also be calculated from the accounts of the company as follows:
VA = OP + EC + D + A
Description :
VA = Value Added OP = operating profit EC = employee costs D = depreciation A = amortization
Pulic (2000) explained that the process of value creation is influenced by the efficiency of Capital Employed (CE), Human Capital (HC), and Structural Capital (SC). Value Added Capital Employed (VACA) is measured using the following formula:
VACA = VA / CE (2.2)
Description :
VACA = Value Added Capital Employed
VA = Value Added
CE = Capital Employed (funding available: net assets)
Value Added Human Capital (VAHU) is measured using the following formula:
VAHU = VA / HC (2.3)
Description :
11
VA = Value Added
HC = Human Capital (labor expenses)
Structural Capital Value Added (STVA) is measured using the following formula:
STVA = SC / VA (2.4)
Description :
STVA = Structural Capital Value Added SC = Structural Capital (VA-HC) VA = Value Added
Where VAIC is the sum of VACA, VAHU, and STVA.
VAIC = VACA + VAHU + STVA (2.5)
2.1.3 Corporate Social Responsibility
According to World Business Council for Sustainable Development (WBCSD), Corporate Social Responsibility (CSR) is the continuing commitment by business to contribute to economic development while improving the quality of life of the workforce and their families as well as of the community and society at large. Mc Williams and Siegel (2001)stated CSR is conventionally defined as the social involvement, responsiviness, and accountabilitty of companies apart from their core profit activities and beyond the requirements of the law and what is otherwise required by government.
Corporate Social Responsibility (CSR) was first proposed by Howard R. Bowen in 1953. After that, CSR experienced a continuous development of the concept, the original CSR activities oriented on "philanthropy", it is now used as one of the company's strategy to increase corporate image that will also affect the company's financial performance as well as the importance of community development for the application of CSR.
12
to adapt to its environment, the community and stakeholders associated with local, national and global. In short, CSR implies that the company has a moral duty to be honest, obey the law, and upholds integrity(Ardianto et al., 2011: 35).
2.1.4 Corporate Social Responsibility Disclosure
This study tries to identify issues related to corporate social reporting based on Global Reporting Initiative (GRI) standard. GRI has pioneered and developed a comprehensive sustainability reporting framework that is widely used around the world (www.globalreporting.org). The indicators contained in GRI are as follows:
1. Economic Performance Indicators 2. Environmental Performance Indicators 3. Labor practices performance indicator 4. Human rights performance indicators 5. Social Performance Indicators 6. Product Performance Indicators
List of social disclosure based on GRI standards has also been used by Safitri (2014) because there is still no standard guidance about CSR disclosure in Indonesia. Therefore, the majority of companies that have been implementing CSR or compiling their sustainability reports still refer to GRI standard. This study only used environmental performance indicators because mining companies is highly related to environmental issue. Rae and Rouse (2001) stated that public opinion of natural resource extraction industries is influenced more by concerns over environmental performance than by performance in areas such as product pricing, quality, and safety. Environmental Performance Indicators consists of 30 items of statement, including the material used, waste effect, total emission, etc.
2.1.5 Good Corporate Governance
13
(principal / investor) that funds invested are used appropriately and efficiently. In addition to corporate governance, the company provides assurance that the management (agent) acts in the best interest of the company.
The Decree of Minister of State / Head of Investment and Development of SOE No. 23 / M-PM.PBUMN / 2000 on the development of corporate governance practices in the Company (Persero), identifies that GCG is a healthy corporate principles to be applied in the management of the company that carried out solely in order to maintain the company's interests in order to achieve the aims and objectives of the company. Peter and John (2005) defined corporate governance as a set of provisions that enable the stockholders by exercising voting power to compel those in operating control of the firm to respect their interests. Based on those definitions, it can be concluded that GCG is a system that regulate, manage, and control the effort to increase the value of company, as well as a form of attention for shareholders, creditors, and society.
The application of corporate governance provide four benefits (FCGI, 2001),namely: (1) improve corporate performance through the creation process of making better decisions, improve the company's efficiency, and further increase service to stakeholders, (2) facilitate obtaining the funds finance cheaper and not rigid (because the trust factor) that will eventually increase corporate value, (3) restore the confidence of investors invest in Indonesia, and (4) the shareholders will be satisfied with as well as the performance of the company will increase shareholder's values and dividend.
14
free of business relationship or other relationship which could affect its ability to act independently or act solely in the interests of the company (Regulation number 40 year 2007 regarding Private Limited Company). Audit committee is a group of people chosen by the larger group that is responsible to assist the auditor in maintaining their independence from management (Tugiman, 1995:8). Managerial ownership is ownership by the management of the company, as measured by the percentage of the number of shares owned by management (Sujono , 2007).
2.1.6 Company’s Value
The company's main purpose is to increase the company’s value through increasing the prosperity of the owner or shareholders (Wahidawati, 2002). Company’s value is very important because the high value of the company will be followed by high prosperity of shareholders (Brigham and Gapenski, 1996:22). The value of a company is reflected in its market value of shares. There are several ratios to measure the market value of companies, one of which is Tobin's Q. Tobin's Q ratio assessed can provide best information, because in Tobin's Q include all elements of debt and company equity (Tri, 2015). According to White et al. (2002)Tobin's Q can be formulated as follows:
D shares at the end of the year with the number of outstanding shares at the end of the year
EBV = Equity book value, which is derived from the difference between total assets of the company with total liabilities
15
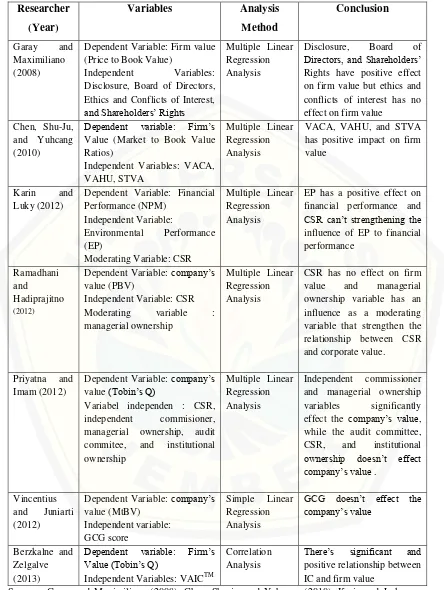
2.2Previous Studies
There are already many that examined the influence of IC, CSR, and GCG on company’s value, for example Garay and Maximiliano (2008) who examined the relationship between corporate governance and company’s value in 46 Venezuelan companies period 2000-2002. The dependent variable is company’s value proxied by Price to Book Value (PBV). The independent variables are GCG disclosure, Board of Directors, Ethics and Conflicts of Interest, and Shareholders’ Rights. The results showed that Disclosure, Board of Directors, and Shareholders’ Rights have positive effect on firm value but ethics and fonflicts of interest has no effect on firm value.
Chen, Shu-ju, and Yuhchang (2010) analyzed the effect of IC using VAICTM components which are proxied using VACA, VAHU, and STVA on the market value which is proxied using Market to Book Value (MtBV). This study is conducted on 4.254 Taiwanese public companies listed on Taiwan Stock Exchange period 1992-2002 The result showed that the VACA, VAHU, and STVA have positive impact on firm value (MtBV).
Karin and Luky (2010) examined the influence of environmental performance on financial performance using CSR disclosure as moderating variable. This study is conducted on 10 firms in mining, chemical, pharmaceutical, cement, pulp, and paper sectors listed in Indonesia Stock Exchange period 2006-2010 with 50 observations. Result indicates that (1) environment performance has positive effect on financial performance, (2) CSR disclosure is not able to strengthen the influence of environmental performance on financial performance.
16
revealed that CSR has no effect on firm value and managerial ownership variable has an influence as a moderating variable that strengthen the relationship between CSR and corporate value.
Priyatna and Imam (2012) analyzed the effect of CSR and corporate governance on the company’s value listed on Indonesia Stock Exchange (IDX). Variables used in this study are CSR, independent commissioner, managerial ownership, audit committees, and institutional ownership as independent variables and company’s value proxied by Tobin's Q as dependent variable. The results showed that independent commissioner and managerial ownership variables significantly effect the company’s value, while the audit committee, CSR, and institutional ownership doesn’t effect company’s value .
Vincentius and Juniarti (2012) examined the effect of GCG on the value of company. GCG is proxied using GCG score and company’s value is proxied using Tobin’s Q. This study is conducted in 37 industrial companies listed on Indonesia Stock Exchange period 2007-2011. Results show that GCG does not affect the company’s value.
17 Disclosure, Board of Directors, Ethics and Conflicts of Interest,
18
This research is to certain extent qualitatively similar to examine the effect of intellectual capital, corporate social responsibility and good corporate governance on company’s value. The difference between this study and the previous researches are this study is trying to combine all the three variables (IC, CSR, and GCG) as independent variables that has never been studied before. The matrix of previous studies indicate that despite the variable and analysis tools used are similar, but the result is different. Therefore, the researcher tries to reexamine existed theories, but using different objects. The object of this is the mining company. The period of observation within a period of five years during 2010-2014.
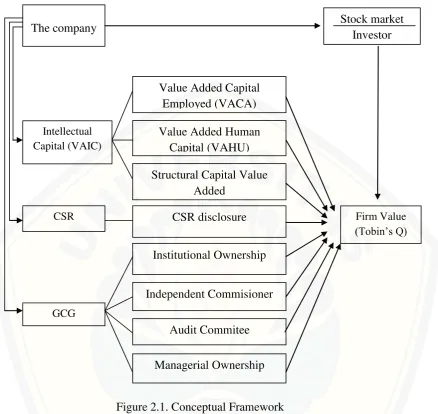
2.3Conceptual Framework
Conceptual framework of this study is illustrated in Figure 2.1. Every business entity definitely wants to increase its company’s value. The value of the company reflected by stock market value is strongly influenced by investment opportunities. The existence of investment opportunities can give a positive signal about the company's growth in the future. Buttressed by empirical research that has been done previously, the disclosure of financial and non-financial activities will ultimately enhance shareholder value. Therefore, in increasing the market value, a company should not only be reliable in its human resources, but also should care about the environment and the interest of shareholders. Therefore, the intellectual capital variables proxied using VACA, VAHU, and STVA, corporate social responsibility, and good corporate governance proxied using institutional ownership, independent committee, audit committee, and managerial ownership is supposedly having effet company’s value
19
Figure 2.1. Conceptual Framework
The framework above illustrates that this study wants to examine the effect of IC components, among others VACA, VAHU, STVA; CSR and GCG components include Institutional Ownership, Independent Commisoner, Audit Committee, and Managerial Ownership of the company’s value.
2.4Hypotheses Development
2.4.1 The Effect of Intellectual Capital on Company’s value
Pulic (2000) stated that firm’s market value is created by capital employed and intellectual capital which consists of human capital and structural capital. No doubt that intellectual capital is a determinant of the company’s value of and the
Value Added Capital Employed (VACA)
Structural Capital Value Added
Audit Commitee CSR disclosure
Institutional Ownership
Independent Commisioner
Managerial Ownership Value Added Human
Capital (VAHU) Intellectual
Capital (VAIC)
CSR
GCG
Firm Value (Tobin’s Q)
The company Stock market
20
performance of national economy (Choo and Bontis, 2002). Intellectual capital has been recognized as an important resource that provides benefits for the creation of efficiency, effectiveness, productivity, and innovation of the company compared to physical capital and financial capital (Najibullah, 2005). Gede (2012) examined the effect of intellectual capital on the value of go public banking companies in Indonesia Stock Exchange. I Gede used Price to Book Value (PBV) in measuring the value of company and found that intellectual capital has positive effect on the value of the company.
VAICTM is an aggregate measure of intellectual ability of a company, if an investor puts a different value for three components of VAIC ™, the Value added Capital Employed (VACA), Value added Human Capital (VAHU), and Structural Capital Value Added (STVA), then the three VAIC ™ components model will have greater explanatory power of one aggregate model. Based on the theories and studies that have been done before the proposed hypotheses are:
H1: VACA positively affects the value of mining companies
H2: VAHU positively affects the value of mining companies
H3: STVA positively affects the value of mining companies
2.4.2 The effect of CSR on company’s value
21
H4: Corporate Social Responsibility positively affects on the value of the coal
mining company.
2.4.3 The Effect of Good Corporate Governance on Company’s value
Companies that have good corporate governance, not only will provide benefits for the company itself and protect the interests of investors, but also other parties who have a direct or indirect connection with the company. Through good corporate governance, the decision-making process will run better, so it will produce optimal decisions, can improve the efficiency and the creation of healthier corporate culture.
In this study, the mechanism of GCG application is proxied using independent commioners, managerial ownership, institutional ownership, and the audit committee. Evans et al. (2002) examined the relationship between corporate governance structure and decrease in company's performance with sample of companies in Australia. He reported the results that there is no correlation between the ratio of independent commisioners to corporate performance. Fűerst and Kang (2004)examined corporate governance and operating performance and they found positive relationship between independent commisioner with the company performance.
Bhojraj and Sengupta (2003) examined the effect of corporate governance on company’s value. They used institutional ownership and independent commisioner as independent variables. The result is the percentage of institutional ownership and the proportion of independent commisioner is positively related to the company’s value.It can be cloncluded that variable institutional ownership and independent commisoner affect company’s value postitively. Based on this reason, the hypothesis to test the effect of corporate governance on the value of the company is:
H5: Institutional ownership positively affects the value of the mining company.
H6: Independent commissioner positively affects the value of the mining
22
Studies using audit committee as independent variable are still rare. The study of Kotter and Silvester (2003) focused on the composition of board of directors and supervisory committee (audit committee and compensation committee) on the company in Australia. This study proves that there is a positive relationship between the proportion of independent directors and supervisory committee on the performance of companies with multiple regression analysis. Turley and Zaman (2004) examined the effect of corporate governance and audit committee, to evaluate and synthesize some previous research on corporate governance relating to the audit committee. The study reported that there’s positive relationship between the existence of audit committee with the quality and performance of the company's financial statements. Based on these studies, the hypothesis to test the effect of corporate governance on the value of the company is:
H7: The audit committee positively affects the value of mining company.
One effort to reduce agency problem is by providing incentives for the agent or management. The incentives can be in a portion of the company's stock ownership for the managers (Isti, 2010). Borolla (2011) explains, if it is based on logic, shares ownership by managers will reduce the tendency to consume excessive perquisites. Isti (2010) explains this attempt is intended to balance the interests between the management and the shareholders (Isti, 2010). Through the majority proportion of shares owned by the company management, it will make the management can feel benefits from the decisions taken. Putri (2011) confirms manager who works to improve the welfare of the owner and himself in the structure of shares ownership will increase managerial performance which is accompanied by an increase in the company’s value. Based on those explanations , it can be hypothesized as follows:
23
CHAPTER 3. RESEARCH METHOD
3.1 Research Design
The type of this research is hypothesis testing research, the test is based on research hypotheses proposed according to theoretical and empirical studies. In particular, this study is conducted to examine the effect of VACA, VAHU, STVA, CSR, institutional ownership, independent directors, audit committees, and managerial ownership variables on the value of mining companies listed in Indonesia Stock Exchange 2010-2014 period using multiple linear regression analysis.
3.2 Population and Sample
The population in this study are mining companies listed in Indonesia Stock Exchange during the 2010-2014 period. The sampling method is purposive sampling with the following criteria:
1. All companies listed in Indonesia Stock Exchange and included in mining companies that publish annual report from 2009 to 2013 intended that the amount of data can fulfill the sample criteria.
2. The annual report contains complete data to calculate Tobin’s Q, VACA, VAHU, STVA and show the information of CSR disclosure, institutional ownership, independent commissioner, audit committee, and managerial ownership.
3.3 Types and Sources of Data
24
3.4 Operational Definition and Variable Measurement
3.4.1 Identification of Variables
a. Dependent Variables : Company’s value (Tobin's Q) b. Independent Variables :
1. Value Added of Capital Employed (VACA) 2. Value Added of Human Capital (VAHU) 3. Structural Capital Value Added (STVA) 4. Corporate Social Responsibility diclosure 5. Institutional Ownership
6. Independent Commisioner 7. Audit Commitee
8. Managerial ownership
3.4.2 Operational Definition and Variable Measurement Scale a. Company’s value(Tobin’s Q)
Company’s value is the investor’s appreciation of the prospect of a company. In this research, company’s valueis measured using Tobin’s Q. Tobin's Q is an indicator for measuring the company’s performance, especially on the value of company, which shows management ability in managing the assets of the company. The company’s value variable is measured using ratio scale.
b. Independent Variables:
1. Value Added of Capital Employed (VACA)
VACA is an indicator of the value added created on capital sought by companies efficiently (Ulum, 2008:89). The scale used is ratio scale.
2. Value Added Human Capital (VAHU)
25 3. Structural Capital Value Added (STVA)
This ratio measures the amount of capital structure needed to produce value added and an indication of how successful structural capital in the process of value creation in company. The scale used is ratio scale.
4. Corporate Social Responsibility
Achda (2007) defines CSR as the company's commitment to be responsible for the impact of its operations in the social, economic, and environmental dimension and continuing to ensure that the impact will give benefit to the community and environment. The disclosure of CSR is grouped into six categories according to categories of social information according to GRI (2006), those are environment, energy, health, safety of workers, product, and general community involvement indicator. This study uses only environment indicator. Environment indicator contains 9 sub-indicator and 30 items of statement. The sub-indicators are material, energy, water, biodiversity, waste, product, suitability, transportation, and conformity. The measurement scale is interval scale.
5. Institutional Ownership
Institutional ownership is shareholding company owned by the institution such as insurance companies, banks, investment companies and others (Tarjo, 2008). Institutional ownership is total of shares percentage owned by institutional who owned at least 5% of the company shares. The method to calculate the percentage of institutional ownership is by knowing the shares held by institution contained in financial statements. The measurement scale used is ratio scale and the unit of measurement is percentage (%).
6. Independent commissioner
26
owned by a company with the total number of commissioners. The proportion of independent commisioner required by Bapepam kep-05 / PM / 2002, the minimum is 25% of the total members number or proportional to the number of minority shareholders. The measurement scale used is ratio scale, the unit of maintaining their independence from management (Tugiman, 1995:8). The measurement scale is interval scale.
8. Managerial Ownership
Managerial ownership is the cumulative percentage of shares owned directly managers (Christiawan and Tarin, 2007). The proportion of managerial ownership is calculated by the percentage of shares held by managers attached in financial statements. The scale of measurement used is ratio scale and the unit of measurement is percentage (%).
3.5 Method of Analysis
3.5.1 The Measurement of Company’s value
This study uses Tobin’s Q ratio to measure company’s value. According to White et al. (2002) ,Tobin's Q can be formulated as follows:
D shares at the end of the year with the number of outstanding shares at the end of the year
27 D = The book value of total debt
3.5.2 The Measurement of Value Added Capital Employed (VACA)
VACA is value created by a unit of physical capital. According to the formula in previous chapter, the formula to calculate VACA is as follows (Pulic,2000):
Description:
VA = Output – Input
VACA = Value Added Capital Employed VA = Value Added
CE = Capital Employed (available funds : net assets)
3.5.3 The Measurement of Value Added Human Capital (VAHU) The formula to calculate VAHU is as follows (Pulic,2000):
. Description:
VAHU = Value Added Human Capital VA = Value Added
HC = Human Capital (labor cost)
3.5.4 The Measurement of Structural Capital Value Added (STVA) The formula to calculate STVA is as follows (Pulic,2000):
Description :
28
3.5.5 The Measurement of Corporate Social Responsibility
CSR disclosure is dummy variable. The total of environment indicator is 30 items. Each item is given score 1, so if the company reveals one item only, then the score obtained is 1. Thus, maximum score if company discloses all item categories disclosure of environmental responsibility is 30.
n (CSR)
3.5.6 The Measurement of Institustional Ownership
The formula to measure institutional ownership is as follows:
Institutional ownership
3.5.7 The Measurement of Independent Commissioner
The formula to measure Independent Commissioner is as follows:
Independent commissioner
3.5.8 The Measurement of Audit Committee
Audit committee is measured by the number of audit committee in a company (Effendi, 2008: 25)
3.5.9 The Measurement of Managerial Ownership
The formula to measure Managerial Ownership is as follows:
After obtaining the data of all variables for each mining company qualified, then the next step is to test the normality of the data that has been obtained.
29 3.5.10 Normality Test
Normality test is done to examine whether the collected data is normally distributed or not. Normality test used in this study is Kolmogorov Smirnov test. The steps done to run normality test as follow:
a. Formulate the hypothesis
Ho : Data is normally distributed H1 : Data is not normally distributed b. Determine the level of significance
The level of significance used in this study is 5%. c. Make the conclusion
To conclude whether the data is normally distributed or not, it uses some criteria as follow:
1. If the significance level of Kolmogorov-Smirnov test > α, H0 is
accepted and H1 is rejected, it means that data is normally distributed. 2. If the significance level of Kolmogorov-Smirnov test < α, H0 is
rejected and H1 is accepted, it means that data is not normally distributed.
3.5.11 Multiple Regression Analysis
Multiple Regression Analysis is used to analyze the effect of VACA (X1), VAHU (X2), STVA (X3), CSR (X4), institutional ownership (X5), independent commissioner (X6), audit committee (X7), managerial ownership (X8) on the company’s value (Y). Multiple regression equation is as follows:
Yi,t = a + b1X1i,t + b2X2i,t + b3X3i,t + b4X4i,t + b5X5i,t + b6X6i,t + b7X7i,t + b8X8i,t +
ei,t
Where:
Y = Company’s value(Tobin’s Q)
X1 = Value Added Capital Employed
X2 = Value Added Human Capital
X3 = Structural Capital Value Added
30 X5 = institutional ownership
X6 = independent commissioner
X7 = audit committee
X8 = managerial ownership
b1,2,3,4,5,6,7,8 =regression coefficient
e = error
3.5.12 Classical Assumption Test
Classical assumption test is used to assess the existence of bias on regression analysis results. Three tests are performed, namely normality test, multicollinearity test, autocorrelation test, and heteroscedasticity test.
a. Normality Test
Normality test is performed to examine whether the value of the regression residuals generated is normally distributed or not. Normality test used in this study is Kolmogorov Smirnov test. The steps done to run normality test as follow: 1. Formulate the hypothesis
Ho : Residual is normally distributed
H1 : Residual is not normally distributed
2. Determine the level of significance
The level of significance used in this study is 5%. 3. Make the conclusion
To conclude whether the data is normally distributed or not, it uses some criteria as follow:
a. If the significance level of Kolmogorov-Smirnov test > α, Ho is accepted and H1 is rejected, it means that residual is normally distributed.
31 b. Multicollinearity test
Multicollinearity test is used to determine whether the regression model has correlation among its independent variables. A good regression models should not contain correlation among its independent variables. If the independent variables are correlated each other, then the variables are not orthogonal. Multicolinearity test is done by examining at the tolerance value and Variance Inflation Factor (VIF) .This method is proposed for detecting variables which lead to has multicollinearity. A regression model that is free of multicollinearity has VIF around number 1 and number ‘tolerance’ approaches 1. The limit of VIF is 10, if VIF under 10, then there is no multicolinearity symptoms or vice versa (Ghozali, 2011).
c. Autocorrelation Test
Autocorrelation test aims to examine whether a linear regression model has no correlation among errors in period t with the error in period t-1. A good regression model is free from autocorrelation. It can be detected through doing Durbin-Watson test. Durbin Watson (DW) test as part of the non-parametric statistics may be used for autocorrelation level one and requires the intercept in a regression model, and there is no lag variables among the independent variables. DW test is carried out by making hypotheses:
1. H0 : autocorellation exists ( r = 0 ).
2. H1 : autocorellation does not exist ( r ≠ 0 ).
Basis for decision making is as follows (Widarjono, 2005): a. If 0 DW DL, then there is positive autocorrelation b. If DL DW DU, then then the test is inconclusive c. If DU DW DU, then there is no autocorrelation d. If 4- DU DW 4-DL, then the test is inconclusive e. If DW 4-DL, then there is negative autocorrelation. Description: DL = lower limit DW
32 d. Heteroskedasticity test
Heteroskedasticity test aims to examine whether there is inequality residual variance from one observation to another observation in a regression model. Heteroskedasticity situation will lead to an inefficient assessment of regression coefficients and the results estimated could be less or more than is supposed. Thus, in order not to mislead the coefficient of the regression coefficients, then the Heteroskedasticity situation must be removed from the regression model. One way to identify the heteroskedasticity problem is by looking at the graph plot between the predicted value of the dependent variable (ZPRED) with residual (SRESID) (Ghozali, 2011).
3.5.13 Hypothesis Testing
The hypotheses are tested using the following process: 1. Formulate the hypothesis
The null and alternaltive hypothesis are as follows:
a. H01 : VACA doesn’t positively affect the value of mining company
Ha1 : VACA positively affects the value of mining company
b. H02 : VAHU doesn’t positively affect the value of mining company
Ha2 : VAHU positively affects the value of mining company
c. H03 : STVA doesn’t positively affect the value of mining company
Ha3 : STVA positively affects the value of mining company
d. H04 : CSR doesn’t positively affect the value of mining company
Ha4 : CSR positively affects the value of mining company
e. H05 : Institutional ownership doesn’t positively affect the value of
mining company
Ha5 : Institutional ownership positively affects the value of mining
company
f. H06 : Independent commisioner doesn’t positively affect the value of
mining company
Ha6 : Independent commisioner positively affects the value of mining
33
g. H07 : Audit commitee doesn’t positively affect the value of mining
company
Ha7 : Audit commitee positively affects the value of mining company
h. H08 : Managerial ownership doesn’t positively affect the value of
mining company
Ha8 : Managerial ownership positively affects the value of mining
company 2. Select an appropriate test
The hypothesis in this study is tested using t-test to examine whether independent variables partially affect the dependent variable Determine the Level of Significance. Level of significance expected is α= 5% with confidence level=95%
3. Calculate t-test
4. Determine Probability value/ critical value 5. Compare probability with α and make conclusion
The criteria to take the conclusion in this study are as follows: a. If p value > α then H0 is accepted and Ha is rejected
b. If p value < α then H0 is rejected and Ha is accepted
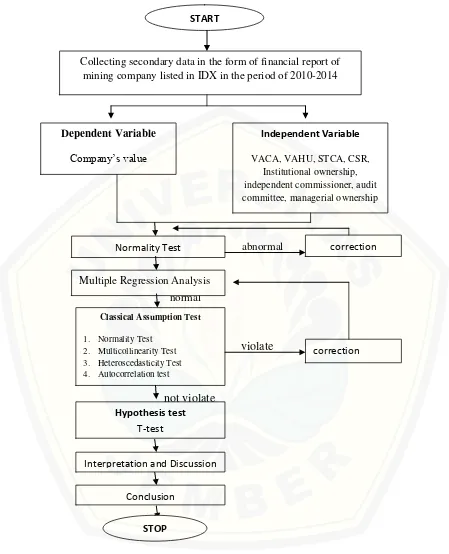
3.6Problem Solving Framework
34
abnormal
normal
violate
not violate
Figure 2.2 Problem Solving Framework START
Collecting secondary data in the form of financial report of mining company listed in IDX in the period of 2010-2014
Dependent Variable
Company’s value
Independent Variable
VACA, VAHU, STCA, CSR, Institutional ownership, independent commissioner, audit committee, managerial ownership
Normality Test
Multiple Regression Analysis
Classical Assumption Test
1. Normality Test 2. Multicollinearity Test 3. Heteroscedasticity Test 4. Autocorrelation test
5.
Hypothesis test T-test
Interpretation and Discussion Conclusion
STOP
correction
35 Description:
1. The research is started
2. This research is begun by collecting secondary data from IDX in the form of mining company’s financial report listed in IDX period 2010-2014.
3. Calculating all observed variables using SPSS 4. Running normality test from obtained data
5. If the data is normal, te next step is running multiple regression analysis. But if the data is not normal, we should correct it and run normality test again.
6. To make the regression model fulfill Best Linear Unbiased Estimator (BLUE) criteria, the next step is running classical assumption test. If the model violates BLUE criteria, we should correct it and run regression again.
7. After the regression model fulfill BLUE criteria, the next step is run hypothesis test using F-test and T-test
8. After we get the analysis result, the next step is discussion or explanation of it
57
CHAPTER 5. CONCLUSION AND SUGGESTION
5.1 Conclusion
This study aims to analyze the effect of value added capital employed, value added human capital, value added structural capital, corporate social responsibility disclosure, independent commissioner, managerial ownership, audit committee, and institutional ownership on the value of mining companies listed in Indonesia Stock Exchange period 2010-2014. Fifteen companies are elected as samples. The conclusion according to hypotheses testing is as follow:
1. Value Added Capital Employed (VACA) positively and significantly affects the company’s value.
2. Value Added Human Capital (VAHU) positively and significantly affects the company’s value.
3. Structural Capital Value Added (STVA) has positive but insignificant effect on the company’s value.
4. Corporate Social Responsibility (CSR) has positive but insignificant effect on the company’s value.
5. Independent commissioner has positive but insignificant effect on the company’s value.
6. Managerial ownership has negative but insignificant effect on the company’s value.
7. Audit commitee has negative but insignificant effect on the company’s value.
58
5.2 Suggestion
Based on the result of hypotheses testing, analysis, and limitations, the suggestions proposed are as follow:
1. For mining companies
Companies are expected to figure out the information of this study results and understand about the factors that can affect the company’s value, those are intellectual capital and GCG. This action can be fundamental for making decision.
2. For investor
Investors or potential investors are expected to understand the result of this study and figure out the other factors that can affect the company’s value, so that it can be such a base before deciding an investment.
3. For academics and next researchers
This study needs to be followed up by next researchers to gain better result, it can be done by :
a. Extending the period of data
b. Using other proxies to explain the variables better, such as a proxy that covers all of human capital, structural capital, and relational capital for measuring intellectual capital. So the research and development expenditures can be included in the calculation. CSR is better done by measuring not only environmental aspect, but also economic and social performance. GCG is also better done by using GCG scorecard.
59
ACKNOWLEDGEMENT
Abukosim, Mukhtaruddin, Ferina, and Nurcahya. 2014. “Ownership Structure and Firm Values: Empirical Study On Indonesia Manufacturing Listed Companies”. Journal of Arts, Science & Commerce, Vol 5, issue 4, pp. 1-14.
Adeneye, Babatunde and Ahmed, Maryam. 2015. “Corporate Social Responsibility and Company Performance”. Journal of Bussiness Studies
Quarterly, Vol. 7, Issues 1, pp. 1-13.
Aldamen, Duncan, Kelly, Namara. And Nagel. 2012. “Audit Committe Characteristics And Fim Performance During The Global Financial Crisis”.
Accounting and Finance Journals, Vol. 52, pp 1-41.
Apriliani, Rizka. 2011. “Pengaruh Intellectual Capital Terhadap Kinerja Keungan Perbankan Syariah di Indonesia”. Thesis. Economics Faculty University of Diponegoro, Semarang.
Ardianto, Elvinaro and Macfudz, Dindin . 2011. Efek Kedermawanan Pebisnis
dan CSR. Jakarta : Elex Media Komputindo.
Setiawan, Aziz . 2015. “Pengaruh Intellectual Capital Terhadap Return On Asset (ROA) Perusahaan (Studi Empiris pada Perusahaan Sektor Pertambangan yang terdaftar di Bursa Efek Indonesia (BEI) Tahun 2007-2012)”. Thesis.
Economics Faculty State University of Yogyakarta.
Baert, Lieven and Rudi Vander Vennet. 2009. Bank Ownership, Firm Value and Firm Capital Structure in Europe. Finess Working Paper D.2.2 page 1-55.
Berzkalne, Irina and Zelgalve, Elvira. 2013. “Intellectual Capital and Company Value”. Procedia- Social and Behavioral Science. Vol. 10, pp 887-896. Bhojraj, Sanjeev and Sengupta, Partha. 2003. “Effect of Corporate Governance on
Bond Ratings and Yields: The Role of Institutional Investors and Outside Directors”. The Journal of Business. Vol. 76, issue 3, pp. 455-476.
Bontis, Nick. 1998. “Intellectual Capital: an Exploratory Study that Develops Measures and Models”. Management Decision. Vol. 36 issue 2, pp. 63–76.
Brigham, Eugene and Gapenski, Louis. 1996. Intermediate Finance Management
(5th ed.). Harbor Drive: The Dryden Press.
60
Market Value and Financial Performance”. Journal of Intellectual Capital.
Vol.6 issue: 2, pp.159 – 176.
Choo, Cun Wei. and Bontis, Nick. 2002. The Strategic Management of Intellectual Capital and Organizational Knowledge. New York: Oxford University Press.
terhadap Kinerja Perusahaan (Studi Empiris pada Perusahaan yang Tercatat di Bursa Efek Indonesia pada Tahun 2005 dan 2006)”
Simposium Nasional Akuntansi XI Pontianak.
Edvinsson, Leif and Sullivan, Patrick. 1996. ‘Developing a model for managing intellectual capital’. European Management Journal. Vol. 14, pp.356–364.
Entika, Nova Lili. 2012. “Pengaruh Elemen Pembentuk Intellectual Capital terhadap Nilai Pasar dan Kinerja Keunagna pada Perusahaan Perbankan yang Terdaftar di BEI”. Diponegoro Journal of Accounting. Vol.1 pp 1-11. FCGI, 2001. Corporate Governance : Tata Kelola Perusahaan 1st Edition.
Jakarta: FCGI.
Fincham, Robin and Roslender, Robin. 2003. "Intellectual Capital Accounting as Management Fashion: A Review and Critique". European Accounting
Review, Taylor & Francis Journals. Vol. 12, issue 4, pp 781-795.
Garay, Urbi and Maximiliano Gonzalez. 2008. "Corporate Governance and Firm Value: The Case of Venezuela". Corporate Governance International
Review, Vol. 16, Issues 16, pp. 194-209.
Gideon, SB Boediono. 2005. Kualitas Laba: Studi Pengaruh Mekanisme Corporate Governance dan Dampak Manajemen Laba dengan Menggunakan Analisis Jalur. Simposium Nasional Akuntansi VIII, IAI, 2005.
Haniyah, Faricha Nurul and Priyadi, Maswar Patuh. 2014. “Pengaruh Intellectual Capital Terhadap Kinerja Perusahaan Otomotif Di Bursa Efek Indonesia”.
Jurnal Ilmu & Riset Akuntansi, Vol. 3 Issues 5 pp 1-15.
61
Ownership And Performance”. Journal of Financial Economics, Vol. 53, pp 353-384.
Husnan, Suad and Pudjiastuti ,Enny. 2012. Dasar-Dasar Manajemen Keuangan. Yogyakarta: UPP AMP YKPN.
Isti, Fadah. 2010. “Faktor Penentu Dividen dan Biaya Keagenan serta Pengaruhnya pada Nilai Perusahaan”. Jurnal Keuangan dan Perbankan. Vol. XIV, issues. 3, pp. 391 -406.
Kamal, M.H.M., Mat, R.C., Rahim, R.A., Husin, N., and Ismail, I.. 2012. “Intellectual Capital and Firm Performance of Commercial Banks in Malaysia” Asian Economic and Financial Review. Vol. 2, Issues. 4, pp. 504-517.
Klein, D.A and Prusak, L. 1994. Characterising Intellectual Capital. Cambridge: Ernst and Young.
Laras, Surya Ramadhani and Basuki, Hadiprajitno. 2012. Pengaruh Corporate
Social Responsibility terhadap Nilai Perusahaan Dengan Prosentase
Kepemilikan Manajemen Sebagai Variabel Moderating Pada Perusahaan Manufaktur Yang Terdaftar di BEI. Jurnal Akuntansi & Auditing Vol. 8/No.2/Mei 2012: 95-189
Malelak, Mariana Ing and Basana, Sautma Ronni. “The Effect of Corporate Governance on Firm Performance: Empirical Evidence from Indonesia”.
Global Journal of Business and Social Science Review, Vol 3, Issues 1, pp
335-342.
Malinda, Dwi Apriliane. 2015. Analisis Faktor-Faktor Yang Mempengaruhi Audit Delay (Studi Empiris Pada Perusahaan Pertambangan yang Terdaftar di Bursa Efek Indonesia Tahun 2008 - 2013). Thesis. Economics Faculty State University of Yogyakarta.
McClave, Benson and Sincich. 2011. Statistik untuk Bisnis dan Ekonomi. Jakarta: Erlangga.
McWilliams, A. and Siegel, D. 2001. “Corporate Social Responsibility: A Theory of the Firm Perspective”. Academy of Management Review. Vol 26 pp. 117-127.
Mueller, Elizabeth and Spitz, Alexandra. 2006. Managerial Ownership and Firm
Performance in German Small and Medium-Sized Enterprises. London:
Centre for Economic Performance.