91
CHAPTER 5
CONCLUSIONS AND IMPLICATIONS
5.1.Introduction
The last chapter discusses about the conclusion of the research findings. Next, this chapter will discuss about the managerial implication to tell what management should do to overcome and avoid consumer confusion dimensions effect on word of mouth, trust and consumer satisfaction. Afterward, part of this chapter discusses about limitation of research during conducting the research. The last part discusses about the suggestions for the next research.
5.2.Conclusions
92
5.2.1. Similarity Confusion
Similarity confusion has significant negative impact on word of mouth, trust and consumer satisfaction. Similar Confusion can be happened when the consumers face me-too products or parity products or similar product. Whenever consumers deal with similarity confusion, they may find difficulty in differentiating the look-alike product and they cannot evaluate the products satisfactorily.
Additionally, when the consumers bought the wrong product, it could create negative consumption experience and it drove consumers dissatisfied with the bad experience. Then as the impact, it induces the decreasing of word of mouth activities since they feel reluctant or embarrassed to share their negative experience. Then, their trust decreases because they cannot make sure the right product. Therefore, the higher similarity confusion induces the lower consumers are involved in word of mouth activities, the lower consumers trust and the higher consumer dissatisfaction.
5.2.2. Overload Confusion
93
bought. They do so because they get confused and do not know which the right information to be trusted. Hence, the higher overload confusion, the lower consumers are involved in word of mouth activities and also the lower consumer trust.
Subsequently, consumers can be dissatisfied from the overload information. Overload information leads them buying wrong product or postpone their purchasing as the impact. The impact of their dissatisfaction is caused by their capacity to hold the information is limited so that they can experience losing information and fading information. Thus, the higher overload confusion, the higher consumer dissatisfaction.
5.3.Managerial Implications
Consumer’s confusion is an issue that should be concerned by manufactures. Sometimes manufactures only focus intensively on how to get the product sold and producing new products to compete the competitors without thinking about inter-brands different and product information in the market place. Thus, it seems manufactures do not think about the consumer interest, want and needs. They force their marketplace to receive their new products to compete other brands or other manufactures in order to attract the consumer attention. So, no wonder, there are product similarity, overload information and ambiguity information.
94
confusion drives decreasing of consumer word of mouth activity, trust and satisfaction decreasing. Hence, this research gives insights that consumer behavior should be understood by manufactures. Then, to overcome consumer confusions, marketers can assess their customer by using consumer confusion scale developed to make more informed their decisions. There some suggestions to help manufactures to overcome consumer confusion related to its behavioral consequences, they are:
a. Word of Mouth
In the business world word of mouth has strong impact on consumer purchase behavior (Mowen, 1994). Word of mouth can help to promote the products more effectively. Then, when consumers are involved in less word of mouth activities due to similar products and information overload, it means that the manufactures lose its medium to spread their product information.
95
b. Trust
Smartphone products are continuous innovations because they change every time in line with the competitive environment and the products come from the improvement. Trust is the key to face rapid changing competitive environment that forced business marketing manufactures to be more creative and flexible to meet the competition (Doney and Canon, 1997). So, fierce competition environment has resulted in similar product (decreasing inter-brand difference), much information about the product flows everywhere, and ambiguous information is created in the market because of mazy information.
Therefore to overcome these impacts, the manufactures should keep good relation with the consumers by being honest and reliable in presenting their products to the consumers. Then, manufactures and also the sale person should manage customer relationship when doing product promotion by providing valuable information and reliable public speaker. Then valuable information and the consultation to members of the buying center can extent the consumer reliance (Doney and Canon, 1997).
c. Consumer Satisfaction
96
manufactures can build brand loyalty to the consumers even though there are many similar product from others manufactures. Then, manufactures can build the positive word of mouth. Subsequently, good quality can overcome bad rumor that lead consumers get confused to the products. Whenever promoting the brands, the information delivered by using advertisement through some media should be clear. Beside that, product information should be proven by demonstrating the product performance so that it can attract the consumers and fulfill the expectation of the consumers to the product.
5.4.Limitations of Research
In this research there were some limitations. The limitation bordered the research because unconditional situation and the weaknesses during conducting the research. The limitations of this research as follows:
non-97
probability sampling methods lead the results may have limited generalizability.
5.4.2. In the questionnaire, it would be better to ask the time when they bought their smarphone because it could straighten out their perceptions about purchasing a smartphone. From the average of the respondents answer they tended to use their present perception about their experience in purchasing smartphone in which different from their previous experience in purchasing smartphone. As the impact from the average of consumer confusion answer they tend to be neutral in answer the question.
5.4.3. This research was conducted in Daerah Istimewa Yogyakarta and the product context (smartphones) may also limit its generalizability. Furthermore, non-probability sampling method and student samples usage may have limited generalizability.
5.4.4. Furthermore, this research drew 150 respondents. The number of respondents may not cover all university students in Yogyakarta. Because of the time limitation in collecting respondents led the author drew available respondents that met the qualification. Therefore the real condition might not fit with the result in this research and it can lead low response rate.
98 5.5.Suggestions
Ambiguity Confusion has insignificant result and it does not influence word of mouth activities, trust and consumer satisfaction. Therefore, for further research, it might need deeper research to measure ambiguity confusion in Indonesia. By doing so it can help to approve that ambiguity confusion affect on word of mouth, trust and consumer satisfaction in Indonesia.
This research found different result caused by different culture between German and Indonesian. So, Leek and Kun (2006), Walsh et al. (2007), and Walsh and Mitchell (2010) recommended similar research in a different cultural context. Moreover, it is interesting and necessary to examine consumer confusion by using different research context such as cultural setting, product choice (or services), and sample composition (i.e. age and gender) to find distinct empirical result.
99
REFERENCES
“RIM Launches New OS, Handsets”, The Jakarta Post, 18 August 2011, http://www.thejakartapost.com/, accessed on 15 September 2011. “Definition of a Smartphone”, PDX Web Pross, accessed from
www.smartphonebasics.com, accessed on 12 January 2012.
“Smartphone”, WebFinance, Inc.,
http://www.businessdictionary.com/definition/smartphone.html, accessed on 12 January 2012.
“What Makes a Smartphone Smart?”, TechTarget,
http://searchmobilecomputing.techtarget.com, accessed on 12 January 2012.
Galih, B. and Ngazis A. N., (2012), “Penetrasi Internet Mobile RI dalam Angka”, Vivanews, 22 Maret 2012, http://teknologi.vivanews.com, accesed on 30 Appril 2012.
Beer, E.J., (2003), “High and Low Context”, Communicating Across Cultures, accsessed from http://www.culture-at-work.com/highlow.html, on 11 January 2012.
Cassavoy, L., (2012), “What Makes a Smartphone Smart?”, About.com, http://cellphones.about.com, accessed on 12 January 2012.
100
Darmawan, I. and Abbdinna, F., (2011), “Mayoritas Netter Indonesia Akses via Ponsel”, Vivanews, 2 Appril 2011, vivanews.com, accessed on 10 December 2011.
Devereaux, M.O. and Johansen, R., (1994), “Transcending Cultural Barriers: Context, Relationships, and Time”, Citation from A Multicultural Perspective: Transcending the Barriers of Behavior and Language, in
Globalwork: Bridging Distance, Culture, and Time (Jossey-Bass) that
downloaded from Tomorrow's Professor listserv, http://www.csub.edu, accessed on 23 January 2012.
Doney, P.M. and Cannon, J.P., (1997), “An Examination of the Nature of Trust in Buyer-seller Relationships”, Journal of Marketing, Vol. 61 No. 2, pp. 35-51.
Engel, J. F., Blackwell, R. D., and Miniard, P. W., (1990), Consumer Behavior, 6th Edition, The Dryden Press, Orlando, FL.
Fabiano, R., (2009), “Tough Competition in Smartphone Business”, The Jakarta Post, 20 October 2009, thejakartapost.com, accessed on 15 September 2011.
Feick, L.F. and Price, L.L., (1987), “The Market Maven: A Diffuser of Marketplace Information”, Journal of Marketing, Vol. 51, January, pp. 83-97.
101
Foxman, E.R., Berger, P.W. and Cote, J.A. (1992), “Consumer Brand Confusion: A Conceptual Framework”, Psychology and Marketing, Vol. 9, March-April, pp. 123-40.
Gliem, J. A. and Gliem, R. R., (2003), “Calculating, Interpreting, and Reporting Cronbach’s Alpha Reliability Coefficient for Likert-Type Scales”, Midwest Research to Practice Conference in Adult, Continuing, and
Community Education, The Ohio State University, Columbus, OH, October 8-10, 2003.
Greenleaf, E.A. and Lehmann, D.R., (1995), “Reasons for Substantial Delay in Consumer Decision Making”, Journal of Consumer Research, Vol. 22, pp. 186-99.
Hendry, (2011), “Tabel Distribusi R (Two Tail)”, TEORI-ONLINE, 12 February 2011, http://teorionline.wordpress.com/, accessed on 12 October 2011. Hofstede, G., (2012), “National Cultures and Countries”, Itim International,
http://geert-hofstede.com, accessed on 11 January 2012.
Huffman, C. and Kahn, B. E. (1998), “Variety for Sale: Mass Customization or Mass Confusion?”, Journal of Retailing, Vol.74 No. 4, pp. 491-513. Karina, S., (2011), “Nokia Masih Kuasai 41% Pasar Smartphone di Indonesia”,
Okezone, 15 November 2011, Okezone.com, accessed on 4 January 2012.
102
Lau, Geok Theng and Sook, Han Lee, (1999), "Consumers’ Trust in a Brand and the Link to Brand Loyalty”, Journal of Market Focused Management, Vol. 4, pp. 341 -370.
Leek, S. and Kun, D., (2006), “Consumer Confusion in the Chinese Personal Computer Market”, Journal of Product and Brand Management, Vol. 15, No. 3, pp.184-193.
Levine, D. M., Stephan, D. F., Krehbiel, Timothy C., and Berenson, Mark L., (2008), Statistics for Managers Using Microsoft® Excel, 5th Edition, Prentice-Hall International, Inc., Upper Saddle River, NJ.
Masna, A., (2011), “Ekosistem Adalah Kunci Dalam Industri Mobile dan Nokia Memiliki Elemen yang Tepat untuk Mengambil Peran”, Indonesian Tech-Startup Media, 26 November 2011, Tech-Startup.com, accessed on 5 January 2012.
Miller, G. A., (1955), “The Magical Number Seven, Plus or Minus Two Some Limits on Our Capacity for Processing Information”, Psychological Review © by the American Psychological Association,Vol. 101, No. 2, pp. 343-352.
Miller, L., Kilian, T., Mitchell, V.W. and Walsh, G., (2010), “Measuring
Consumer Vulnerability to Perceived Product-Similarity Problems
103
Mo, Y., Walsh, G. and Mitchell, V. W., (2005), “Towards a Conceptual Model of Consumer Confusion”, Advances in Consumer Research, Vol. 32 No 1, pp.143-150.
Mowen, J.C., (1987), Consumer Behavior, Macmillan Publishing Company, a division of Macmillan, Inc., New York, NY.
Mowen, J. C., (1995), Consumer Behavior, 4th Edition. Prentice-Hall, Inc., Englewood Cliffs, NJ.
Rulistia, N. D., (2011), Young people ditch dailies for online news, The Jakarta Post, 12 June 2011, http://www.thejakartapost.com/, accessed on 20 September 2011.
Schiffman, L.G and Kanuk, L. L., (2010), Consumer Behavior, 10th Edition. Pearson Education, Inc., Upper Saddle River, N J.
Schweizer, M., Kotouc, A. J. and Wagner, T., (2006), “Scale Development for Consumer Confusion”, Advances in Consumer Research, Vol. 33, pp. 184-190.
Sekaran, U., (1992), Research Methods For Business A Skill Building Approach, Second Edition, John Wiley & Sons, Inc., Canada.
Spreng, R.A. and Mackoy, R.D., (1996), “An Empirical Examination of A Model of Perceived Service Quality and Satisfaction”, Journal of Retailing, Vol. 72 No. 2, pp. 201-14.
104
Sunny, J., (2011), “Top 10 Best SmartPhones”, Top 10 of All, top10ofall.com, accessed on 12 January 2012.
SURVEYMONKEY, (2009), Response Rates & Surveying Techniques, Tips to Enhance Survey Respondent Participation.
Tavakol, M. and Dennick, R., (2011), “Making sense of Cronbach’s alpha”, International Journal of Medical Education, Vol.2, pp 53-55.
Turnbull, P. W., Leek, S., and Ying, G., (2000), “Customer Confusion: The Mobile Phone Market”, Journal of Marketing Management, vol.16, pp. 143-163.
Walsh, G., Hennig-Thurau, T., and Mitchell, V.W., (2007), “Consumer Confusion Proneness: Scale Development, Validation, and Application”, Journal of Marketing Management, Vol. 23 No. 7-8, pp. 697-721.
Walsh, G. and Mitchell, V. W., (2010), “The Effect of Consumer Confusion Proneness on Word of Mouth, Trust, and Customer Satisfaction”, European Journal of Marketing, Vol. 44 No. 6, pp. 838-859
Wilkie, W. L., (1994), Consumer Behavior, 3rd Edition, John Wiley & Sons, Inc., Canada
Yahoo! and TNS, (2010), “Digital Indonesia 2010”, Yahoo!- TNS Net Index Highlights, Jakarta, Indonesia: Yahoo! Southeast Asia Pte. Lnd and TNS Indonesia.
105
106
Appendix1: Questionnaires in English Version
Questionnaire Research:
The Effect of Consumer Confusion Proneness on Word of Mouth, Trust, and Customer Satisfaction from the Case of Smartphone
This questionnaire is made as a tool to find data, facts, and information to complete Thesis in Atma Jaya University. Before going to the list of statements that should be filled, you are asked to fill the respondent’s profile to get demographic data stated bellow:
Sex : Female / Male (**circled)
University :
Level of Study :
□
S1□
S2□
S3 (ticked (√)) Smartphone you have :(For example: Blackberry torch, Samsung galaxy II, Nokia E72, Iphone 4s,dll )
Based on your experience as the customers or the consumers of Smartphone, you are expected to fill the table by giving tick (√) to one of the statement scales. Twelve statements are used to measure customers’ confusion proneness traits (similarity, overload, and satisfaction). The scale for every statement:
products it is often difficult to detect new products. 2. advertisement, but cannot identify it clearly between scores of similar products.
4. I do not always know exactly which Smartphone meet my needs best.
5. There are so many Smartphone brands to choose from that I sometime feel confused.
6. Owing to the host of stores it is sometimes difficult to decide where to shop.
7. Most Smartphone brands are very similar and are therefore hard to distinguish.
107
When purchasing certain Smartphone, I feel uncertain as to product features that are particularly important for me.
12.
When purchasing certain Smartphone, I need the help of sales personnel to understand differences between products.
Next, you are asked to give tick (√) in the column given to one of the statement scales. The range of the scale is 1-5 (Strongly disagree –strongly agree). 10 (ten) statements are used to measure the consumers’ word of mouth, trust and satisfaction as the outcome variables.
1 = strongly disagree
Smartphone to my friends.
2. I like helping people by providing them with information about many kinds of Smartphone products.
3. People ask me for information about Smartphone products, places to shop, or sales.
4. If someone asked me where to get the best buy on several types of Smartphone products, I could tell him where to shop.
5. My friends think of me as a good source of information when it comes to new Smartphone products or sales.
6. Think about a person who has information about a variety of Smartphone products and likes to share this information with others. This person knows about new Smartphone products, sales, stores, and so on, but not necessarily feel he or she is an expert on one particular product. How well you say this description fits you?
7. In general, I trust the Smartphone products I buy. 8. In general, I trust the manufacturers of the
108 9. In general, I trust the store personnel that sell me
Smartphone products.
109
Appendix1: Questionnaires in Indonesia Version
Angket Penelitian:
The Effect Of Consumer Confusion Proneness On Word of Mouth, Trust, and Customer Satisfaction From The Case of Smartphone
Kuesioner ini dibuat sebagai alat untuk mencari data, fakta, dan informasi untuk menyelesaikan Skripsi di Universitas Atma Jaya. Sebelum menuju ke daftar pernyataan yang harus diisi, anda diminta untuk mengisi profil responden untuk mendapatkan data demografis yang ada di bawah ini:
Jenis Kelamin : Perempuan / Laki-laki (**lingkari)
Asal Universitas :
Pendidikan yang sedang ditempuh :
□
S1□
S2□
S3 (beri tanda centang (√)) Smartphone yang anda memiliki :(misalnya: Blackberry torch, Samsung galaxy II, Nokia E72, Iphone 4s,dll )
Berdasarkan pengalaman anda sebagai pelanggan atau konsumen Smartphone, anda diharapkan untuk mengisi tabel yang tersedia dengan memberikan centang (√) ke salah satu skala pernyataan. 12 (dua belas) pernyataan ini digunakan untuk mengukur dimensi kebingungan pelanggan (kesamaan, kelebihan, dan kepuasan). Skala untuk setiap pernyataan:
1 = sangat tidak setuju 2 = tidak setuju 1. Karena banyak produk smartphone yang mirip sehingga
sangat sulit mendeteksi produk smartphone yang baru. 2.
Beberapa produk smartphone tampak sangat mirip sehingga sulit memastikan apakah merek-merek tersebut dibuat oleh produsen yang sama.
3.
Kadang-kadang saya ingin membeli smartphone tetapi saya tidak bisa membedakan berbagai macam smartphone yang teriklankan.
4. Saya tidak selalu tahu dengan persis produk smartphone yang paling mampu memenuhi kebutuhan saya.
5. Terlalu banyak merek smartphone yang beredar, sehingga kadangkala saya bingung memilihnya.
6.
Terlalu banyak toko yang menjual smartphone, sehingga kadangkala saya sulit memutuskan tempat untuk membeli smartphone.
110
Berikutnya, Anda akan diminta untuk memberikan tanda centang (√) pada kolom yang diberikan ke salah satu skala pernyataan. 10 (sepuluh) pernyataan ini digunakan untuk mengukur kata konsumen dari mulut ke mulut (Word of Mouth), kepercayaan dan kepuasan sebagai varibel akibat. Skala untuk
setiap pernyataan:
1 = sangat tidak setuju 2 = tidak setuju 1. Saya suka memperkenalkan merek Smartphone dan
produk Smartphone baru kepada teman-teman saya 2. Saya suka membantu orang dengan menyediakan
informasi tentang berbagai jenis produk Smartphone. 3. Orang-orang meminta informasi kepada saya tentang
produk, tempat belanja, dan toko yang menjual smartphone.
4. Jika seseorang menanyakan tempat terbaik untuk membeli berbagai jenis produk smartphone saya bisa memberitahukan mereka.
5. Teman-teman menganggap saya sebagai sumber informasi yang baik tentang produk atau penjualan Smartphone baru.
6. Coba anda bayangkan seseorang yang memiliki informasi tentang berbagai macam produk smartphone dan ingin berbagi info tersebut dengan orang lain, orang tersebut memahami produk, penjualan, dan toko smartphone, namun dia belum tentu menganggap dirinya pakar tentang produk tertentu. Apakah diskripsi di atas menggambarkan diri anda?
8. Produk Smartphone memiliki begitu banyak fitur sehingga tidak mungkin membandingkan antar merek.
9.
Informasi yang saya dapatkan dari iklan sering samar atau tidak jelas sehingga sulit bagi saya untuk mengetahui produk Smartphone apa yang benar-benar dapat bekerja dengan baik.
10. Ketika membeli produk Smartphone saya jarang merasa mendapatkan informasi yang memadai.
11. Saya merasa sulit memastikan fitur produk yang benar-benar penting bagi saya.
12.
111 7. Secara umum, saya mempercayai produk Smartphone
yang saya beli.
8. Secara umum, saya mempercayai produsen dari produk Smartphone yang saya beli.
9. Secara umum, saya mempercayai karyawan toko yang menjual produk Smartphone kepada saya.
112
Appendix2: Data Collection
Demographic Data
Respondents Age Gender Universities
Level of Study
Faculty Course Major Batch Smartphones
1 20-24 Male Atmajaya S1 Economy IBMP 2008 Iphone 3GS
2 20-24 Male Atmajaya S1 Economy IBMP 2008 Blackberry Curve 8520
3 20-24 Male Atmajaya S1 Economy IBMP 2008 Blackberry Torch
4 20-24 Female Atmajaya S1 Economy Accounting 2009 Samsung Galaxy Ace
5 20-24 Female Atmajaya S1 Economy Accounting 2009 Nokia E72
6 20-24 Female Atmajaya S1 Economy Accounting 2008 Sony Ericsson Xperia X8
7 20-24 Female Atmajaya S1 Economy Accounting 2008 Sony Ericsson Xperia X10
8 20-24 Female Atmajaya S1 Economy Management 2008 Samsung Galaxy Gio
9 20-24 Male Atmajaya S1 Economy Accounting 2009 Iphone 3GS
10 15-19 Male Atmajaya S1 Economy Accounting 2010 Nokia N97
11 20-24 Female Atmajaya S1 Economy Accounting 2008 Blackberry Gemini
12 20-24 Female Atmajaya S1 Economy IBMP 2008 Blackberry Torch
13 20-24 Female Atmajaya S1 Economy IBMP 2008 Blackberry Javelin
14 20-24 Male Atmajaya S1 Economy Accounting 2008 Blackberry Gemini
15 20-24 Male Atmajaya S1 Economy IFAP 2008 Iphone 3GS
16 20-24 Female Atmajaya S1 Economy IFAP 2008 Blackberry Bold
113
Respondents Age Gender Universities
Level of Study
Faculty Course Major Batch Smartphones
18 20-24 Male Atmajaya S1 Economy IBMP 2008 LG Optimus 2X
19 15-19 Female Atmajaya S1 Economy IBMP 2010 Blackberry Storm
20 20-24 Female Atmajaya S1 Economy IFAP 2008 Blackberry Javelin
21 15-19 Female Atmajaya S1 Economy IBMP 2010 Nokia 5800 Xpress Music
22 15-19 Female Atmajaya S1 Economy IBMP 2010 Blackberry Onyx II
23 15-19 Female Atmajaya S1 Economy Management 2010 Nokia N8
24 20-24 Female Atmajaya S1 Economy Management 2009 Blackberry Javelin
25 20-24 Female Atmajaya S1 Economy Accounting 2008 Samsung Galaxy Mini
26 20-24 Female Atmajaya S1 Economy Accounting 2008 Samsung Galaxy Fit
27 20-24 Female Atmajaya S1 Economy IBMP 2008 Nokia E71
28 20-24 Male Atmajaya S1 Economy Accounting 2008 Samsung Galaxy SII
29 15-19 Female Atmajaya S1 Economy Management 2011 Blackberry Bold
30 15-19 Female Atmajaya S1 Economy Accounting 2010 Blackberry Storm
31 20-24 Female Atmajaya S1 Economy IBMP 2008 Blackberry Torch
32 20-24 Male Atmajaya S1 Economy Accounting 2009 Nokia X5
33 15-19 Female Atmajaya S1 Economy IFAP 2010 Blackberry Storm
34 20-24 Female Atmajaya S1 Economy IBMP 2011 Blackberry Torch
35 15-19 Female Atmajaya S1 Economy IBMP 2011 Blackberry Storm
36 15-19 Female Atmajaya S1 Economy Management 2011 Blackberry Torch
114
Respondents Age Gender Universities
Level of Study
Faculty Course Major Batch Smartphones
Engineering
38 20-24 Female Atmajaya S1
Social Sciences and Political Science
Communication 2009 Blackberry Gemini
39 20-24 Male Atmajaya S1
Social Sciences and Political Science
Communication 2008 Samsung Galaxy Ace
40 20-24 Female Atmajaya S1
Social Sciences and Political Science
Communication 2008 Blackberry Bold
41 20-24 Female Atmajaya S1
Social Sciences and Political Science
Communication 2008 Samsung Galaxy S
42 20-24 Female Atmajaya S1
Social Sciences and Political Science
Communication 2008 Blackberry Storm
43 20-24 Female Atmajaya S1 Social
115
Respondents Age Gender Universities
Level of Study
Faculty Course Major Batch Smartphones
Political Science
44 20-24 Male Atmajaya S1 Economy Accounting 2007 Blackberry 9530
45 20-24 Male Atmajaya S1 Economy Management 2007 Nokia E63
46 20-24 Male Atmajaya S1 Engineering Architecture 2009 Samsung Galaxy Ace
47 20-24 Male Atmajaya S1 Economy IBMP 2007 Nokia E71
48 20-24 Male Atmajaya S1 Engineering Architecture 2008 Blackberry Onyx II
49 20-24 Male Atmajaya S1 Economy Accounting 2008 Blackberry Onyx II
50 30-34 Female Atmajaya S1 Engineering Informatics 2005 Nokia E72
51 15-19 Female Atmajaya S1 Economy Accounting 2011 Blackberry Bold
52 20-24 Male Atmajaya S1 Economy Accounting 2008 Blackberry Torch
53 20-24 Female Atmajaya S1 Economy Accounting 2008 Blackberry Onyx II
54 20-24 Female Atmajaya S1 Economy Accounting 2008 Samsung Galaxy Ace
55 20-24 Female Atmajaya S1 Economy Accounting 2009 Blackberry 8520
56 20-24 Female Atmajaya S1
Social Sciences and Political Science
Communication 2008 Blackberry Storm
57 20-24 Female Atmajaya S1 Economy IBMP 2008 Blackberry Onyx II
58 20-24 Male Atmajaya S1 Engineering Informatics 2008 Blackberry Bold
116
Respondents Age Gender Universities
Level of Study
Faculty Course Major Batch Smartphones
Engineering
60 15-19 Female Atmajaya S1 Economy Accounting 2010 Nokia E72
61 15-19 Male Atmajaya S1 Engineering Information
systems 2010 Blackberry Bold
62 20-24 Male Atmajaya S1 Engineering Industrial
Engineering 2009 Blackberry 9300
63 20-24 Male Atmajaya S1 Economy Management 2008 Blackberry Onyx II
64 20-24 Female Atmajaya S1 Engineering Industrial
Engineering 2008 Blackberry curve 8520
65 20-24 Female Atmajaya S1 Economy Accounting 2008 Nokia C6
66 20-24 Male Atmajaya S1 Economy Management 2008 Blackberry Storm
67 20-24 Male Atmajaya S1 Economy Accounting 2008 Iphone 3GS
68 20-24 Male Atmajaya S1 Economy Accounting 2005 Nokia 5230
69 20-24 Female Atmajaya S1 Economy Accounting 2008 Blackberry Dakota
70 20-24 Male Atmajaya S1 Economy Accounting 2008 Blackberry Onyx II
71 20-24 Female Atmajaya S1 Economy Economics 2011 Beyond B828
72 15-19 Female Atmajaya S1 Economy Economics 2011 LG Optimus Black P970
73 20-24 Female Atmajaya S1 Economy IBMP 2009 Blackberry Gemini Curve 3G
74 20-24 Female Atmajaya S1
Social Sciences and Political Science
117
Respondents Age Gender Universities
Level of Study
Faculty Course Major Batch Smartphones
75 20-24 Female Atmajaya S1 Economy IBMP 2009 Blackberry Apolo
76 20-24 Female Atmajaya S1 Economy IBMP 2009 Blackberry Javelin
77 20-24 Female Atmajaya S1 Economy Management 2009 Blackberry Onyx II
78 20-24 Female Atmajaya S1 Economy Management 2008 Blackberry Torch
79 20-24 Male Atmajaya S1 Economy IBMP 2008 Blackberry Gemini
80 20-24 Male Atmajaya S1 Economy Accounting 2008 Blackberry 9700
81 20-24 Male Atmajaya S1 Economy Accounting 2008 Samsung Galaxy II
82 20-24 Male Atmajaya S1 Economy Management 2008 Blackberry Storm
83 20-24 Female Atmajaya S1 Economy IFAP 2009 Blackberry Torch
84 20-24 Male Atmajaya S1 Economy IFAP 2009 Iphone 3GS
85 20-24 Female Atmajaya S1 Biotechnology Biology 2011 Blackberry Gemini
86 20-24 Female Atmajaya S1 Economy Management 2008 Blackberry Javelin
87 20-24 Female Atmajaya S1 Economy Management 2008 Blackberry Gemini
88 20-24 Male Atmajaya S1 Economy Accounting 2008 Blackberry Torch
89 20-24 Male Atmajaya S1 Economy IBMP 2008 Blackberry 8520
90 20-24 Male Duta Wacana S1 Engineering Informatics 2006 Iphone 4
91 15-19 Male Duta Wacana S1 Economy Management 2011 Nokia C3
92 15-19 Female Duta Wacana S1 Engineering Informatics 2010 Iphone 3GS
93 20-24 Female Duta Wacana S1 Economy Accounting 2010 Blackberry Gemini
118
Respondents Age Gender Universities
Level of Study
Faculty Course Major Batch Smartphones
95 20-24 Male Duta Wacana S1 Economy Management 2008 LG T 310i
96 20-24 Female Duta Wacana S1 Economy Management 2008 Blackberry Bold
97 20-24 Female Duta Wacana S1 Economy Management 2008 Nokia E72
98 15-19 Male Duta Wacana S1 Economy Management 2010 Blackberry Storm
99 20-24 Male Duta Wacana S1 Economy Management 2008 Sony Ericsson Xperia Active
100 20-24 Male Duta Wacana S1 Economy Management 2008 Samsung Galaxy SL
101 20-24 Male Duta Wacana S1 Economy Accounting 2008 Blackberry Storm
102 20-24 Male Duta Wacana S1 Economy Accounting 2008 Iphone 3GS
103 20-24 Male Duta Wacana S1 Economy Accounting 2008 Blackberry curve
104 20-24 Male Duta Wacana S1 Economy Accounting 2008 Blackberry Storm
105 20-24 Female Duta Wacana S1 Economy Accounting 2008 Samsung Galaxy Mini
106 20-24 Male Duta Wacana S1 Engineering Informatics 2009 Blackberry Gemini
107 20-24 Male Duta Wacana S1 Economy Management 2008 Blackberry Storm
108 15-19 Male Sanata
Dharma S1
Teacher Training and Science Education
Indonesia
Education 2011 Nokia C3
109 15-19 Male Sanata
Dharma S1
Science and Technology
Engineering
Mesin 2011 Blackberry Bold
110 20-24 Female Sanata
119
Respondents Age Gender Universities
Level of Study
Faculty Course Major Batch Smartphones
111 20-24 Female Sanata
Education 2007 Sony Ericsson Xperia X10 Mini
112 20-24 Male Sanata
Dharma S1 Literature
English
Literature 2009 Samsung Galaxy Mini
113 20-24 Male Sanata
Dharma S1 Economy Management 2010 Blackberry Torch
114 15-19 Female Sanata
Dharma S1 Literature
English
Literature 2008 Motorola Moto Q
117 15-19 Female Sanata
Dharma S1 Economy Management 2011 Samsung Champ Duo S
118 20-24 Male Sanata
120
Respondents Age Gender Universities
Level of Study
Faculty Course Major Batch Smartphones
119 15-19 Male Pembangunan
Nasional S1
Mineral technology
Petroleum
Engineering 2010 Nokia C6
120 20-24 Male Pembangunan
Nasional S1
Mineral technology
Petroleum
Engineering 2007 Blackberry 9300
121 15-19 Male Pembangunan
Nasional S1
Mineral technology
Petroleum
Engineering 2010 Blackberry Gemini
122 20-24 Male Pembangunan
Nasional S1
Mineral technology
Petroleum
Engineering 2008 Blackberry Onyx II
123 20-24 Male Pembangunan
Nasional S1
Mineral technology
Petroleum
Engineering 2010 Blackberry Bold
124 20-24 Male Pembangunan
Nasional S1
Mineral technology
Petroleum
Engineering 2008 LG P500
125 15-19 Female Pembangunan
Nasional S1
Mineral technology
Petroleum
Engineering 2009 Blackberry Gemini
126 20-24 Female Pembangunan
Nasional S1
Mineral technology
Petroleum
Engineering 2009 Blackberry Javelin
127 20-24 Male Pembangunan
Nasional S1
Mineral technology
Petroleum
Engineering 2009 Samsung Galaxy Mini
128 20-24 Male Pembangunan
Nasional S1
Mineral technology
Petroleum
121
Respondents Age Gender Universities
Level of Study
Faculty Course Major Batch Smartphones
129 20-24 Female Pembangunan
Nasional S1
Mineral technology
Petroleum
Engineering 2008 Blackberry Storm
130 15-19 Male Pembangunan
Nasional S1
Mineral technology
Petroleum
Engineering 2010 Blackberry 9550
131 20-24 Female Pembangunan
Nasional S1
Mineral technology
Petroleum
Engineering 2008 Blackberry Gemini
132 20-24 Female Pembangunan
Nasional S1
Mineral technology
Petroleum
Engineering 2008 Blackberry Pearl 8200
133 20-24 Male Pembangunan
Nasional S1
Mineral technology
Petroleum
Engineering 2008 Iphone 3GS
134 20-24 Male Pembangunan
Nasional S1
Mineral technology
Petroleum
Engineering 2008 Nokia N97
135 20-24 Male Pembangunan
Nasional S1
Mineral technology
Petroleum
Engineering 2008 Blackberry Gemini
136 20-24 Male Pembangunan
Nasional S1
Mineral technology
Petroleum
Engineering 2008 Samsung Galaxy Y
137 20-24 Male Pembangunan
Nasional S1
Mineral technology
Petroleum
Engineering 2009 Blackberry Bold
138 15-19 Female Pembangunan
Nasional S1
Mineral technology
Petroleum
122
Respondents Age Gender Universities
Level of Study
Faculty Course Major Batch Smartphones
139 20-24 Female Pembangunan
Nasional S1
Mineral technology
Petroleum
Engineering 2009 Blackberry Storm
140 20-24 Female Pembangunan
Nasional S1
Mineral technology
Petroleum
Engineering 2008 Blackberry Torch
141 20-24 Male Pembangunan
Nasional S1
Mineral technology
Petroleum
Engineering 2008 Iphone 3GS
142 20-24 Male Pembangunan
Nasional S1
Mineral technology
Petroleum
Engineering 2008 Nokia E72
143 20-24 Female Pembangunan
Nasional S1
Mineral technology
Petroleum
Engineering 2008 Sony Ericsson Experia
144 20-24 Female Pembangunan
Nasional S1
Mineral technology
Petroleum
Engineering 2008 Nokia C3
145 20-24 Male Pembangunan
Nasional S1
Mineral technology
Petroleum
Engineering 2008 Blackberry 8220
146 20-24 Male Pembangunan
Nasional S1
Mineral technology
Petroleum
Engineering 2008 Samsung Galaxy Gio
147 20-24 Male Pembangunan
Nasional S1
Mineral technology
Petroleum
Engineering 2009 Blackberry Bold
148 20-24 Male Pembangunan
Nasional S1
Mineral technology
Petroleum
123
Respondents Age Gender Universities
Level of Study
Faculty Course Major Batch Smartphones
149 20-24 Female Pembangunan
Nasional S1 Engineering Informatics 2006 Blackberry Gemini
150 20-24 Female Pembangunan
Nasional S1
Social Sciences and Political Science
124
Appendix2: Data Collection
Questionnaires Data
Respon
dents
Similarity
confusion Overload confusion Ambiguity Confusion Word of Mouth trust
125 Respon
dents
Similarity
confusion Overload confusion Ambiguity Confusion Word of Mouth trust
126 Respon
dents
Similarity
confusion Overload confusion Ambiguity Confusion Word of Mouth trust
127 Respon
dents
Similarity
confusion Overload confusion Ambiguity Confusion Word of Mouth trust
128 Respon
dents
Similarity
confusion Overload confusion Ambiguity Confusion Word of Mouth trust
129 Respon
dents
Similarity
confusion Overload confusion Ambiguity Confusion Word of Mouth trust
130 Respon
dents
Similarity
confusion Overload confusion Ambiguity Confusion Word of Mouth trust
131 Respon
dents
Similarity
confusion Overload confusion Ambiguity Confusion Word of Mouth trust
132 Respon
dents
Similarity
confusion Overload confusion Ambiguity Confusion Word of Mouth trust
133
Appendix3: Reliability and Validity
Reliability and Validity Scale: Similarity Confusion
Case Processing Summary
N %
Cases Valid 150 100,0
Excludeda 0 ,0
Total 150 100,0
a. Listwise deletion based on all variables in the procedure.
Reliability Statistics Cronbach's
Alpha N of Items
,772 3
Item Statistics
Mean Std. Deviation N
SC1 3,1600 1,08114 150
SC2 3,2333 1,08940 150
SC3 2,9333 1,09708 150
Item-Total Statistics
Scale Mean if Item Deleted
Scale Variance if Item Deleted
Corrected Item-Total Correlation
Cronbach's Alpha if Item
Deleted
SC1 6,1667 3,509 ,656 ,638
SC2 6,0933 3,696 ,586 ,716
SC3 6,3933 3,690 ,579 ,723
Scale Statistics
Mean Variance Std. Deviation N of Items
134 Reliability and Validity
Scale: Overload Confusion
Case Processing Summary
N %
Cases Valid 150 100,0
Excludeda 0 ,0
Total 150 100,0
a. Listwise deletion based on all variables in the procedure.
Reliability Statistics Cronbach's
Alpha N of Items
,750 4
Item Statistics
Mean Std. Deviation N
OC4 3,0400 1,15206 150
OC5 3,3267 1,25584 150
OC6 3,5333 1,12128 150
OC7 2,9267 1,08743 150
Item-Total Statistics
Scale Mean if Item Deleted
Scale Variance if Item Deleted
Corrected Item-Total Correlation
Cronbach's Alpha if Item
Deleted
OC4 9,7867 7,592 ,521 ,706
OC5 9,5000 6,359 ,677 ,611
OC6 9,2933 7,833 ,499 ,717
OC7 9,9000 8,010 ,493 ,721
Scale Statistics
Mean Variance Std. Deviation N of Items
135 Reliability and Validity
Scale: Ambiguity Confusion Case Processing Summary
N %
Cases Valid 150 100,0
Excludeda 0 ,0
Total 150 100,0
a. Listwise deletion based on all variables in the procedure.
Reliability Statistics Cronbach's
Alpha N of Items
,627 5
Item Statistics
Mean Std. Deviation N
AC8 3,0333 ,95127 150
AC9 3,5067 1,00833 150
AC10 2,9800 ,97945 150
AC11 3,0933 1,07658 150
AC12 3,5000 1,09759 150
Item-Total Statistics
Scale Mean if Item Deleted
Scale Variance if Item Deleted
Corrected Item-Total Correlation
Cronbach's Alpha if Item
Deleted
AC8 13,0800 8,061 ,287 ,615
AC9 12,6067 7,140 ,438 ,544
AC10 13,1333 7,740 ,333 ,595
AC11 13,0200 6,906 ,433 ,544
AC12 12,6133 6,950 ,408 ,558
Scale Statistics
Mean Variance Std. Deviation N of Items
136 Reliability and Validity
Scale: Word of mouth
Case Processing Summary
N %
Cases Valid 150 100,0
Excludeda 0 ,0
Total 150 100,0
a. Listwise deletion based on all variables in the procedure.
Reliability Statistics Cronbach's
Alpha N of Items
,797 5
Item Statistics
Mean Std. Deviation N
WOM1 2,7600 1,03418 150
WOM2 3,2867 ,98537 150
WOM3 3,0267 ,98271 150
WOM4 3,1933 ,96723 150
WOM5 2,8733 1,01199 150
Item-Total Statistics
Scale Mean if Item Deleted
Scale Variance if Item Deleted
Corrected Item-Total Correlation
Cronbach's Alpha if Item
Deleted
WOM1 12,3800 9,499 ,490 ,786
WOM2 11,8533 8,824 ,666 ,730
WOM3 12,1133 9,282 ,575 ,759
WOM4 11,9467 9,380 ,570 ,760
WOM5 12,2667 9,056 ,593 ,753
Scale Statistics
Mean Variance Std. Deviation N of Items
137 Reliability and Validity
Scale: Trust
Case Processing Summary
N %
Cases Valid 150 100,0
Excludeda 0 ,0
Total 150 100,0
a. Listwise deletion based on all variables in the procedure.
Reliability Statistics Cronbach's
Alpha N of Items
,726 3
Item Statistics
Mean Std. Deviation N
T7 3,8800 ,75902 150
T8 3,6333 ,73655 150
T9 2,9800 ,77260 150
Item-Total Statistics
Scale Mean if Item Deleted
Scale Variance if Item Deleted
Corrected Item-Total Correlation
Cronbach's Alpha if Item
Deleted
T7 6,6133 1,621 ,584 ,594
T8 6,8600 1,517 ,698 ,454
T9 7,5133 1,903 ,388 ,824
Scale Statistics
Mean Variance Std. Deviation N of Items
138
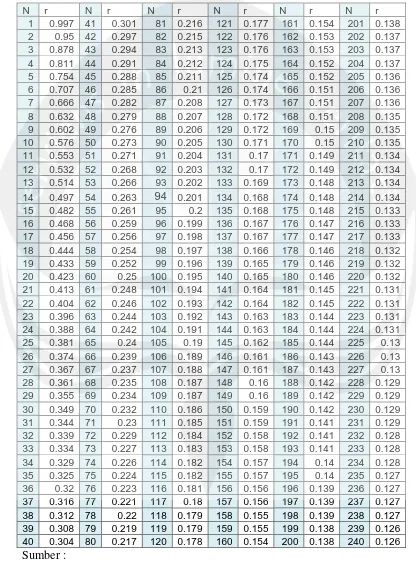
Appendix4: Table Distribution
Sumber :
• http://teorionline.wordpress.com/
139
Appendix5: Regression Regression for Word of Mouth
Variables Entered/Removedb
Model Variables Entered Variables Removed Method
1 Ambiguity Confusion, Overload Confusion, Similarity confusion
. Enter
a. All requested variables entered. b. Dependent Variable: Word of Mouth
Model Summaryb
Model R R Square
Adjusted R Square
Std. Error of
the Estimate
Change Statistics
Durbin-Watson R Square
Change F Change df1 df2
Sig. F Change
1 ,498a ,248 ,233 ,63216 ,248 16,047 3 146 ,000 2,026
a. Predictors: (Constant), Ambiguity Confusion, Overload Confusion, Similarity confusion b. Dependent Variable: Word of Mouth
ANOVAb
Model
Sum of
Squares df Mean Square F Sig.
1 Regression 19,239 3 6,413 16,047 ,000a
Residual 58,345 146 ,400
140
Coefficientsa
Model
Unstandardized Coefficients
Standardized Coefficients
t Sig. B Std. Error Beta
1 (Constant) 4,277 ,264 16,202 ,000
Similarity confusion -,174 ,096 -,218 -1,820 ,071
Overload Confusion -,302 ,095 -,366 -3,192 ,002
Ambiguity Confusion ,079 ,121 ,071 ,655 ,514
a. Dependent Variable: Word of Mouth
Residuals Statisticsa
Minimum Maximum Mean Std. Deviation N
Predicted Value 2,2988 3,7452 3,0227 ,35933 150
Residual -1,68044 1,38336 ,00000 ,62576 150
Std. Predicted Value -2,014 2,011 ,000 1,000 150
Std. Residual -2,658 2,188 ,000 ,990 150
141
Appendix5: Regression Regression for Trust
Variables Entered/Removedb
Model Variables Entered Variables Removed Method
1 Ambiguity Confusion, Overload Confusion, Similarity confusion
. Enter
a. All requested variables entered. b. Dependent Variable: Trust
Model Summaryb
Mod
el R R Square
Adjusted R Square
Std. Error of the Estimate
Change Statistics
Durbin-Watson R Square
Change F Change df1 df2
Sig. F Change
1 ,533a ,284 ,269 ,51972 ,284 19,312 3 146 ,000 2,032
a. Predictors: (Constant), Ambiguity Confusion, Overload Confusion, Similarity confusion b. Dependent Variable: Trust
ANOVAb
Model
Sum of
Squares df Mean Square F Sig.
1 Regression 15,649 3 5,216 19,312 ,000a
Residual 39,436 146 ,270
142
Coefficientsa
Model
Unstandardized Coefficients
Standardized Coefficients
t Sig.
B Std. Error Beta
1 (Constant) 4,619 ,217 21,281 ,000
Similarity confusion -,154 ,079 -,229 -1,956 ,052
Overload Confusion -,279 ,078 -,401 -3,583 ,000
Ambiguity Confusion ,078 ,100 ,083 ,783 ,435
a. Dependent Variable: Trust
Residuals Statisticsa
Minimum Maximum Mean Std. Deviation N Predicted Value 2,8412 4,1579 3,4977 ,32408 150
Residual -1,54342 1,22011 ,00000 ,51446 150
Std. Predicted Value -2,026 2,037 ,000 1,000 150
Std. Residual -2,970 2,348 ,000 ,990 150
143
Appendix5: Regression
Regression for Consumer Satisfaction
Variables Entered/Removedb
Model Variables Entered Variables Removed Method
1 Ambiguity Confusion, Overload Confusion, Similarity confusion
. Enter
a. All requested variables entered.
b. Dependent Variable: Consumer Satisfaction
Model Summaryb
Model R R Square
Adjusted R Square
Std. Error of the Estimate
Change Statistics
Durbin-Watson R Square
Change F Change df1 df2
Sig. F Change
1 ,638a ,407 ,395 ,60323 ,407 33,464 3 146 ,000 2,120
a. Predictors: (Constant), Ambiguity Confusion, Overload Confusion, Similarity confusion b. Dependent Variable: Consumer Satisfaction
ANOVAb
Model
Sum of
Squares df Mean Square F Sig.
1 Regression 36,532 3 12,177 33,464 ,000a
Residual 53,128 146 ,364
144
Coefficientsa
Model
Unstandardized Coefficients
Standardized Coefficients
t Sig.
B Std. Error Beta
1 (Constant) 5,490 ,252 21,793 ,000
Similarity confusion -,242 ,091 -,282 -2,650 ,009
Overload Confusion -,378 ,090 -,426 -4,187 ,000
Ambiguity Confusion ,042 ,116 ,035 ,362 ,718
a. Dependent Variable: Consumer Satisfaction
Residuals Statisticsa
Minimum Maximum Mean Std. Deviation N Predicted Value 2,7063 4,5809 3,6600 ,49516 150
Residual -1,63940 1,41079 ,00000 ,59713 150
Std. Predicted Value -1,926 1,860 ,000 1,000 150
Std. Residual -2,718 2,339 ,000 ,990 150
145
Appendix6: Descriptive Statistics
Descriptive Statistics
N Mean
Similarity confusion 150 3,1091
Overload Confusion 150 3,2067
Ambiguity Confusion 150 3,2227
Word of Mouth 150 3,0227
Trust 150 3,4977
Consumer Satisfaction 150 3,6600