SPATIAL DISTRIBUTION OF NET PRIMARY PRODUCTION
(NPP) USING MODIS DATA AND CORRELATION WITH
CLIMATE VARIABILITY
IFRAN DESTIANTO IMANDA
GRADUATE SCHOOL
BOGOR AGRICULTURAL UNIVERSITY
BOGOR
STATEMENT
I, Ifran Destianto Imanda, here by stated that this thesis entitled
Spatial Distribution of Net Primary Production (NPP) Using MODIS Data
and Correlation with Climate Variability
Is a result of my own work under the supervision advisory board during the period March until October 2010 and that it has not been published ever. The content of the thesis has been examined by the advising the advisory board and external examiner
Bogor, December 2010
Ifran Destianto Imanda
ABSTRACT
IFRAN DESTIANTO IMANDA (2010). Spatial Distribution of Net Primary Production (NPP) Using MODIS Data and Correlation with Climate Variability. Under the supervision of HARTRISARI HARDJOMIDJOJO and IBNU SOFIAN.
Net Primary Production (NPP) flux was estimated based on the monthly data of Moderate Resolution Imaging Spectroradiometer (MODIS) data for 9 years from 2001 to 2009 by using the CASA (Carnegie Ames Stanford Approach) model. Total summed yearly NPP in the Sumatra Island in year 2001 until 2009 are 1414 (g C m-2 yr-1), 1475 (g C m-2 yr-1), 1369 (g C m-2 yr-1), 1399 (g C m-2 yr-1), 1417 (g C m-2 yr-1), 1227 (g C m-2 yr-1), 1510 (g C m-2 yr-1), 1367 (g C m-2 yr-1) and in year 2009, total estimation of NPP is 1404 (g C m-2 yr-1). Meanwhile, the NPP flux within the forest region is ranging from 150 to 400 g C m2 month-1, with the monthly average of NPP flux is 50 to 180 g C m-2 month-1. The effect of inter-annual variation of El Nino is not clearly seen. However the NPP is 106 g C m-2 yr-1 decreases during El Nino period. On the contrary, The NPP is increasing of 283 g C m-2 yr-1 during the La Nina periods. NPP is highly correlated with the Indian Ocean Dipole (IOD). The NPP is the highest in April during the monsoonal transitional period, and decreases to the lowest in September to October during the peak of Australian Monsoon
ABSTRACT
IFRAN DESTIANTO IMANDA (2010). Distribusi spasial Net Primary Production (NPP) menggunakan data MODIS dan keterkaitannya dengan varibilitas iklim. Dibimbing oleh HARTRISARI HARDJOMIDJOJO dan IBNU SOFIAN.
Estimasi Net Primary Production (NPP) berdasarkan data bulanan dari Moderate Resolution Imaging Spectroradiometer (MODIS) selama 9 tahun dari tahun 2001 sampai dengan tahun 2009 dihitung dengan menggunakan pendekatan model CASA (Carnegie Ames Stanford Approach). Jumlah total NPP per-tahun di Pulau Sumatera dari tahun 2001 sampai dengan 2009 adalah 1414 (g C m-2 yr-1), 1475 (g C m-2 yr-1), 1369 (g C m-2 yr-1), 1399 (g C m-2 yr-1), 1417 (g C m-2 yr-1), 1227 (g C m-2 yr-1), 1510 (g C m-2 yr-1), 1367 (g C m-2 yr-1) dan pada tahun 2009, estimasi total NPP adalah 1404 (g C m-2 yr-1). Sementara itu, NPP flux yang berada di area hutan berkisar dari 150 to 400 g C m2 bulan-1, dengan rata-rata bulanan NPP flux
berkisar antara 50 to 180 g C m-2 bulan-1. Pengaruh variasi tahunan dari El Nino tidak terlihat signifikan, akan tetapi terjadi penurunan NPP sebesar 106 g C m-2 yr-1 selama periode El Nino. Sebaliknya, peningkatan NPP terjadi sebesar 283 g C m-2 yr-1 pada periode La Nina. NPP sangat berkaitan dengan fenomena Indian
Ocean Dipole(IOD). Pada periode perubahan monsoonal yang terjadi pada bulan
April NPP berada pada kisaran tertinggi, sedangkan kisaran terendah NPP berada pada bulan September dan Oktober (selama Australian monsoon berada pada masa puncaknya).
SUMMARY
IFRAN DESTIANTO IMANDA (2010). Spatial Distribution of Net Primary Production (NPP) Using MODIS Data and Correlation with Climate Variability. Under the supervision of HARTRISARI HARDJOMIDJOJO and IBNU SOFIAN
The most important global interactions between the biosphere and atmosphere involve the transfer of energy, water, and carbon. Carbon is assimilated by the biosphere through photosynthesis and released through autotrophic and heterotrophic respiration. Net Primary Production (NPP) is the net carbon fixed by vegetation through photosynthesis. NPP provides the carbon required for maintenance of the structure and functions of an ecosystem. NPP can be used in the term of net biomass accumulation to express the net flux of carbon between the atmosphere and terrestrial vegetation. NPP is a fundamental ecological variable, not only because it measures the energy input to the biosphere and terrestrial carbon dioxide assimilation, but also because of its significance in indicating the land surface area and status of a wide range of ecological process.
Study about NPP for tropical forest is very important, because Indonesia is one of the countries located in the tropical area which has large area of tropical forest. Information on net primary production in tropical forests is needed for the development of realistic global carbon budgets, for projecting how these ecosystems will be affected by climatic and atmospheric changes.
The objective of this research is to estimate net primary production (NPP) and annual carbon balance using MODIS imagery over Sumatra terrain during 2001 –2009 and to find correlation between the distribution of NPP and the climate variability especially during El-Nino and La-Nina phenomenon using MODIS imagery over Sumatra terrain.
This research has been conducted in the period March until October 2010. Location of research is over Sumatra terrain. There are several kinds of data used in this research which are monthly data of TERRA MODIS satellite data and meteorological data (monthly temperature and rainfall) acquired by monthly from 2001 up to 2009. The MODIS data were available for free download from the site
ftp://e4ftl01u.ecs.nasa.gov/MOLT/ and also from the site which is;
https://wist.echo.nasa.gov/~wist/api/imswelcome/ and the meteorological data were available for free download from the site
http://www.esrl.noaa.gov/psd/data/gridded/.
Methods of estimating NPP over large areas have been established. NPP in this research was estimated based on the utilization of remote sensing using MODIS data to provide information of the monthly NPP flux, defined as net fixation of CO2 by vegetation, is computed in NASA-CASA (National Aeronautics and Space Administration - Carnegie Ames Stanford Approach) model on the basis of light-use efficiency. Monthly production of plant biomass is estimated as a product of time-varying surface solar irradiance, Sr , and EVI from the MODIS satellite, times a constant light utilization efficiency term (emax) that is
. Total annual NPP in Sumatra Island in year 2001 until 2009 are 1414 (g C m-2 yr-1), 1475 (g C m-2 yr-1), 1369 (g C m-2 yr-1), 1399 (g C m-2 yr-1), 1417 (g C m-2 yr-1), 1227 (g C m-2 yr-1), 1510 (g C m-2 yr-1), 1367 (g C m-2 yr-1) and In year 2009, 1404 (g C m-2 yr-1) in year 2009.
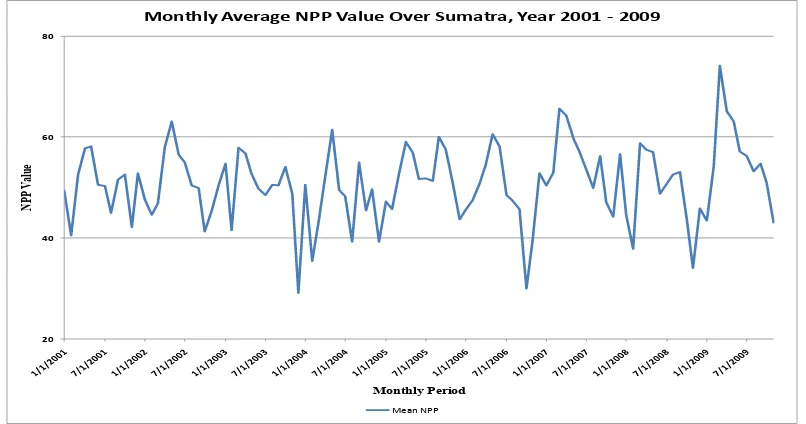
Analysis and estimation of average distribution NPP described information about the correlation between NPP with seasonal effect. In year 2001, 2002, 2004 and 2006, average distribution NPP increased from April to October. However in year 2003 and 2005, 2007, 2008 and 2009 average distribution of NPP increased from January to October. Highest average distribution of NPP during nine-year monitoring occurred in April 2009 with monthly average NPP in Sumatra reach to value 74.1 (g C m-2 yr-1) and followed in month of April 2007 with the monthly average NPP value reach to 65.6 (g C m-2 yr-1).
However, the effects of El Nino-Southern Oscillation (ENSO) to the temporal changes of NPP are small. Compare to the temperature sensitivity, the responses of variability of NPP to the historical precipitation was much higher. Decrease in precipitation resulted drought intensified, and affected to limit the photosynthesis. Meanwhile, the increase in temperature resulted respiration and consumption increase, so the NPP decline. Therefore, increasing photosynthesis also increased NPP, and more carbon in the atmosphere will be absorbed.
Spatial and temporal changes of NPP are closely correlated with increase temperature and changing of the precipitation. Precipitation will increase in most Sumatera areas during La Nina event. Since increase in precipitation is accompanied by increasing clouds cover and decreasing sunlight and radiation, the increased of NPP is small. The decreased NPP also correlated with the rapidly increasing of temperature and the decreasing of precipitation.
There are complex patterns of wet and dry periods within Sumatera and also there is a general seasonal character to precipitation across Island. Between July and October the whole Sumatra appears to be relatively dry, whereas in the other months it is relatively wet. Variations in NPP across years are tightly related to climate variations, particularly precipitation. For the tropical forest, annual NPP for the nine-year period was significantly correlated with annual precipitation. Monthly NPP is strongly correlated with monthly precipitation. These results suggested that a small decrease in precipitation during the dry season could lead to a substantial decrease in NPP, while a similar decrease in precipitation during the wet season might not affect the NPPvalue.
During normal conditions in the Indian Ocean, the sea surface temperature is warmer in the east and cooler in the west. When an Indian Ocean Dipole event occurs, the situation is reversed. Cooling of the eastern part of the Indian Ocean has resulted in less convection and less rain. Consequently longer drought occurred in western Indonesia during the summer. Sometimes, the Indian Ocean Dipole could occur together with El-Nino in the Pacific, causing extreme weather and disaster events.
abnormal climate condition always followed with increased NPP and the situation is reversed when SST has decreased.
NEP is named ecosystem carbon sink (positive value) or carbon source (negative value). It is an indicator of measuring ecosystem carbon uptake or release. In any year over the past nine years, net ecosystem production could be very large in one location but very small or negative in another location because of the spatial heterogeneity of vegetation, soils and climate. Locations with large positive annual NEP are often the areas that receive a high amount of precipitation. In contrast, locations with negative NEP are the areas that receive little precipitation.
The pattern of EVI fluctuation showed increased in April and decreased in November.NPP over Sumatera Island ranges from 0 to 1600 g C m-2 yr-1. NPP flux within the forest region is ranging from 150 to 400 g C m2 month-1 and monthly average of NPP flux is 50 to 180 g C m-2 month-1. Variations in NPP across years are tightly to variations in climate, particularly precipitation. NPP is highly correlated with the Indian Ocean Dipole (IOD). The NPP is achieved the highest value in April during the monsoonal transitional period, and decreased to the lowest in September to October during the peak of Australian Monsoon.
Furthermore, to improve the prediction of net primary production, it is recommended to apply more parameter such as land cover data from high resolution satellite data. It is also recommended to conduct field experiments and observations for advancing our understanding of the interactions between the carbon and nitrogen cycles in the tropics.
Copyright © 2010, Bogor Agricultural University Copyright are protected by law,
1. It is prohibited to cite all of part of this thesis without referring to and mentioning the source;
a. Citation only permitted for the sake of education, research, scientific writing, report writing, critical writing or reviewing scientific problem
b. Citation does not inflict the name and honor of Bogor Agricultural University. 2. It is prohibited to republish and reproduce all part of this thesis without written
SPATIAL DISTRIBUTION OF NET PRIMARY PRODUCTION
(NPP) USING MODIS DATA AND CORRELATION WITH
CLIMATE VARIABILITY
IFRAN DESTIANTO IMANDA
A thesis submitted for the degree Master of Science in Information Technology for Natural Resources Management Program Study
GRADUATE SCHOOL
BOGOR AGRICULTURAL UNIVERSITY
BOGOR
Research Title : Spatial Distribution of Net Primary Production (NPP) Using MODIS Data and Correlation with Climate
Variability Student Name : Ifran D. Imanda Student ID : G051080081
Study Program : Master of Science in Information Technology for Natural Resource Management
Approved by, Advisory Board
Dr. Ir. Hartrisari Hardjomidjojo, DEA Dr. Ibnu Sofian, M.Eng Supervisor Co-Supervisor
Endorsed by,
Program Coordinator Dean of the Graduate School
Dr. Ir. Hartrisari Hardjomidjojo, DEA Prof. Dr. Ir. Khairil A. Notodiputro, M.S
Date of Examination: Date of Graduation:
ACKNOWLEDGMENTS
Alhamdulillah, Thanks to The Almighty ALLAH SWT, which has given me the opportunity and ability to complete this thesis. The success of this study would not have been possible without various contribution and support from many people and I will not be able to mention them one by one. Of course, I would like to express my highly appreciation to all of them.
I wish to thank my supervisor, Dr. Ir. Hartrisari Hardjomidjojo, DEA and my co-supervisor, Dr. Ibnu Sofian, M.Eng for their guidance, technical comment and constructive critics through all months of my research.
I would like to thank for Zoological Society of London for support me in obtained field data during my research.
I would like to thank to all MIT secretariat that support our administration, technical and facility. I would also thank to all MIT lecturer who taught me with very important knowledge during my study.
I would like also thank to all my colleagues in MIT for helping, supporting, and togetherness in finishing our assignment and study during accomplish our master degree.
Finally, I would like to thank to my lovely wife Evi Sunarsih my lovely daughter Vany, Elda, Fida and my parents for all moral their support, patience, prayer and love during my study.
CURRICULUM VITAE
The Author was born in Bandung, West Java, Indonesia on December 29st 1971. He finished his diploma of Academy of Forestry in 1993 and finished his bachelor degree from Sriwigama University Faculty of Forestry in 1999. He was entered the IPB Graduate School in year 2008. He was enrolled as private student in Master of Sciences in Information Technology for Natural Resources Management, Bogor Agricultural University in 2008 and
i
TABLE OF CONTENTS
TABLE OF CONTENTS ... i
LIST OF TABLE ... iii
LIST OF FIGURES ... iv
LIST OF APPENDICES ... vi
I. INTRODUCTION ... 1
1.1. Background ... 1
1.2. Objectives ... 4
II. LITERATURE REVIEW ... 5
2.1 Carbon Cycle ... 5
2.2 Net Primary Production ... 6
2.3 Distribution of Net Primary Production... 7
2.4 Estimation Method of Net Primary Production ... 8
2.5 Vegetation Indices ... 10
2.6 Light utilization efficiency, Temperature and Water ... 12
2.7 Photosynthetically Active Radiation (PAR) ... 13
2.8 Remote Sensing System and MODIS Data ... 15
2.9 Climatic Variability ... 19
III. RESEARCH METHODOLOGY ... 21
3.1 Time and Location ... 21
3.2 Data Source ... 21
3.3 Required Tools ... 22
3.4 Methodology ... 22
ii
3.4.2. Data Collecting... 22
3.4.3. Processing of MODIS Data ... 24
3.4.4. Estimation of Net Primary Production ... 26
3.4.5. Ground Truth ... 27
IV. RESULT AND DISCUSSION ... 29
4.1 Trends Change of Distribution NPP in Sumatra ... 29
4.2 MODIS EVI and MODIS FPAR ... 30
4.2.1. Enhanced Vegetation Index ... 31
4.2.2. Fraction of Photosynthetically Active Radiation (FPAR) ... 37
4.3 Optimal Temperature and Water Deficit ... 41
4.4 Net Primary Production (NPP) ... 44
4.4.1. Estimation of NPP for Sumatra ... 45
4.4.2. Correlation of NPP with Climate Variability ... 53
4.4.3. Ground truth of NPP Estimation in Provinces ... 61
4.5 Validation and Assessments ... 66
4.5.1. Net Ecosystem Production (NEP) ... 66
4.5.2. MODIS Land Cover Compare with NEP ... 70
V. CONCLUSION AND RECOMENDATION ... 73
5.1 Conclusion ... 73
5.2 Recommendation ... 74
REFFERENCE ... 75
iii
LIST OF TABLE
Table 2.1. MODIS Instrument and specification ... 17 Table 4.1 Percentage area compare to EVI value in Sumatra ... 32 Table 4.2 The general pattern EVI by monthly derived from remote sensing in
Sumatra ... 36 Table 4.3 Percentage area compare to FPAR value in Sumatra during years 2001 -
iv
LIST OF FIGURES
Figure 2.1 Global diagram of carbon cycle ... 5
Figure 2.2 Global NPP of vegetation during January to February 2010 ... 8
Figure 2.3 MODIS tile projection characteristic ... 19
Figure 2.4 Historical data of ENSO Years ... 20
Figure 3.1 Location of the study area ... 21
Figure 3.2 Flowchart of the research estimation of NPP ... 28
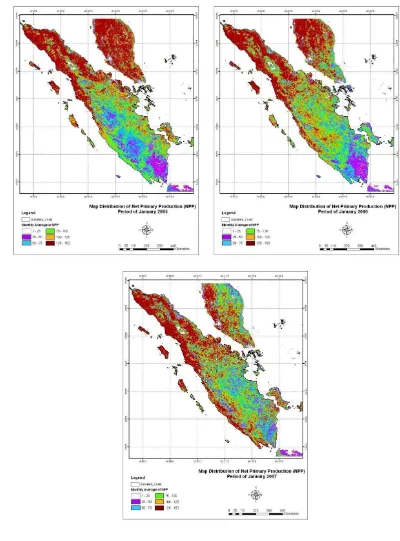
Figure 4.1 Trend change of NPP Distribution in Sumatra, year 2001(left), 2005 (middle) and 2009(right) ... 29
Figure 4.2 Time series of annual distribution of EVI in Sumatra ... 33
Figure 4.3 Enhanced Vegetation Index in year 2005(left), 2006 (middle) and 2007(right) ... 35
Figure 4.4 Time series of annual distribution FPAR value in Sumatra ... 39
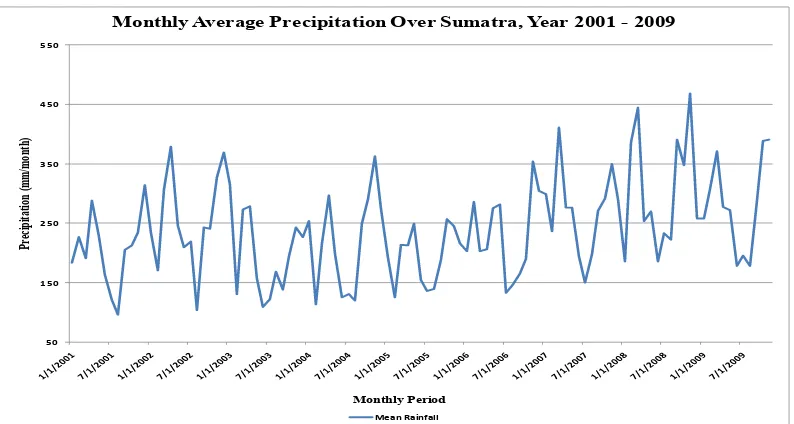
Figure 4.5 Time series of monthly average of precipitation ... 42
Figure 4.6 Time series of monthly average temperature... 42
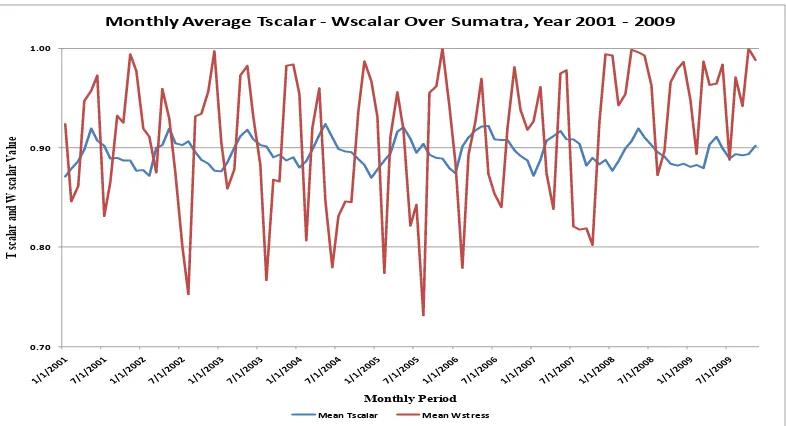
Figure 4.7 Time series of annual distribution Tscalar and Wscalar in Sumatra ... 43
Figure 4.8 Trends of annual distribution NPP in Sumatra ... 46
Figure 4.9a Maps of comparison monthly average NPP distribution in Sumatra during normal and abnormal climate event (January period) ... 47
Figure 4.9b Maps of comparison monthly average NPP distribution in Sumatra during normal and abnormal climate event (September period) ... 48
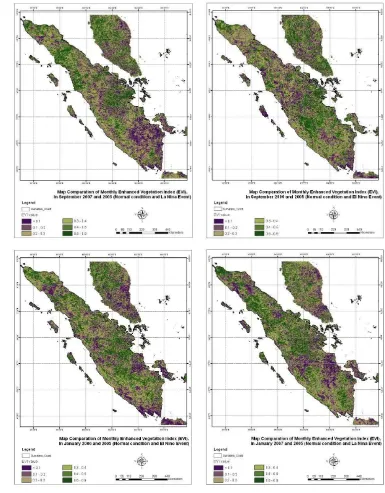
Figure 4.10 Maps of comparison monthly average EVI distribution in Sumatra during normal and abnormal climate event ... 50
v Figure 4.12 Relation between NPP and Precipitation and Temperature data in
Sumatra ... 53 Figure 4.13. Schematic of Positive and Negative IOD event ... 58 Figure 4.14 Relations between NPP and Indian Ocean Dipole ... 60 Figure 4.15 Estimation of NPP distribution compare to area (%) in Aceh Province
... 61 Figure 4.16 Estimation of NPP compare to the area (%) in South Sumatra
Province ... 63 Figure 4.17 Estimation of NPP distribution in Aceh (left) and South Sumatra
Province (right) ... 64 Figure 4.18 Land-cover information derived from Ground-truth in Aceh (above)
vi
LIST OF APPENDICES
1
I.
INTRODUCTION
1.1. Background
The most important global interactions between the biosphere and atmosphere involve the transfer of energy, water, and carbon. Carbon is assimilated by the biosphere through photosynthesis and released through autotrophic and heterotrophic respiration. Emissions and re-absorption of carbon gases from natural ecosystems were in a state of equilibrium for millions of years; however, this balance has been disturbed by human activities. Consequently, atmospheric concentrations of carbon dioxide (CO2) have been increasing and are
widely believed to be responsible for global warming.
Global climate warming is becoming obvious due to the sharply increasing atmospheric CO2 which comes from the green house gasses emitted by human
burning fossil fuel since the industrialization. Carbon dioxide (CO2) is a major
contributor to the planetary greenhouse effect and potential climate change. The terrestrial ecosystem is one of the largest carbon pools in the land surface, and the total carbon accumulated in the vegetation biomass and soil organic matter is almost 3 times the atmospheric carbon storage (Houghton, R.A., 2003).
Organic carbon buried in sediments as coal, natural gas, and oil over literally hundreds of millions of years is being consumed as a result of human activities and returned to the atmosphere as carbon dioxide (CO2) on a time scale
of a few centuries. The energy harvested from this transformation of fossil fuels supplies us with electricity, heat, transportation, and industrial power. The clearing of forests for agricultural lands and the harvesting of wood, both of which remove carbon-bearing vegetation, have also added CO2 to the atmosphere, in
amounts equivalent to more than half of the fossil fuel source. The CO2 added to the atmosphere because of man‟s activities, and the way it is currently distributed within the land, air, and sea (Sarmiento and Gruber, 2002).
2
report also revealed that the main cause of increasing greenhouse gas (GHG) such as the increase in Carbon Dioxide gases caused by fossil fuel use and land-use change, from forest land into economic value of land, such as settlements and plantations.
Net Primary Production (NPP) is the net carbon fixed by vegetation through photosynthesis. NPP provides the carbon required for maintenance of the structure and functions of an ecosystem. We can use NPP in the term of net biomass accumulation to express the net flux of carbon between the atmosphere and terrestrial vegetation. NPP is a fundamental ecological variable, not only because it measures the energy input to the biosphere and terrestrial carbon dioxide assimilation, but also because of its significance in indicating the land surface area and status of a wide range of ecological process. Net primary productivity (NPP) is an important component of the carbon cycle and a key indicator of ecosystem performance. NPP is driven by solar radiation and can be constrained by light, precipitation and temperature.
Global NPP of vegetation can be predicted using the relationship between leaf reflectance properties and the absorption of photo synthetically active radiation (Running and Nemani 1998; Goetz and Prince 1998). The Enhanced Vegetation Index (EVI) has been shown to be well correlated with LAI, biomass, canopy cover, and the fraction of absorbed photo synthetically active radiation (Gao et al., 2000), and therefore is useful for monitoring seasonal, inter-annual, and long-term variation of the vegetation structure (Huete et al., 2002).
Study about NPP for tropical forest is very important, because Indonesia is one of the countries located in the tropical area which has large area of tropical forest. Information on net primary production in tropical forests is needed for the development of realistic global carbon budgets and to provide information to support for carbon trading also to provide of how these ecosystems will be affected by climatic and atmospheric changes.
On one hand, climate change and increasing CO2 can cause changes in net
3 exchange. Understanding the response of terrestrial NPP and the carbon cycle to climate change is for predicting future environmental change and mitigating the impacts (Nemani et al., 2003; Prentice et al., 2001).
Climate is "average" weather for a given place or a region. It defines typical weather conditions for a given area based on long-term averages. Climate varies on all time scales, from one year to the next, as well as from one decade, century or millennium to the next. Although an area's climate is always changing, the changes do not usually occur on a time scale that is immediately obvious to us. However climate variations happen on all time scales, as well as on all spatial scales, from the regional to the global. As an example, the oceanic El Nino and La Nina phenomenon is most pronounced in the tropical Pacific off the coast of Peru, but the associated Southern Oscillation in the atmosphere has far-reaching, nearly global implications.
4
1.2. Objectives
There are several objectives designed for this research, which are:
To estimate net primary production (NPP) and annual carbon balance using MODIS imagery over Sumatra terrain during 2001 –2009.
5
II.
LITERATURE REVIEW
2.1 Carbon Cycle
Carbon is exchanged between atmosphere and the ocean by physical and chemical process. Human activities are involved with global carbon cycle. In particular, human activities create two new flux of carbon released to atmosphere. When forests are cleared for timer production or agricultural process, some of the carbon stored in the trees and soil is released to the atmosphere. Fossil fuel contained carbon molecule. The burning of fossil fuel for automobile and industrial uses released a several giga ton of carbon per year to the atmosphere. Figure 2.1 show the diagram of carbon cycle, at right side of the figure indicates a natural production of carbon cycle and left side indicates human activities involved to the carbon cycle.
(Source : http://esd.ornl.gov)
Figure 2.1 Global diagram of carbon cycle
Based on the data from Intergovernmental Panel on Climate Change (IPCC, 2001), CO2 concentration in the atmosphere increase rapidly becomes 367
6
IPCC (2001) predicted that the concentration of CO2 in the atmosphere will
increase 540 – 970 ppm in the beginning of 22 centuries (year 2100). Various sources may account for the excess of CO2 in the atmosphere, especially fossil
fuel burning. The input of fossil CO2 due to fossil fuel burning and cement
production is now about 5 x 10¹⁵ gC year-1.
In order to control the global carbon balance in the atmosphere, forestry sector have the important key. Indonesia is one of the countries with large area of tropical rain forest that have capabilities as carbon sink. Tropical forest is the biggest carbon sink ( Lloyd et al.1995; Malhi et al.,2000), with carbon stock reach 254 MgCha-1 and NPP 1560 gCm-2year-1. The increasing need of forest product every year should be follow with the other activity to control the carbon balance in the atmosphere and one example of activity to control the carbon balance in the atmosphere is reforestation activity at disturbed areas.
2.2 Net Primary Production
As a major part of terrestrial ecosystems, vegetation plays an important role in the energy, matter, and momentum exchange between the land surface and the atmosphere. Through the process of photosynthesis, plants assimilate carbon in the atmosphere and incorporate it into the biomass, and part of the carbon is emitted into the atmosphere again through plant respiration (autotrophic respiration). The difference between photosynthesis and autotrophic respiration is the net primary productivity (NPP).
Vegetation also acts as a source or sink, for the greenhouse gas CO2. Net
primary productivity (NPP) is an important component of the carbon cycle and a key indicator of ecosystem performance. NPP includes maintenance and growth respiration costs to the plant and the net assimilation of atmospheric CO2 into
organic matter. NPP is driven by solar radiation and can be constrained by light, precipitation and temperature (Field et al., 1995).
7 field, however, NPP cannot be assessed in terms of this difference. An alternative definition of NPP is the total organic matter produced over a given interval. Although this production cannot be directly measured because of transformations such as consumption and decomposition during the measurement interval, it can be estimated based on a suite of diverse measurements and underlying assumptions. It is conceptually useful, therefore, to define the quantity NPP as the field-measurement-based, operational estimate of actual NPP (Clark et al. 2001).
NPP comprises all materials that together represent: (1) the amount of new organic matter that is retained by live plants at the end of the interval, and (2) the amount of organic matter that was both produced and lost by the plants during the same interval. In forests, these materials are: aboveground biomass increment, fine litter fall, aboveground losses to consumers, emissions of biogenic volatile organic compounds (BVOCs), above ground losses of leached organic compounds, net increments in biomass of coarse and fine roots, dead coarse and fine roots, root losses to consumers, root exudates (Clark et al. 2001).
Net primary productivity (NPP) is defined as the net flux of carbon from the atmosphere into green plants per unit time. NPP refers to a rate process, i.e., the amount of vegetable matter produced (net primary production) per day, week, or year. However, the terms net primary productivity and net primary production are sometimes used rather liberally and interchangeably, and some scientists still tend to confuse productivity with standing biomass or standing crop. NPP is a fundamental ecological variable, not only because it measures the energy input to the biosphere and terrestrial carbon dioxide assimilation, but also because of its significance in indicating the condition of the land surface area and status of a wide range of ecological processes.
2.3 Distribution of Net Primary Production
8
between different pools and how carbon stocks change in response to afforestation, reforestation, and deforestation (ARD) and other land-use activities. Distribution of NPP can be in any place in the world, i.e. forest, agricultural, wetland, urban areas which will have different rate in NPP and carbon sequestration. Changes in the proportion and spatial distribution of land use could
enhance or degrade the area‟s ability to sequester carbon in terrestrial ecosystem.
Figure 2.2 shows the global, annual average net primary production of vegetation on land during January to February 2010. On this map, vegetation is pictured as a scale or index of greenness. Greenness is based on several factors: the number and type of plants, how leafy they are, and how healthy they are. In places where foliage is dense and plants are growing quickly, the index is high, represented in dark green. Regions where few plants grow have a low vegetation index, shown in tan. The pattern that the maps show is a global one, vegetation greenness is high around the equator all year long, where temperatures, rainfall and sunlight are abundant. Between the equator and the poles, the vegetation greenness rises and falls as the seasons change.
(Source : http://earthobservatory.nasa.gov/GlobalMaps)
Figure 2.2 Global NPP of vegetation during January to February 2010
2.4 Estimation Method of Net Primary Production
Many models have been established to estimate regional and global NPP and can be classified into three types: climate models, process models, and energy
9 relation between NPP and climate data. Process models estimate NPP based on plant physiological and ecological processes. Energy use efficiency models use energy use efficiency and the relationship between vegetation index and FPAR to estimate radiation absorbed by plants to estimate NPP. Because an energy use efficiency model is simple and uses remotely sensed data, it is widely used.
Net primary productivity (NPP) is defined as the net flux of carbon from the atmosphere into green plants per unit time or the total new organic matter produced during a specified interval. This production is only conceptualized because they cannot measure directly in the field. Instead, NPP must be estimated based on a suite of measurement of various types and numerous underlying assumptions.
As documented in Potter (1999), the monthly NPP flux, defined as net fixation of CO2 by vegetation, is computed in NASA Carnegie Ames Stanford Approach (CASA) on the basis of light-use efficiency (Monteith, 1972). Monthly production of plant biomass is estimated as a product of time-varying surface solar irradiance (Sr) and EVI from the MODIS satellite, plus a constant light utilization efficiency term (emax) that is modified by time-varying stress scalar terms for temperature (T) and moisture (W) effects.
The equitation for estimation monthly NPP values is :
NPP = Sr EVI emaxTW ………. (1)
Where :
NPP = Net primary production (gC m-2year-1)
Sr = Solar irradiance
EVI = Enhanced Vegetation Index from MODIS
emax = Constant Light Utilization Efficiency Term
T = Optimal temperature for plant production
10
2.5 Vegetation Indices
The vegetation index is an empirical measure of vegetative cover. In the area of applications and research in satellite remote sensing, dozens of vegetation indices have been developed for different requirements. Vegetation Indices (VI)
are optical measures of vegetation canopy „greenness‟, a direct measure of
photosynthetic potential resulting from the composite property of total leaf
chlorophyll, leaf area, canopy cover, and structure. VI‟s are widely used as
proxies in estimating canopy state variables (leaf area index, fraction of absorbed photosynthetically-active radiation, chlorophyll content, vegetation fraction) and canopy biophysical processes (photosynthesis, transpiration, net primary production). The Vegetation Index includes the Normalized Difference Vegetation Index (NDVI) and an Enhanced Vegetation Index (EVI) at coarse (~5-8km) and moderate (~250m -1km) resolutions to effectively characterize ecosystem states and processes for long-term climate change and near real-time operational applications.
The first use of multi-temporal AVHRR NDVI to monitor the dynamics of vegetation at the continental and global scales was in 1985. Tucker et al. (1985), found the differences in temporal dynamic of vegetation reflected by NDVI are associated with variations in climate and dependent on biome types, and that the integrated NDVI over a given time interval is related to NPP.
Goward et al. (1985) was the first demonstrated of linear relationship between the growing seasons integrated with NDVI and ground-based observations of NPP for different biomes over North America. In the following year, Fung et al. (1987) was the first study to relate NDVI to annual NPP at the global scale, to study atmosphere-biosphere exchange of CO2 and to study simply distributed annual NPP into monthly level based on the monotonic function of monthly NDVI, without considering solar radiation or environmental stresses.
11 variations in average global air temperature for the past twenty years (Tucker et al., 2001).
Although NDVI provides researchers with a way to monitor vegetation, the sensitivity of NDVI to background reflectance and the tendency of NDVI to saturate at high leaf area may limit the use of this technique across a variety of vegetation types (Huete et al., 2002). Recent efforts have focused on improved methods for calculating specific dates of vegetation phenological transitions using improved satellite data products e.g., MODIS–EVI/LAI.
The Normalized Different Vegetation Index (NDVI) was calculated from
reflectance in the Near Infrared (ρNir; 841-876 nm) and red (ρRED; 620-670 nm)
wavelength. The equation as below:
………. (2)
The Enhanced Vegetation Index (EVI) is often employed as an alternative to NDVI because it is less sensitive to these limitations, but requires information on reflectance in the blue wavelengths, which is not available on some satellites and is difficult to extract from broadband radiation measurements.
A few remote sensing studies have explored the combination of blue, red, and near infrared (NIR) bands for development of improved vegetation indices that are related to vegetation greenness (Huete et al. 1997 and Gobron et al. 2000). The main requirement of a vegetation indices is to combine the chlorophyll absorbing red spectral region with spectral region with the non absorbing, leaf reflectance signal in the near – infrared (NIR) to provide a consistent and robust measure of area-averaged canopy photosynthetic capacity.
The enhanced vegetation index (EVI) is an „optimized‟ vegetation index
with improved sensitivity in high biomass regions and an improved vegetation monitoring characteristic via a decoupling of the canopy background signal and a reduction in atmospheric influences, and it is calculated from (Huete et al., 1997).
The equation for as below :
12 Where :
EVI = Enhanced vegetation index
G = Gain factor (=2.5)
NIR = Near infrared and ρRed–ρBlue is the red/blue reflectance
C1 C2 = Atmospheric resistance red and blue correction coefficients are
(1 and 6.0)
L = The canopy background brightness correction factor is 7.5
2.6 Light utilization efficiency, Temperature and Water
The emax term is set uniformly at 0.39 g C MJ-1 PAR, a value that derives
from calibration of predicted annual NPP to previous field estimates (Potter et al., 1993). Tscalar is computed with reference to derivation of optimal temperatures (Topt) for plant production. Topt setting will vary by latitude and longitude,
ranging from near 0°C in the Arctic to the middle thirties in low-latitude deserts. Wscalar is estimated from monthly water deficits, based on a comparison of moisture supply (precipitation and stored soil water) to potential evapotranspiration (PET).
Tscalar is estimated using the equation developed for the terrestrial ecosystem model (Raich, J.W. et al, 1991). The equation for Tscalar as below :
………..………(4)
Where Tmin Tmax and Toptare minimum, maximum and optimal temperature
for photosysnthesis, respectively. When air temperature falls belows Tmin, Tscalar is set to 0.
Wscalar is the effect of water deficit on plant photosynthesis, has been estimated as a function of rainfall, run off, groundwater reserves and potential evapotranspiration and potential evapotranspiration. The equation for Wscalar as
below :
13 Where EET and PET is potential evapotranspiration estimation and, with Wscalar ranged between 0.5 (dry) to 1 (wet).
Therefore, the barrier function in Wscalar, can be described as below:
……….……….. (6)
Where, PPT is the total of precipitation. Meanwhile, water run-off, and groundwater reserves are ignored. Meanwhile, PET is calculated based on the Priestley and Taylor (1972) with the equation as below:
...………. (7)
Where Rn is the net-radiation (MJ m-2 day-1), G is the heat flux at ground level,
with the assumption of 0, is the psychometric constant with a value of about 66 Pa K-1. And a row is the latent heat of evaporation of 2.5 mm MJ-1 and the empirical factor of 1:26. While , is calculated using a mathematical equation as follows:
………(8)
Where is the slope vapor pressure curve (kPa °C-1), air temperature T (°C).
2.7 Photosynthetically Active Radiation (PAR)
14
and nutrients. Vegetation canopies intercept various amounts of PAR over the plant-growing season because of differences in leaf types and seasonal dynamics of leaf phenology i.e. leaf flush, leaf expansion, leaf fall (Xiao, 2006).
In the term of plant physiology process, there is parameter called ƒPAR
(fraction of absorbed photosynthetically active radiation). This parameter is
fraction between APAR and PAR. ƒPAR have linear relationship with NDVI
value. Vegetation type and climate condition have influence the gradient of linear
relationship between ƒPAR and NDVI (Sugiarto, 2005).
Ruimy et al.(1994) introduced relationship between ƒPAR and NDVI
with equation as:
ƒPAR = 1.25 * NDVI –0.025 ………. (9)
Other research for production forest in Australia (Prince and Goward, 1996) found the relationship equation as:
ƒPAR = 1.67 * NDVI - 0.08 ……….. (10)
Dye and Hooda (1996) found relationship between ƒPAR and NDVI using
NOAA-AVHRR data for forest vegetation in India with equation as:
ƒPAR = 1.9 * NDVI –0.31 ……… (11)
Leaf and forest canopies are composed of photosynthetically active vegetation (PAV, chloroplasts) and non-photosynthetic vegetation (NPV, mostly senescent foliage, branches, and stems). Photosynthetic activity of vegetation canopy is in part determined by the amount of PAR absorbed by PAV for photosynthesis. This version of the vegetation photosynthesis model, ƒPARPAV within the photosynthetically active period of vegetation is estimated as a linear function of EVI, and the coefficient a is set to be 1.0 (Xiao, 2006), The ƒPARPAV which can be estimated using equation as:
15 2.8 Remote Sensing System and MODIS Data
Solar radiation in the wavelength interval between 400 and 700 nm provides the energy for photosynthesis and this information can be used for estimating NPP of plants. NPP of forest has been calculated from annual sum of daily photosynthetic absorbed in radiation and the radiation use efficiency of different plant species.
Remote sensing technology approach can also used in relatively simple modeling framework to estimate global NPP of terrestrial vegetation using the relationship between reflectance properties and absorption of photosynthetically active radiation, if net conversion efficiencies can be approximated or assumed nearly constant (Ruimy et al. 1994). As a result, the efficiency with which canopy PAR absortion is covered to dry matter (biomass) has become the subject of much recent research.
Remote sensing is the science and art of obtaining information about an object, area, or phenomenon through the analysis of data required by a device that is not it contact with the object, area or phenomenon under investigation (Lillesand and Kiefer, 1994). Remote sensing is one of the methods of spatial data acquisition, which are based on the use of image data acquired by a sensor such aerial cameras, scanners or radar. Taking a remote sensing approach means that the information is derived from the image data, which from a (limited) representation of the real world (Jansen, 2000).
In principle, remote sensing system could measure energy emanating from
the earth‟s surface in any sensible range of wavelengths. However technological
16
Remote sensed data are collected using either passive or active remote sensing systems. Passive sensor is record naturally occurring electromagnetic radiation that is reflected or emitted from the surface. For example, cameras and video recorders may be used to record visible and near infrared energy reflected from the surface, and a multispectral scanner may be used to record the amount of thermal radiant flux emitted from the surface. Active sensors such as microwave (radar) measure the surface using man-made electromagnetic energy and the record the amount of radiant flux scattered back toward the sensor system.
Remote sensing can provide information on two different classes of variables, which area biophysical and hybrid. Biophysical variables may be measured directly by the remote sensing system. This means that the remotely sensed data can provide fundamental biological and/or physical information directly, without having to use others surrogate or ancillary data. For example, a thermal infrared sensor can record the apparent temperature of a rock outcrop by measuring the radiant flux emitted from its surface. Similarly, it is possible to conduct remote sensing in a very specific region of the spectrum and identify the amount of water vapor in the atmosphere. The second groups of variables that may be remotely sensed include hybrid variables, created by systematically analyzing more than one biophysical variable. For example, by remotely sensing a
plant‟s chlorophyll absorption characteristic, temperature, and moisture content, it may be possible to model these data to detect vegetation stress, a hybrid variable (Jensen, 2000).
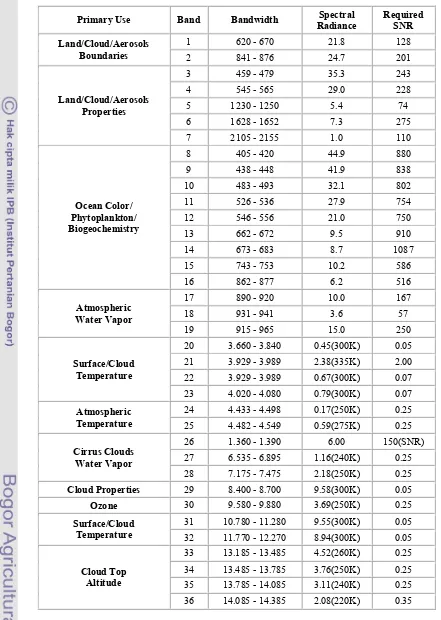
17 Table 2.1. MODIS Instrument and specification
18
The MODIS (Moderate-resolution Imaging Spectroradiometer) is sensor onboard the NASA Terra satellite was launched in December 1999. There are 36 spectral bands in the MODIS sensor, seven spectral bands are primarily designed for the study of vegetation and land surface: blue (459–479 nm), green (545–565 nm), red (620–670 nm), near infrared (841–875 nm, 1230–1250 nm) and shortwave infrared (1628–1652 nm, 2105–2155 nm). Table 2.1. Show the spectral band and primary use of MODIS System.
The MODIS sensor acquires daily images of the globe at a spatial resolution of 250 m for red and near infrared (841–875 nm) bands, and at a spatial resolution of 500 m for blue, green, near infrared (1230–1250 nm) and shortwave infrared bands. Raw MODIS data stream could be received in real-time using a tracking antenna, and for alternatively, the scientific data is made available to the public via several World Wide Web sites.
The NASA Goddard Earth Sciences Distributed Active Archive Center (GES DAAC), known as GSFC-ECS in the Earth Observing System Data Gateway, distributes three major groups of MODIS products: Level 1 Radiometric and Geolocation data, and Level 2 and higher level of Atmosphere and Ocean products. Most MODIS data from GES DAAC are provided as Hierarchical Data Format-Earth Observing System (HDF-EOS) files. MODIS Level 1 and 2 data are 5-min „„Swath‟‟ granules, while Level 3 are global „„Grid‟‟ maps. Only Ocean Level 3 binned and all Level 4 (primary productivity) data are in the native HDF4 format. Depending on the science product, the spatial resolutions of Level 2 data vary from 1 to 10 km. Correspondingly, Levels 3 and 4 products are available in various spatial and temporal resolutions, ranging from 4.63 km to 1°, and from one day to a year. The MODIS product names start with „„MO‟‟ and „„MY‟‟ for Terra and Aqua products, respectively.
19 An illustration of the 10-deg grid used in MODIS land production is shown below. The color coding is as follows: land tiles with land products generated regularly are shown in Green (286 tiles globally), land tiles with land products not generated are in Orange, ocean tiles are in Blue, and tiles with only sea-ice product generated are in Pink. Figure 2.3 shown MODIS Tile Projection Characteristics.
(Source : http://modis.gsfc.nasa.gov/)
Figure 2.3 MODIS tile projection characteristic
2.9 Climatic Variability
20
variations in climate cause most of the inter-annual variation in the strength of the land carbon sink (Hougthon, 2002).
El Niño and La Nina are terms that many people have heard once or twice, especially in reference to abnormal weather conditions, but many do not fully understand what these phenomena are. ENSO, more commonly known as El Nino, is a climate event that occurs every three to seven years. It is caused by a rise in temperature of the Pacific Ocean as well as a change in surface pressure. Predicting when the next ENSO event is going to occur can be difficult, but there are a number of early warning signs, such as an increased surface pressure above the Indian Ocean (Wikipedia, 2010). Figure 2.4 show the historical data of ENSO years occurred in world region.
Figure 2.4 Historical data of ENSO Years
21
III.
RESEARCH METHODOLOGY
3.1 Time and Location
This research has been conducted in period March until October 2010. Location of research is over Sumatra terrain. Figure 3.1 show the area of interest of the research.
Figure 3.1 Location of the study area
3.2 Data Source
This research has used remote sensed and spatial data which are TERRA MODIS satellite data and meteorological data (temperature and rainfall). The MODIS satellite data collected by monthly since 2001 up to 2009. The MODIS data were available for free download from the site
ftp://e4ftl01u.ecs.nasa.gov/MOLT/ and also from the site which is;
https://wist.echo.nasa.gov/~wist/api/imswelcome/ and the meteorological data
were available for free download from the site
22
3.3 Required Tools
Several hardware and software used during this research project such are personal computer and printer, image processing software (ENVI version 4.7, MODIS Tool, Grads version 2.0), geographic information system software (Arc Map version 9.2) and office application software (Microsoft Office 2007) also hand held GPS Garmin.
3.4 Methodology
3.4.1. Determine of Study Area
Study area of this research is Sumatera terrestrial. Sumatra (also spelled Sumatera) is an island in western Indonesia. Sumatera is the 5th highest island in the world's island, and the third highest in the Indonesian archipelago at 473,481 km² with a population of 50,365,538. The longest axis of the island runs approximately 1,790 km (1,110 mil) northwest–southeast, crossing the equator near the center. At its widest point the island spans 435 km (270 miles) and administration of Sumatra terrains divided into ten provinces (Wikipedia, 2010).
The interior of the island is dominated by two geographical regions: the Barisan Mountains in the west and swampy plains in the east. Most of Sumatra used to be covered by tropical rainforest, but economic development coupled with corruption and illegal logging has severely threatened its existence. Conservation areas have not been spared from destruction.
3.4.2. Data Collecting
23 Sumatra terrene has wide areas and cannot cover only by one single image of MODIS data. In this case, the MODIS datasets are provided to user in a tile fashion, each tile covers approximately by 10 latitude and 10 longitudes and to cover the whole of Sumatra terrene its need four tiles of MODIS datasets. The total of MODIS datasets in this study are used 432 of MODIS EVI (enhanced vegetation index) and 1640 of MODIS FPAR.
Climatic data derived from monthly meteorological observations (January 2001–December 2009) from NCEP/DOE 2 Reanalysis data was provided by the NOAA/OAR/ESRL PSD, Boulder, Colorado, USA, from their Web site at
http://www.esrl.noaa.gov/psd/. There are two kinds of data were used from this source, which are monthly temperature and monthly precipitation.
Monthly minimum and maximum temperature from this source were using a state-of-the-art analysis/forecast system to perform data assimilation data from 1979 to near the present. Temperature data were provided for global gridded with spatial coverage of 1.875-degree latitude x 1.875-degree longitude global grid of monthly anomalies of observed air temperature and combined observed air and marine temperature.
Monthly estimates of precipitation were obtained by monthly and global gridded with spatial coverage of 1.875-degree latitude x 1.875-degree longitude precipitation means. This data set consists of monthly averaged precipitation rate values (mm/day). Global monthly precipitation analysis based on gauge observations, satellite estimates, and numerical model outputs. It includes a standard and enhanced version (with NCEP Reanalysis) from 1979 to near the present.
24
3.4.3. Processing of MODIS Data
The MODIS website provides a search engine that permits the user to search the MODIS product for particular areas of interest and to select the resolution of the data and specific dates. Note that products earlier than the current year are available from the USGS at the website http://lpdaac.usgs.gov/main.asp.
The download options for data stored in the “Data Pool” can be accessed through
an FTP server of the USGS.
As stated in literature review, all MODIS land products are reprojected on the Integerized Sinusoidal (IS) 10-degree grid. In this study have been used MODIS EVI (MOD13A3) and MODIS FPAR (MOD15A2) which provided in tile projection characteristic. The tiles are labeled from top to bottom and from left to right starting at 00. The horizontal tiles range from h00 to h36, and the vertical tiles range from v00 to v17. Oftentimes a MODIS HDF-EOS filename will contain .h##v##. This specifies the horizontal and vertical location of the tile. To give an example, the selected product of interest for Sumatera was:
“Vegetation Indices 500m” MOD13A3, for the whole of the year 2004 and the specific tiles we needed were h27v08, h27v09, h28v08 and h28v09.
The MODIS data are the key data source for NPP estimation. MODIS system has two types of vegetation indices: normalized difference vegetation index (NDVI), sensitive to chlorophyll and the enhanced vegetation index (EVI), focused on plant structural variation such as physiognomy and leaf type and area. The MODIS enhanced vegetation index (MOD13A3) products will provide consistent, spatial and temporal comparisons of global vegetation conditions which will be used to monitor the Earth's terrestrial photosynthetic vegetation activity. MODIS (EVI) with monthly vegetation index compositing and 1 km resolution. The main reason to use vegetation index compositing is to combine multiple images into a single, gridded, and cloud-free vegetation index map.
25 to 0.7 mm) that a canopy absorbs. MOD15A2 (FPAR) has 1 km resolution and provided in 8 day basis. MODIS (FPAR) are biophysical variables which describe canopy structure and are related to functional process rates of energy and mass exchange. MODIS (FPAR) have been used extensively as satellite derived parameters for calculation of surface photosynthesis and annual net primary production. These products are essential in calculating terrestrial energy, carbon, water cycle processes, and biogeochemistry of vegetation.
For preprocessing the MODIS images in a format compatible with others software it was necessary to obtain software code from the US Geological Survey (USGS) (http://LDPAAC.usgs.gov), which are available for different users‟ operating systems. In the case, we used software programs MODIS Reprojection Tool (MRT). The MODIS Reprojection Tool is software designed to help individuals work with MODIS data by reprojecting MODIS images (Level-2G, Level-3, and Level-4 land data products) into more standard map projections. The main function of the MODIS Reprojection Tool is the resampler and mrtmosaic, executable programs that may be run either from the command-line or from the MRT Graphical User Interface (GUI).
Resampling is the mathematical technique used to create a new version of
the image with a different width and/or height in pixels. Increasing the size of an image is called up-sampling; reducing its size is called down-sampling. Many different resampling schemes are possible. Most techniques work by computing new pixels as a weighted average of the surrounding pixels. The weights depend on the distance between the new pixel location and the neighboring pixels. The simplest methods consider only the immediate neighbors; more advanced methods examine more of the surround pixels to attempt to produce a more accurate result. Following are the most common resampling methods:
Nearest neighbor: Each pixel in the output image receives its value from the nearest pixel in the input (reference) image.
26
Cubic convolution: Each estimated pixel value in the output image is based on a weighted average of 16 nearest neighboring pixels in the input image. Cubic convolution is the slowest method, but it yields the smoothest results
Mosaicking images involves combining multiple images into a single
composite image. The MRT provides a mosaic tool (mrtmosaic) for mosaicking tiles together prior to resampling. The mosaic tool requires that all input files are of the same product type and they must contain the same Scientific Data Set (SDS) names, SDS sizes (number of lines and samples), SDS projection types and projection information, SDS pixel size, etc. If the SDS characteristics for each input tile do not match, then the mosaic tool will exit with an error.
The mosaic tool requires an input parameter file which lists the full path and filename of each input file to be mosaicked. The input files can be listed in any order and the mosaic tool will determine how they fit together in the mosaic. The mosaic tool also requires an output filename. The file type of the output file must match that of the input files. Thus, if the input files are HDF-EOS then the output file extension must be .hdf. If the input files are raw binary then the output file extension must be .hdr.
3.4.4. Estimation of Net Primary Production
The approach for estimation NPP used NASA Carnegie Ames Stanford Approach (CASA) on the basis of light-use efficiency is conducted using relationship of monthly production of plant biomass is estimated as a product of time-varying surface solar irradiance (Sr) and EVI from the MODIS satellite, plus a constant light utilization efficiency term (emax) that is modified by time-varying stress scalar terms for temperature (T) and moisture (W) effects.
The equitation for estimation annually NPP values is :
NPP = Sr EVI emax TW ……… (14)
Where :
27
Sr = Solar irradiance
EVI = Enhanced Vegetation Index from MODIS
emax = Constant Light Utilization Efficiency Term
T = Optimal temperature for plant production
W = Monthly water deficit
The emax term is set uniformly at 0.39 g C MJ-1 PAR, a value that derives
from calibration of predicted annual NPP to previous field estimates (Potter et al., 1993). T is computed with reference to derivation of optimal temperatures (Topt) for plant production. W is estimated from monthly water deficits, based on a comparison of moisture supply (precipitation and stored soil water) to potential evapotranspiration (PET). T and W value based on the estimation data from climatic data.
The equitation for estimation monthly NPP values is :
NPP = EVI emax FPAR TW ……….……… (15)
NPP = Net primary production (gC m-2year-1)
emax = Constant Light Utilization Efficiency Term
EVI = Enhanced Vegetation Index from MODIS
FPAR = Fraction Photosynthetically Active Radiation from MODIS
T = Optimal temperature for plant production
W = Monthly water deficit
3.4.5. Ground Truth
28
Ground truth is usually done on site, performing surface observations and measurements of various properties of the features of the ground resolution cells that are being studied on the remotely sensed digital image. It also involves taking geographic coordinates of the ground resolution cell with GPS technology and comparing those with the coordinates of the pixel being studied provided by the remote sensing software to understand and analyze the location errors and how it may affect a particular study. In this study, ground truth conducted in two province of Sumatra (Aceh and South Sumatra Province). The information that is
collected “on location” (ground truth information) derived from secondary data
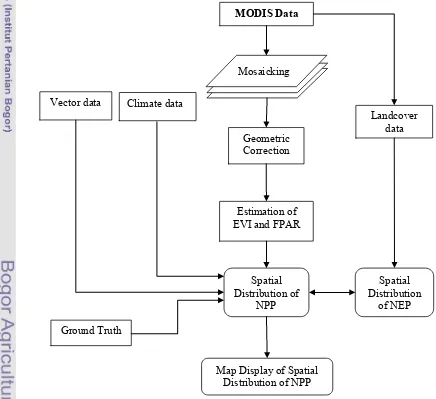
from other agency or institution. The general flow-chart of research study as show in Figure 3.2.
Figure 3.2 Flowchart of the research estimation of NPP
Vector data
MODIS Data
Mosaicking
Geometric Correction
Estimation of EVI and FPAR
Spatial Distribution of
NPP Climate data
Ground Truth
Map Display of Spatial Distribution of NPP
Landcover data
Spatial Distribution
29
IV.
RESULT AND DISCUSSION
4.1 Trends Change of Distribution NPP in Sumatra
Based on time series of estimation NPP from 2001 to 2009, trends change of NPP in Sumatra terrestrial was observed. Result of NPP distribution value showed a significant difference among ecosystems.
In this research study, trends change of distribution NPP in Sumatra has provided from year 2001 to 2009. Result derived from NPP distribution has provided information with negative and positive value as show in Figure 4.1. Change distribution with negative value mostly occupy in northern part of Sumatra Island during year 2001 and 2005, in part of central Sumatra during 2009. Change with negative value indicated that the areas among ecosystems have decreased in NPP distribution.
However, in other region of Sumatra such as at center and southern part of Sumatra Island, change of NPP distribution dominated with positive value during 2001 and 2005. Change with positive value indicated that the areas have increased in NPP distribution. Meanwhile, in northern part and southern part of Sumatra has positive value during 2009 and it also indicated increased NPP distribution occurred over the areas.
30
Changes in terrestrial net primary productivity (NPP) integrate with other climatic, ecological, geochemical, and human influences on the biosphere. Some regional studies have reported the increases in NPP in recent 20 years with different reasons. For the northern mid-latitudes and high latitudes, multiple mechanisms such as nitrogen deposition, CO2 fertilization, forest re-growth, and climatic changes may lead to the increases in NPP, whereas increases in the tropics have been primarily attributed to CO2 fertilization (Nemani, et.al., 2003).
Refer to the information as show in Figure 4.1 most dramatic change occurred at tropical forest in Sumatra usually caused from conversion forest to some other land-use. Most common changes has effected to decrease and increase of NPP distribution. Decrease NPP distribution usually caused by expansion of urban areas, cash crop farming, palm oil plantations, timber extraction from the forest, natural disaster such as forest fire etc. Increase NPP distribution usually caused by growing of young vegetation to become mature vegetation for example increased of mature vegetation from plantations.
4.2 MODIS EVI and MODIS FPAR
In this study, monthly composite MODIS EVI and FPAR products at 1 km resolution (MOD13A3 and MOD15A2) were obtained for the nine-year period from January 2001 up to December 2009 and cover of all Sumatra terrene. The following four tiles of the MODIS datasets are h27v08, h27v09, h28v08 and h28v09, where h and v denote the horizontal and vertical tile number, respectively.
31 As stated in previous chapter, there are two kinds of estimation used; first is estimation of annual NPP and second is estimation of monthly NPP. Several parameter of estimation which used to estimation NPP as described below:
4.2.1. Enhanced Vegetation Index
Enhanced Vegetation Index (EVI) data were obtained from the MODIS sensor. EVI improves the quality of NDVI product. It corrects for some distortions in the reflected light caused by the particles in the air as well as the ground cover below the vegetation. The EVI data product also does not become saturated as easily as NDVI when viewing rainforests and other area of the Earth with large amounts of chlorophyll. The EVI data are designed to provide consistent, spatial and temporal comparisons of vegetation conditions, and it offers the potential for regional analysis and systematic and effective monitoring of the forest area.
Vegetation indices derived from remote sensing data provide information about consistent, spatial and temporal comparisons of global vegetation conditions which will be used to monitor the Earth's terrestrial photosynthetic vegetation activity. For example, the enhanced vegetation index (EVI) provides a measure of greenness of the vegetation that can be used to predict net primary production.
The evolution of vegetation index exhibits a strong correlation with the typical green vegetation growth stages. The results (temporal curves) can be analyzed to obtain useful information such as the start/end of vegetation growing season. However, remote sensing based phonological analysis results are only an approximation of the true biological growth stages. This is mainly due to the limitation of current space based remote sensing, especially the spatial resolution, and the nature of vegetation index.
32
Table 4.1 Percentage area compare to EVI value in Sumatra
Years
EVI
0.1 – 0.2 0.2 – 0.3 0.3 – 0.4 0.4 – 0.5 0.5 – 0.6 0.6 – 0.9
2001 (ha) 462790.74 739015.27 4243341.42 15608401.17 20543410.47 5612159.07
% 0.97 1.55 8.89 32.69 43.03 11.76
2002 (ha) 629636.78 3943796.46 8683600.12 14659983.58 13875347.93 5422878.65
% 1.32 8.26 18.19 30.71 29.06 11.36
2003 (ha) 629256.24 4217640.9 9900183.79 14464480.04 12763013.62 5238794.76
% 1.32 8.83 20.74 30.30 26.73 10.97
2004 (ha) 672839.67 3756930.12 9236643.42 13549689.38 14032204.18 5953272.71
% 1.41 7.87 19.35 28.38 29.39 12.47
2005 (ha) 755644.21 3811847.11 9145646.41 13836325.56 13185780.25 6463200.43
% 1.58 7.98 19.16 28.98 27.62 13.54
2006 (ha) 611769.07 3149234.25 8041273.9 12789444.87 14103462.29 8530489.74
% 1.28 6.60 16.84 26.79 29.54 17.87
2007 (ha) 616426.8 3370699.76 9650059.54 14503097.16 12784553 6301830.63
% 1.29 7.06 20.21 30.38 26.78 13.20
2008 (ha) 642000.69 3571072.47 9429534 13663897.4 14013996.27 5895804.99
% 1.34 7.48 19.75 28.62 29.35 12.35
2009 (ha) 643481.63 3880384.55 9548529.45 14392517.82 13698360.88 5052702.27
% 1.35 8.13 20.00 30.15 28.69 10.58