l8
Sasongko and SevenhuYsen MedJ
Univ IndonBody Mass and Physical Performance in
Urban
Indonesian
Children l0
-
12
Years
Sarashvati
A.
Sasongko*,Gustaaf
P. SevenhuysenAbstrak
Telah dipelajari massa tubuh dan kemanpuanfisik 120 orang anak usia
l0
- 12 tahun di Jakarta. Massa tubuh dinyatakan dengan standar berat badary'tinggi badan, indeks massa tubuh dan indeks berat badan/tinggi badan. Ketnatnpuan fisik diukur dengan tes kesegaran jasmani ,nenurut Rost dengan menggunakan ergocycle. Ditetnukan bahwa status gizi subyek cukup baik sehingga tidak mempengaruhi kenatnpuan pada tes aerobik. Anak yang ntenpunyai massa tubuh paling besar netnperlihatkan kematnpuanfisik yangpaling
rendah. Indeks berat badan - tinggi badan menunjukkan hubungan yang bermakna pada kedua kelonpok. Aktivitas fisikmendukung tercapainya tingkat kesegaran jastnani yang lebih tinggi pada anak laki-laki.
Abstract
The body nass and physical perfonnance of 120 urban chiUren lO to 12 years of age were studied in Jakarta. The body mass indeces analyzed were Weight-for-Heiqht
(ryH),
Body Mass Index (BMI) and Weighrfor-Height Index (WHI). The physicalfitness was assessed by the Rost's nethod using an ergocycle. The results indicate that the nutritional status of all subjects was sufrciently highfor there to be little inJluence on their performance in aerobic fitness test. Subjects with the highest body tnass perfonned at the lowest level. Weight, expressed as WHI, contributes significantlyfor
both boys and girls, while habitual physical activity is an ùnportant predictor only atnong the boys.Keywords : Physicalfitness, Mttxitnal oxygen uptake, Body nnss index, Weight-for-height, Adolescent
INTRODUCTION
Human
resources are an
important part
of
economic
productivity
and
improved physical fitness
has beengiven
increased
attention
as it relates
to
better
work
performance.l'2'3'4
To
attain desire levels
of
physical
performance,
the
human
body
requires
food
for
development
and
maintenance and
nutrition plays
arole
in
physical
performance.s
Th"
relationship
be-tween
nutritional
status andphysical performance
hasbeen demonstrated
by
a
number
of
studies which
showed
the detrimental effects
of
undernutrition in
childhood
onwork
capacity
asadults.l'3'6
A
most commonly
used
physical fitness
test
in-volves
the measurementof
cardiopulmonary
function
during
exercise.T'8It
ispossible to
equatefiiness
with
cardiorespiratory
endurance as measuredby
maximal
aerobic
power
or
maximal
oxygen
uptake.e Themax-imal oxygen
uptakereflects
thefunctional
adaptability
of
the
whole
organism and
is
the
result of
numerousphysiological
responses.T'8'9In
its
broadest
sense,physical fitness reflects
thephysical
working
capacity
or simply the working
capacity
of
an
individual
and theseterms
areoften
usedinterchangeably.lo
It
is
difficult
to
determine
adolescentnutritional
status
from
anthropometry due
to
the growth
spurt
which
occurs
atdifferent
agesamong children.
ll
TheWorld
Health Organization
recommends that theBody
Mass
Index
(BMI) is
used
to
report weight-height
relationships
until
a better indicator
is
available
to
indicate body
fatnesr.12M"urr*hile,
a new index
of
weight-for-height (V/HI)
has been proposedby
Chinn
et al."
This
study
resportsthe relationships
of
either
index
with
a testof
physical fitness
which
is
used as afunctional
testof nutritional
status,in
agroup
of
male
and
female school
children in
urban
Jakarta,*
East Jakarta District Healthffice,
Jakarta, IndonesiaVol 3, No ), January - March 1994
MATERIALS
AND METHODS
Subjects
were
60male
and 60female school children
aged 10
to
12 years from a private school (SD
StAntonius
I)
and agroup of
public
schools (SDpondok
Bambu 013, 014
and
015) in
East Jakarta.
Two
dif-ferent
types
of
schools were chosen
with the aim of
including
a
relatively
wide range
of
values as
thesocioeconomic
statusesof
parents
differ. From
both
schools, equal number
of
subjects were
randomly
selectedfrom
children
with
heightsover
1.40m,
which
was the
minimum
height required
to
operate anadult
ergocycle
(seeTable 1)
The study was
conducted
according
to
criteria
approved
by
the Ethical Review Committee
of the
University
of
Indonesia. Informed
consent
was
ob-tained
from
the parents
of
eachsubject. Physical
ex-aminations and interviews during home visits
werecarried out
to
identify any past
or
current
medical
conditions
thatwould
prevent
orhinder
thechild
com-pleting
thephysical fitness
test.Anthropometric
measurements
were
measuredwith the
subjects
wearing
shorts and
in
bare
feet. A
platform
beam balance was employed
to measure
weight with an
accuracy
of
100 grams.
Height
wasThe physical
performance
test was carried
out
according
to
the method
of
Rost,16modified
for
sub-maximal
testunder
field conditions.
The subject
was asked toperform consecutively
severaldifferent
work-load
trials starting form 25 Watt (l5O kpm) with an
increment
of
25
V/att
on
aMonark
mechanical
brakecycle
ergometer. Thepedalling
rate wasmaintained
at 60 perminute
which
wasconstantly
checkedfrom
thebuilt-in
speedometer
and each
work
trial
lasted 2
minutes. The apical
heartrate
wasdetermined using
a stethoscopefor
30 secondsafter
1l/2
minutes
ofeach
work
load.
All
the children were
encouraged
with
competitive motivation to perform
the indicated
con-secutivework
trials
until
the heart rate was at least 170 beats/minuteswhich
is approximately 85% of themax-imal
heart rateof
lOto l2-year-old
childrenlT or
until
he/shewas
exhaustedor could not
continue. Oxygen
uptake
in mililiters
wasfrom
theload
achievedby
the subject, using the formula : 350 +l2
*
load(Watt).
Theresting oxygen uptake
is
estimated at 350
ml
and the increasein
uptakeperminute
perWatt
isapproximate-ly
l2 milliliters.'o Maximal
oxygen uptake, VO2max,
wascalculated
by dividing
VO2 by body
weight.TBody Mass and Physical
Performance
l9
Habitual physical activity
assessment was based ontime motion
analysismethod,l0
in
which each
sub-ities
thefor
tsa
teachers were
interviewed
toconfirm
the data recordedby the child. The activities
recorded
were
classified
according
to
the standard
activity
types
in
three
categories :light,
moderate and heavy activities.T'8 The averagetime
spent
in
moderate and
heavy activities
was used
asan
indicator
of habitual
activity in
sub-sequent analysis.Dietary intake
assessmentswere
obtained
from
food records
keptby
eachsubject over
threeconsecu-tive
days. The
intake data was checked
with
thesubject's mother/care-taker
during
aninterview in
thehome. Energy and nutrient contents
of
the
foods
reported were calculated
from the
Indonesian Food
Composition Tables.le
The hemoglobin
level
wasdetermined
by
cyanhemoglobin method and
the
hematocrite by microhematocrite method.la
Regression analysis
was
used
to
determine
the performance ofbody
massindices in relation
toheight,
as
well
as
to
determine
the relative contributions
of
body
massindices, energy intake
andactivity to
VO2max values. MANOVA
analysis was performed
tocheck the association
of
independent variables
on thecombined
changesof VOz max
and load. TheNumber
Cruncher
Statistical
System (NCSS) was
usedfor all
statistical
analyses.Tablc
l.
Age, anthrolnmetric, VO2max and nutrition related data.(mean, + SD)
Female
n=60 n=60Male
Age (mos)
Weight (kg) Hcight (crn) BMI (wt/ht2; VO:max (rnl/kg/min)
Hemoglobin (g/dl)
Encrgy intake (cal) Activity time (min)
137.4 + 8.2
38.2 + 8.4 146.2 + 4.8
17.8 + 3.39 33.3 + 5.3
12.9 + O.9
2217.8 + 719.t
34.8 + 16.6
140.9 + 8.7
37.8 + 7.6
145.4 + 4.8
17.8 + 3.08
38.2 + 6.3 13.1 +
l.l
2325.4 + 739.8 51.4 + 2O.4
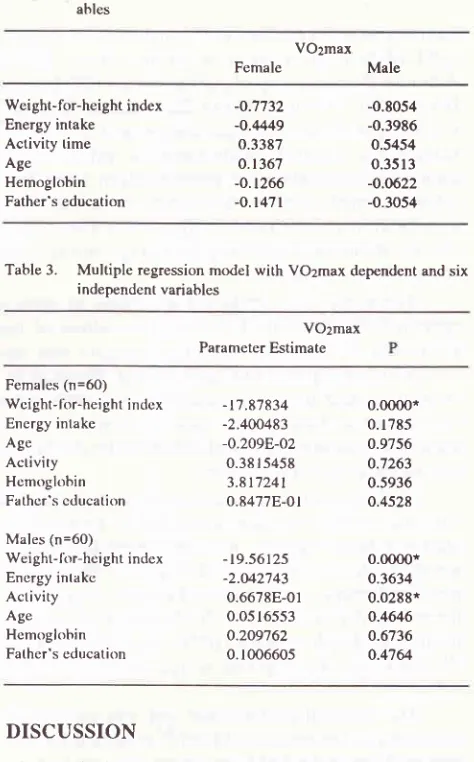
RESULTS
20
Sasongko and Sevenhuysendeviation of
the respective
index from
its
meanvalue
show a
slight
association
with
height
in all
cases. Theregression estimate
for weight-for-height (W/H)
wassignificantly different
from zero
for
both boys
andgirls. Though both
BMI
and
WHI
show similar
andneglible
associations
with height,
WHI
was
selectedfor
usein
subsequentanalysis
on the basisof
patternsshown
in Figure
1.The
relationships
of
ageand
height or
BMI
areshown
in Figure 2, which
compares
both
indices
for
boys
andgirls with
values recordedfor
children of
thesame
age participating
in
the National Health
andNutrition
Examination
Survey(NHNES),
in theUnited
States.ls
As shown in Figure
2, more thanfive
percentof
boys were
found
to
haveBMI
valuesbelow
the5th
percentile, and
more than 5 percentof girls
werefound
to
haveheight values below the 5th percentile.
It
wastherefore
assumedthat
several
of
the
children
below
these 5thpercentile
values showed inadequategrowth
due to reasonsother
thanbiological
variation
andpos-sibly nutrition
or health problems.
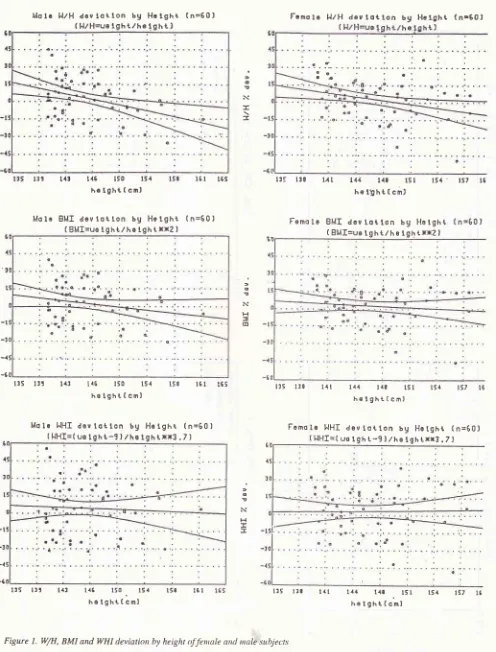
Figure
3
shows three relationships between
theWHI,
the maximum
load achieved
by
the
subject
(watts/kg)
andthe VOz max (ml/kg/min), in
athree-dimensional
plot. Maximum
load
andVO2 max
showa
positive
relationship. However,
both
fitness
measures areinversely
related
to
the
WHI.
The same
relationships
werefound
for BMI with
maximum load
andVO2 max. The
plot
shows
no
apparent changein
theielationship
atvery low
valuesof
WHI, indicating
that the subjects
with
the lowest
mass has thehighest
fitness, The pattern
is
the samefor both boys
andgirls.
Table
2
shows
strong negative correlations
be-tween VO2 max
andWHI,
andthe
estimateof
energyintake. Conversely,
VOzmax
shows
astrong positive
relationship
with
the estimate
of
habitual activity.
These
relationships
are expected.Table
3 shows the results
of
regression
analysisusing
the samevariables
in
amulti-variate
model.
Themodel
accounts
for 62%
and69% of
the
variation in
VO2 max among girls and boys respectively, WHI
contributes
significantly
for
both
groups, while
habitual
activity
is an
important predictor
only
among the boys.The regression analysis does not
suggest
thateither
energy
intake or hemoglobin predict
VOzmax.
Nor
doother variables that
have been associatedwith
nutritional
statusin
other
studies. Possible association betweenjoint
changesin
VOz max and
maximum load
with
changes
in
height
and
BMI
were
tested
with
amanova procedure. The analysis showed
no
apparenteffect
from
eitherheight
orBMI
on thecombination
of
VOzmax
andmaximum
load.Med
J Univ Indon
Table
2.
Correlation coefficients for VOzmax and six selectedvari-ables
VO:max
Female Male Weight-for-height index
Energy intake
Activity time Age
Hemoglobin
Father's education
-o.1732 -o.4449 0.3387
o.t367
-o.1266
-o.t47t
-0.8054 -0.3986 0.5454 0.3513 -o.0622 -0.3054 Table
3.
Multiple regression model with VOzmax dependent and sixindependent variables
VOzmax
Parameter Estimate Females (n=60)
Wcight-1or-height index Energy intake Age
Activity
Hcmoglobin
Fathcr's cducation Males (n=60)
Wei ght-for-hei ght index Encrgy intakc
Activity Ag.
Hcmoglobin
Father's education
-t7.87834
-2.400483
-o.209F-02
0.38 r 5458 3.81724t
0.8477E-01
-t9.56125
-2.0/.2743 0.6678E-01
0.05 16553
o.209762 0.1006605
0.0000* 0.1785 o.9'756 o.7263 0.5936 o.4528
0.0000* o.3634 0.0288* o.4646
o.6736 o.4'164
DISCUSSION
The analysis
of
body
mass
indices shows
that
theperformance
of
flH
is
not
adequatefor
the group
of
subjects
studied. The results
suggest
that
BMI
andWHI
are less related to theheight of
theindividual
andmay therefore
bebetter indices to
describebody mass
differences between adolescents.
BMI
has
been
proposed as a suitable indexby
some researches,l2'20The
numbers
of
subjects
with either weight
for
height
orBMI
indicesbelow
thoseof children
measur-ed in theUnited
States waslower
than reportedin other
studies.2l'22
It
appears
that the
group
of
children
selected
for
thestudy were
of
higher
nutritional
statusthan others
in
Indonesia,
inspite
of
attending
both
upper-middle
and
lower
socioeconomic
classinstitu-tion. A
small number
of
subjectsmay
have beencom-promised
in
growth, given the numbers that
were
shorter and lighter than the 5th percentiles recordedfor
American children.
[image:3.595.311.548.106.487.2]Molr
l.l./Hd€etotlon bg Hclght
(n=60)
( l.l/H=uelght./he tght
!Vol 3, No I,
Jortrrttrt'
Murch 1994116 150
l5.l helght
(cn)
Molc BMI
d6vlotlon
bg
Helght
(n=60)
( BMI=ue
tght/he tght
xxz IBody Mass and Physical
Perfonnance
2l
Famolc
lltH
aevlotlon
bg
Hrfght
(n.60)
Ca
l3s 130 14t l,t4 t48 lsl
ls,t
ts7hdtght(cm)
o ! N
-=
t5s l6 t
14t
139
o
! N H
(D
-t
-3
-1
-6
l3S 139
l.l3t16 tso
151he
lght
( cm)Molc
l{HI
devlotlon
by Hetght
(n=60)
t
llHI=(
u€ tgh t -9 I/he tghrxr3
. 7 I135 trt
l.t3 116 150. ts,r
tsi
hetght
( cml165
t6l
tsr
a
6
!
H
t
=
-t
-t
-{
-e
'o
t6 t
135
138 l1l
111 l.l8
l5I
15{' tS,
lÉhe
t!ht
( cm)Femo
le
BMI
aevtot
lon
bg
Hotght
( n=60 I( BMI=ue I
ght/h
E lghtrxz
IFamole
l.lHI
aevtotton
bg Hetght
(n=60)
( HHf=( u€ tgh
r-9
)./ho tghrrr3.
Z)l!5 Itt
l4t
t,l,t t,ta fsl
t'a
lS7
tatetgt'ttcil
[image:4.595.49.545.70.722.2]o
o
tr c0o
lo
-oi
qli
?
ol
."&'
rti
,
fi
,ti
illrl'P
o
ooo
o
o
o
Er
otr
oo
o
str
oo
sâ
2=a b?.lttEs
o.ôç-c
Ât
oin ')ûrli-
tMed
J
Univ Indons
o
<U)
dtllrl
\lEî'
L .It 0, >. o<U)
d(t fî22
Sasongko and Sevenhuysen(ntc)
1q6ray
sî.
o
o
>\o
\o
I É, 0, Èt) fit >r!
à-CQ OJo
zo
\c' tlc
o
E) |It >.tt
.c
Olo
.c
tu fil=
o
o
o
-oo
o
cqc
roolfl
ot
(\tq
o
(fIq
o
fîqqq
ooo
\Olfltf <dq
o
c\
(=rq,/ru)
tng
ç
cî
4Â
oo
o
rri
ci
C\I H
p
oo:
o
do
I@od
o!
oo
o
o
o
gâ '-Où Z=a b:lt9Io
Àùç
c,
r'2
oi D
ù't r^ 5
ti-o
o
(DOO
o
o
o
o
\o ilc
o
o) 'ct\
_ôct
o, (!o
tL('I
c!
4 q ù\
\
q) oo "ôq
\
ù ôO Ëà
èo s ôi ù ôo t\Eî.
o
o
c, <O) HrO o .rt It=-)
o Ol l!o
o
\c, llc
o
CD .Illt
+t .c, ctr c,E
o
o
É,o
t&o
q
tn otlrlo
(n
(Ytq
o
('lccq
ooo
€lfls
ÊdÊq
o
r\
Itr \oo
o
o
o=o 2=^
Eat
Ë
À5o
g€
o
cnE
llt lla o8o
o!
=.
.l!ûB
s.€
En
6) I'(-rg11r)
1ag
or
Vol 3, No
l,
January - March 1994Femole
VO2mox
(mI/kg)
bg
lood
(uott,/kg.
ond
l,.lHI
(
tut,-91ltrtxx3.7)
(n=60)
llHI
unltr
itor.
lo€d
FemaIe
Body Mass and Physical Perfonnance 23
(uott/kg
(n=60)
x
o
Ê,
o
Mole
V02mox
(m1/kg)
bg
lood
ond HHf
(
tut-9Izntxx3.Z)
x
o
É
o
],lHI
unlt
r
mox.lood
Male
24
Sasongko and Sevenhuysenauthors.2'10'23
Th"
inverse relationship can
be
ex-plained
by
the
fact
that subjects
with low body
massare leaner, with
ahigher proportion
of
metabolically
active tissue
per kilogram bodyweight. Hence,
leansubjects are able
to reach
higher
values
of VO2max
(ml/kg/min)
and
maximum load (watt/kg). The
sub-jects
with
the highest body
mass
performed
at
thelowest level. This
has also beenfound
in
some studies onfitness
of
obese children.2a'25The results indicate that the
nutritional
statusof
all subjects was
high
enough for there
to
be little
influence on their
performance
in
an
aerobic fitness
test, regardless of
low
values
for body
mass indices.All
three body
mass
indices,
WHI,
BMI
abd
W/H,
demonstrated the same
relationship. Neither were
anynutrition
related estimates, such as energy
intake,
hemoglobin levels or father's
education
important
in
explaining
the variation in
VO2max and
maximum
load
achievedby
the subjects.The study shows that
thenutritional
statusof
10to
12years
old children form two different
types
of
schools
in
urban
Jakartawas comparable to
the statusof children
measured
in the NHNES survey
in
theUnited
States.The
functional
testof nutritional
statusdemonstrated
that
all subjects
were able
to perform
adequately
and that habitual physical
activity
con-tributed in
higher fitness
level
amongboys. It may
bethat a
higher level
of habitual physical activity
espe-cially in girls
will
increasetheir
fitness levels,
as sug-gestedin
several studies.24'25Acknowledgement
The
authorswould like
to thank Drs.
SoemilahSastro-amidjojo, Director
of Teaching,SEAMEO-TROPMED,
University of
Indonesia
for
her support
in writing
thisarticle; Zainal
Abidin, Department
of Nutrition
andMinarma
Siagian, Department
of Physiology,
Univer-sity
of
Indonesia,
for their
assistancein
the actual
re-search.
REFERENCES
l.
SatyanarayanaK,
NadamuniNA,
Chaterjee B, Rao, BSN. Body size and work output, Am J Clin Nutr 3O; 1977: 322-5. 2. Satyanarayana K, Naidu AN, Rao N. Nutritional deprivationin childhood and the body size, activity, and physical work-ing capacity of young boys, Am J Clin Nutr 32; 1919: 1169-75.
3. Spun GB, Dahners HW, Barac-Nieto M. Marginal malnutri-tion in school-aged Colombian boys : Functional
consequen-ces in maximum exercise, Am J Clin Nutr 37; 1983:834-47.
4. Stroot P, A priority for the WHO : Promoting healthy ways of life, Am J Clin Nutr 49 no 5 (supp), 1989; 1063-964,
Med
J
Univ Indon5. Whitney EN, Cataldo CB, Rolfes SR. Understanding normal and clinical nutrition, 2nd ed, West Publishing, St Paul,
t987,222-3.
6. Areskog NH, Selius R, Valquist B. Physical work capacity
and nutritional status in Ethiopian male children and young adults. Am J Clin Nutr 1969;22:471-9.
7. McArdle
W,
KatchFI,
KatchVL.
Exercise physiology, energy, nutrition and human performance, 2nd ed, l-,e,a&
Febiger, Philadelphia, 1985, 3-5 13.
8. Astrand PE, Rodahl K. Textbook of work physiology, 3rd ed, McGraw
Hill
Book Co, New York, 1987, 523-16. 9. Georgiades G, Klissauras V. Assessment of youth fitness :The European perspective, Am J Clin Nutr 49 (5):(supp),
1048-53.
10. Barr-Or
O. Der
praxis der sportmedizinin
der kinder-heilkunde Springer-Verlag, Berlin, 1986.I
l.
Marchall WA, Tanner JM, Puberty. In : Human growth - acomprehensive treatise 2nd ed edited by Frank Falkner
&
J.M. Tanner, Plenum Press, New York, 1986, 17l-203.
12. Tienboon P, Walhquist
ML,
RutishauserIHE.
Early lifefactors affecting body mass index and
waisrhip
ratio inadolescence, As Pac J Clin Nutr
l,
1992,21-'7.I3. Chinn S, Rona RJ, Gulliford MC, Hammond J.
Weight-for-height index
in
children aged 4-12 years.A
new index compared to the normalized body mass index, Euro J ClinNutr 1992, 46; 489--500.
14. Jellife DB. The assessment of the nutritional status of the
comrnuniry,
wHO,
1966, l0-30.15. US Deparfment
of
Health and Human Services, National Center for Health Statistics, Anthropometric reference dataand prevalerrce
of
overweight United States 1976-1980, National Health Survey Seriesll
no 238, 1987.16. Rost R, Heck H, Hollmann rù/. Die Fahrradergometries in
der Praxis, 2nd ed, Universitat Dortmund, 1984, 3-10.
17. Barr-Or O. Special consideration of exercise in children and
aclolescents,
in
:
Nutrition and exercise editedby
MyronWinnick, lst ed, 1986, John Wiley
&
Sons Ltd, New York,105- l 5.
18. Bouchard C, Tremblay A, Leblanc C, Lortie G, Savard R,
Therlaut
G,
A
methodto
assess energy expenditure in chilclren and adults, Am J Clin Nutr, 1983; 461-7.19.
Nio OK.
Daftar Analisa Makanan (Food Composition Tables), University of Indonesia, Iakarta, 1992.20. Rolland-Cachera
MF,
SempeM,
Guilloud-Bataille M,Patois E, Pequignot-Guggenbulrl F, Fautrad
V.
Adiposity indices in children, Am J Clin Nutr 1982, 36; 178-84.21. Enoch M, Hatifah, Syafruddin. Body weight and height of
school children in Depok, Medika 1990,
l6;
633-41. 22. RilantonoLI.
Tredmill testin
sclrool childrenin
Jakarta,Medika 1992, l8;16-8.
23. World Health Organization, A joirrt FAO/WHO/UNU expert cousultation report,
WHO
Report Technical Series 724,WHO, Geneve, 198-5, 50-74.
24. Huttunen NP, Knip M, Paavilainen T. Physical activity and
fitness in obese clrildren,
ht
J Obesity 1986, l0;519-25. 25. TremblayA,
Despres JP, Leblanc C, Craig CL, Ferris B,