Diabetes mellitus in ß-thalassemia major patients
Riadi Wirawan*, Santy Setiawan*, Simon Kusnandar*, Bulan Ginting Munthe**
Abstrak
Thalassemia mayor adalah penyakit yang disebabkan oleh kelainan sintesis rantai polipeptida yang diturunkan secara otosom resesif. Penanganan kasus dengan thalassemia mayor berupa pemberian transfusi berulang yang akan mengakibatkan hemokromatosis. Hemokromatosis dapat terjadi pada beberapa organ tubuh termasuk pankreas. Tujuan penelitian ini untuk mendapatkan kadar gula darah dan angka kejadian hemokromatosis pada penderita thalassemia mayor. Telah diperiksa kadar gula darah puasa dan kadar ferritin serum pada 115 penderita thalassemia mayor yang berumur 10-23 tahun dari Pusat Thalassemia Bagian Ilmu Kesehatan Anak Fakultas Kedokteran Universitas Indonesia-Rumah Sakit Cipto Mangunkusumo Jakarta. Kadar gula darah diperiksa dengan metode enzimatik sesuai dengan kriteria American Diabetes Association (ADA), kadar ferritin serum diperiksa dengan metode microparticle enzyme immuno assay (MEIA). Pada penelitian didapatkan semua kasus yang diperiksa menunjukkan hemokromatosis, 14,8% dari pada kasus disertai dengan kadar gula darah puasa terganggu dan 2,6% menujukkan adanya diabetes melitus. Penderita thalassemia mayor yang mendapat transfusi berulang menyebabkan terjadinya hemokromatosis yang dapat mengganggu fungsi pankreas. (Med J Indones 2003; 12: 87-93)
Abstract
-thalassemia major is a disease caused by polypeptide chain synthesis disorder which is inherited as an autosomal recessive from both parents which is marked by little or no globin chain synthesis. Medication for thalassemia major patients is by repeated blood transfusions, which causes hemochromatosis. Hemochromatosis can occur in various organs including the pancreas. The aim of the study was to assess the alteration of plasma glucose concentration and the hemochromatosis prevalence. Fasting plasma glucose concentration and serum ferritin examination were measured in 115 thalassemia major patients with ages between 10-23 years who were out-patients in the Thalassemia Centre, Department of Child Health, Medical School, University of Indonesia / Dr. Cipto Mangunkusumo General Hospital, Jakarta. The plasma glucose concentration examination was conducted by the GDH enzymatic method, with American Diabetes Association (ADA) criteria in the evaluation, while the serum ferritin examination was conducted with the microparticle enzyme immuno assay (MEIA) method. All patients had hemochromatosis, 14.8% of the patients had impaired fasting glucose level and 2.6% of the patients showed indications of diabetes mellitus. thalassemia major patients who receive frequent transfusions will develop hemochromatosis that will in turn impair the pancreatic function. (Med J Indones 2003; 12: 87-93)
Keywords : thalassemia major, hemochromatosis, diabetes mellitus
Thalassemia belongs to a group of diseases with hemoglobin synthesis abnormalities, which are inherited autosomal recessively from one or both parents. It is characterized by the decrease or absence of one or more globin chains.
ß-thalassemia is caused by the decrease or absence of ß globin chain synthesis caused by mutation of ß globin genes, which are located on chromosome 11. If the
mutation happened on both of the ß globin genes, it is homozygous ß-thalassemia with the clinical form of ß-thalassemia major. The distribution of the disease is vast enough, covering the Mediterranean area, Africa, the Middle-east, India, Burma, South-east Asia including South China, Malaysia and Indonesia.1,2
Therapy for thalassemia major is generally palliative, with repeated blood transfusion, diminishing the resultant iron deposits by giving iron chelation and medication against complications. The excessive tissue iron deposit is caused by ineffective hemopoesis, repeated transfusions, and increased iron absorption in the digestive tract. Besides, the iron deposit may be caused by iron regulation defect that is *Department of Clinical Pathology, **Department of Child
inherited autosomal recessively, in connection with the HFE gene located in chromosome 6. This abnormality can increase iron absorption in the digestive tract. Excessive iron will be deposited in the liver, heart, and endocrine glands e.g. the pancreas. Clinical manifestations caused by malfunctions of several organs of the body due to the iron deposits, are known as hemochromatosis. In ß-thalassemia major, hemochromatosis can occur in endocrine glands e.g. the pancreas.3,4
The aim of this study was to determine the prevalence of hemochromatosis, the alteration in blood sugar level, and the correlation between blood glucose and serum ferritin level. In addition, we want to find out the lowest ferritin level and the age when the change in blood glucose level happened.
METHODS
The subjects were 115 patients diagnosed as ß thalassemia major, receiving transfusions at the Thalassemia Center, Department of Child Health, Medical School, University of Indonesia, and Dr. Cipto Mangunkusumo General Hospital with the following inclusion criteria :
Diagnosed as ß thalassemia major.
Consented to participate in this study.
10-23 years of age
Had repeatedly receive transfusion during the last
year without iron chelator medication.
Blood samples to assess the glucose and serum ferritin level had been taken before the next transfusion.
Blood samples for plasma glucose and serum ferritin were collected during fasting. Subjects with diabetes mellitus (DM) undergoing insulin medication were given their morning dose of insulin after blood samples were taken. Other medication which might interfere with blood glucose level e.g. steroids, thiazides, nicotinic acid, dilantin®, thyroid hormones and -interferon-5 were stopped 24 hours before blood sampling. Samples were taken before commencing the next transfusion. This study has passed the ethical committee evaluation from the Committee of Ethics, Faculty of Medicine University of Indonesia.
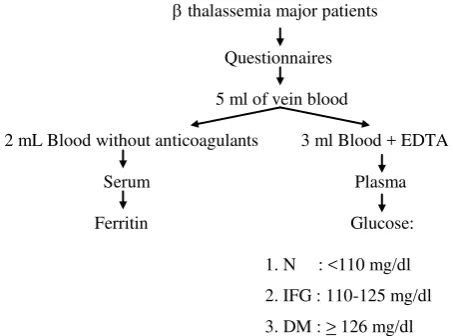
On the first visit 5ml fasting venous blood was taken; 2 ml was used for serum ferritin assessment, and 3 ml
was kept in vaccutainer tubes containing K3EDTA for plasma glucose assessment.
Blood sampling before the next transfusion
Confirmation of DM
(fasting glucose)
DM IFG (*)
DM=diabetes mellitus; (*): after 2x confirmed; N= Normal fasting glucose level; IFG=impaired fasting glucose.
Figure 1. Flow chart of procedures
Preliminary tests prior to the study were within-run and between-day precision, and accuracy for blood glucose assessment using Cobas Mira automatic chemistry analyzer, and serum ferritin level assessment using IMx Abbott automated immunoassay analyzer. Blood glucose assessments were done based on
Roche’s Gluc GDH enzymatic method,5
and serum ferritin assessment were based on Abbott Diagnostics
microparticle enzyme immuno assay (MEIA)
Definitions
The diagnosis of IFG was confirmed if fasting plasma glucose concentration after 8 hours of fasting varied between 110-125 mg/dl. Fasting means restriction of calorie intake through food or drink except plain water for at least 8 hours before the blood sample was taken.
Diabetes mellitus is diagnosed if fasting plasma glucose concentration is > 126 mg/dL and has been confirmed by a second test. If after the confirmation the diagnosis of DM is not confirmed, then it is diagnosed as IFG.
A serum ferritin > 700 ng/ml is considered as hemochromatosis.
RESULTS
Within-run precision test for glucose assessment using Cobas Mira analyzer, with a glucose concentration of 80.1mg/dl as control, showed a CV of 1.05%, while between–day precision test yielded a CV of 2.14%. Cobas Mira automatic analyzer accuracy test for glucose level assessment showed a deviation of –0.37%.
Abbott IMx analyzer within-run precision test for serum ferritin using low (20 ng/ml), normal (150 ng/ml), and high (400 ng/ml) controls, yielded CVs of 1.37%, 1.38%, and 1.99% respectively, while between-day precision test for low, normal, and high controls, yielded CVs of 1.76%, 1.14% and 0.18% respectively. The results of Abbott IMx analyzer accuracy test for ferritin assessment using low, normal, and high controls, yield d = – 3.03%, – 2.02%, and – 4.31%, respectively.
Ferritin results of 115 patients ranged between 851 ng/ml and 16,583 ng/ml. Out of 115 patients, 20 patients showed glucose levels between 110 – 256 mg/dl, 13 patients between 110 – 124 mg/dl, and 7 patients between 130 – 256 mg/dl. Three of the 7 patients that showed glucose level above 126 mg/dl at the first assessment still showed glucose level above 126 mg/dL at the second assessment, while the other 4 patients showed glucose level between 82 – 97 mg/dL. Statistical analysis using SPSS 9.0 program showed that there was no correlation between ferritin and glucose level (r=0.02).
Table 1. Ferritin level among 20 -thalassemia major patients with IFG and DM
Patient number
Age (years)
DM history Fasting glucose level
(ng/ml) Ferritin level (ng/ml)
I II
8 10 - 113 10,935
11 11 - 136 97; 95 10,651
13 11 - 133 82; 89 5,942
24 14 - 134 83; 86 6,806
28 14 - 121 6,666
32 15 - 113 6,799
36 16 - 114 3,771
44 17 - 179 189 7,926
52 19 - 117 5,218
59 9 - 116 12,758
67 11 - 121 3,414
72 12 - 118 4,090
77 13 - 110 6,922
79 13 - 111 4,430
81 14 - 135 83; 87 6,825
85 14 - 113 6,215
86 14 - 256 437 4,279
87 14 - 112 6,177
102 17 - 130 172 2,746
18,000 16,000 14,000 12,000 10,000 8,000 6,000 4,000 2,000 0
G
lu
c
o
s
e
(
m
g
/d
L
)
300
200
100
0
Ferritin (ng/ml)
Figure 2. Correlation between blood ferritin and glucose level
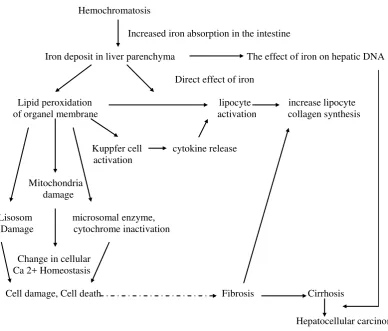
Hemochromatosis
Increased iron absorption in the intestine
Iron deposit in liver parenchyma The effect of iron on hepatic DNA
Direct effect of iron
Lipid peroxidation lipocyte increase lipocyte of organel membrane activation collagen synthesis
Kuppfer cell cytokine release activation
Mitochondria damage
Lisosom microsomal enzyme, Damage cytochrome inactivation
Change in cellular Ca 2+Homeostasis
Cell damage, Cell death Fibrosis Cirrhosis
Hepatocellular carcinoma
Figure 3. Mechanism of cells (hepatocytes) and tissue amage (fibrogenesis) in hemochromatosis. (Modified from Bacon15) r = 0,02
p = 0,921
DISCUSSION
Within-run precision for glucose 80.1 mg/dl (normal control) with the Cobas Mira chemistry analyzer showed a CV of 1.05%, while between-day precision yielded a CV of 2.14%. The results are within the WHO allowed limit, i.e. 5%.7 Accuracy for glucose 80.1 mg/dl with the Cobas Mira analyzer was still within the average 2 SD, with a deviation of – 0.37%.
Within-run precision for ferritin with low (20 ng/ml), normal (150 ng/ml), and high (400 ng/ml) controls for low, normal, and high controls, respectively.
Precision and accuracy for glucose and ferritin assessments showed good results, which validate all glucose and ferritin data used in this study.
We included 115 -thalassemia major patients,
receiving blood transfusions at the Thalassemia Center, Department of Child Health, Medical School, University of Indonesia, in this study. All the patients underwent packed red cells (PRC) transfusion regularly every 2 to 4 weeks. There were 55 male
(47.8%) and 60 female (52.2%) subjects between 10 –
23 years old in this study. Twenty-three (20%) subjects had a family history of DM, their fasting blood glucose levels were between 71 – 105 mg/dl. The remaining subjects did not have a family history of DM, and their fasting glucose level was between 72 – 256 mg/dl. Ferritin levels of 115 subjects were between 851 – 16,583 ng/ml. The average value for ferritin was 6,425 3,300.24 ng/ml.
For -thalassemia major patients receiving repeated blood transfusion, excessive iron in the tissue is an important adverse event that should be taken into account in the management. Beta-thalassemia patients without blood transfusion have increased absorption of iron through the digestive tract causing an increase in iron reserve by 2 to 5 g/year (reference). Regular repeated blood transfusion enhances the increment of iron deposit in the tissue. After one year of regular
blood transfusions, iron begins to accumulate in the parenchyma, e.g. in reticuloendothelial cells and may cause toxicity. This iron deposit might exceed the capacity of serum transferrin to bind and neutralize the iron. Unbound iron (non-transferrin bound iron = NTBI) will cause free radicals formation. Free radical will damage the lisosome membrane, cell, and mitochondria through lipid peroxidation reaction. The reaction will cause cell death, and finally, organ damage. In addition, free radicals also stimulate collagen tissue formation, and interact with DNA that might become a predisposition for carcinoma of the liver.
According to Finch, the term iron deposit is used for every condition with total iron reserves of more than 4 g or ferritin level of more than 700 ng/mL.8
In this study we found ferritin levels between 851 – 16,583 ng/mL, from which we concluded that all patients suffered from iron deposit, which is capable in interfering with the function of the pancreas. This condition may cause hemochromatosis. According to Kumar et al,9 at this stage the pancreatic tissue showed diffuse interstitial fibrosis with excessive iron deposit, together with atrophy of the parenchyma. Iron deposit might be found in the acini of Langerhans islets, and sometimes in interstitial tissue, that cause insulin deficiency. Insulin deficiency leads to impaired fasting glucose (IFG) or DM.
The mechanism of IFG or DM in -thalassemia major
patients remains unclear. In addition to pancreas -cell destruction by free radicals that destroy the -cell membrane through lipid peroxidation reaction, it can also be due to iron deposit that stimulates free radical formations leading to insulin resistance due to liver damage such as cirrhosis of the liver. Another factor is genetic factor that is reflected from the history of DM in the family. From all 17 subjects with IFG and 3 subjects with DM there were none having a history of DM in the family, therefore this study could not find any relation between DM family history and the prevalence of IFG or DM. In addition, there are other conditions that are regarded as risk factors for DM, e.g. viral infection, obesity, and bad eating habit, hyper-glycemia inducing drug intake, aging, and stress.10
of IFG was 14.8%, with an age range of 10-20 years, and ferritin levels ranging from 3,414 to12,578 ng/ml. The lowest ferritin level that concurs with IFG and DM was 3,414 and 2,746 ng/ml, respectively. In this study, endocrine malfunction in thalassemia major patients usually occurs at the beginning of the second decade, and most often in the form of glucose metabolism disturbance, i.e. DM. The lowest ferritin level that concurs with DM was lower than the lowest ferritin level that coincides with IFG. This might be due to the higher reserves in pancreatic endocrine function in patients with IFG. Therefore, a high ferritin level does not always lead to DM.9
In this study, the prevalence of DM was lower compared to that of a population based multi-center study. The population based multi-centered study was conducted in 1995, in Italy, and showed a prevalence of 4.9%.11 A study in a mixed (London and Italian) population, conducted by de Sanctis et al., in Ferrara, showed a DM prevalence of 20.6%.5 Furthermore, a
study conducted by El-Hazmi et al in Saudi Arabia,12
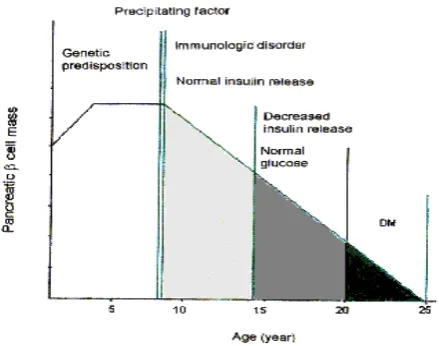
and by Karahanyan et al in Bulgaria,13 showed a prevalence of 6% and 18.8%, respectively. In our study, the prevalence of impaired glucose tolerance test (IGTT) was also lower compared to the result of El-Hazmi et al in Saudi Arabia which was 24 %.12 Our study revealed that the prevalence of DM was much lower than the prevalence of IFG. Diabetes mellitus with obvious symptoms occurs when almost all of the beta cells of the pancreas are damaged. Therefore, there were more IFG than DM cases, as shown in Fig. 4.9
Figure 4. The stages of type I DM. (cited and modified from Kumar et al.9)
Another possibility, to explain the difference in the prevalence of DM and IFG between our study compared to other studies, is the geographical location of Indonesia. Indonesia is located in the equatorial region. The prevalence in various countries showed that the farther a country is located from the equator, the higher the prevalence of type 1 DM. In Scandinavia, which is located in Northern Europe, the prevalence of type 1 DM was the highest in the world, while in Southern Europe, e.g. Malta, the prevalence was very low.9,14 According to Kumar et al.,9 type 1 DM occurs more often in North European population, while in other races including black people, correlation between ferritin and glucose levels. This fact might be due to the high reserve in pancreatic endocrine function in the population studied. Therefore, although an increase in ferritin level occurred, the pancreas is able to secrete enough insulin. In addition, these patients might obtain high ferritin levels from intracellular ferritin released by damaged cells due to inflammation, infection, necrosis, and malignancy process, and the possibility of the presence of HFE gene that increased iron absorption in the intestines.
CONCLUSIONS
REFERENCES
1. McKenzie SB. Anemias caused by abnormalities in globin biosynthesis. In : McKenzie, editors. Textbook of hematology. 2nd ed. London : William & Wilkins; 1996. p. 164-71.
2. Weatherall DJ. The thalassemia. In : Stamatoyanopaulous, George, editors. The molecular basis of blood diseases. 2 nd ed. Philadelphia : WB Saunders Co.;1994. p. 127 – 205. 3. Pippard MJ, Callender ST, Warner GT, Wetaherall DJ. Iron absorption and loading in beta-thalassemia intermedia. Lancet 1979 ; 2 : 819-21.
4. Pootrakul P, Kitcharoen K, Yansukon P, et al. The effect of erythroid hyperplasia on iron balance. Blood 1988 ; 71 : 1124-9.
5. De Sanctis V, Wonke B. Growth and endocrine complications in thalassaemia. 1 st ed. Roma : Mediprint, 1998 : 7 - 42.
6. Anonymous. Leaflet IMx system Ferritin list No. 2219. Abbott laboratories diagnostics division, 1991.
7. WHO Study Group. Prevention of diabetes mellitus. WHO Technical report series 1994; 884 : 93.
8. Finch CA, Hulbers H. Perspectives in iron metabolism. N Eng J Med 1982; 306 (25):1520-8.
9. Kumar V, Cotran RS, Robbins SL. The pancreas. In : Kumar V, Cotran RS, Robbins SL, editors. Basic pathology. 6th ed. Philadelphia : W.B. Saunders Company; 1997 .p. 563 - 6. 10. Suyono S. Pathophysiology in diabetes mellitus. In :
Soegondo S, Soewondo P, Subekti I, editors. Diabetes mellitus comprehensive management. 1 st ed. Jakarta : CV. Aksara Buana; 1999 .p. 5-10. (in Indonesian) 11. Italian Working Group on Endocrine Complications in
Non-endocrine Diseases. Multicentre study on prevalence of endocrine complications in thalassemia major. Clin Endocrinol 1995 ; 42 : 581 - 6.
12. El-Hazmi MAF, Al-Swailem A, Al-Fawaz I, Warsey AS, Al-Swailem AM. Diabetes mellitus in children suffering from thalassemia. J Trop Ped 1994 ; 40(10) : 261 - 6. 13. Karahanyan E, Stoyanova A, Moumdzhiev I, Ivanov I.
Secondary diabetes in children with thalassemia major (homozygous thalassemia). Folia Medica 1994; 36(1) : 29-34. 14. Zimmet P, Serjeantson S. The epidemiology of diabetes
mellitus and its relationship with cardiovascular disease. In : PJ Lefebvre, E Standl eds. New Aspects in Diabetes, Treatment Strategy with Alpha-Glucosidase Inhibitors. 15. Bacon BR, Tavill AS. Hemochromatosis and the iron