DOI: 10.12928/TELKOMNIKA.v14i1.2681 378
A Quality of Images Fusion for Remote Sensing
Applications
Yuhendra*1, Josaphat Tetuko Sri Sumantyo2 1
Department of Informatics, Faculty of Engineering, Padang Institute of Technology, Indonesia 2
Microwave Remote Sensing Laboratory, Chiba University, Japan *Corresponding author, email: [email protected]
Abstract
Image fusion is a useful tool for integrating low spatial resolution multispectral (MS) images with a high spatial resolution panchromatic (PAN) image, thus producing a high resolution multispectral image for better understanding of the observed earth surface. It has has become an important issue for various remotes sensing (RS) problems such as land classification, change detection, object identification, image segmentation, map updating, hazard monitoring, and visualization purposes. When applied to remote sensing images, a common problem associated with existing fusion methods has been the color distortion, or degradation in the spectral quality. The main proposed of this research is to evaluate the quality of fused images for object identification. We examine the effectiveness of the following techniques multi-resolution analysis (MRA) and component substitution (CS) fusion. In order to improve this situation, the second purpose of this work is to establish an automatic and reliable way for the evaluation of the fused images, on the basis of both qualitative and quantitative metrics. In this result, It is found that the CS fusion method provides better performance than the MRA scheme. Quantitative analysis shows that the CS-based method gives a better result in terms of spatial quality (sharpness), whereas the MRA-CS-based method yields better spectral quality, i.e., better color fidelity to the original MS images.
Keywords: Image fusion, multispectral, panchromatic, object identification, fast Fourier transform (FFT) -enhanced IHS (FFT-E)
Copyright © 2016 Universitas Ahmad Dahlan. All rights reserved.
1. Introduction
The recent increase in earth observing satellites such as Geo-Eye, Worldview, Quickbird, Ikonos, Landsat, EO-1(ALI sensor) has led to the availability of high resolution images of various types from Remote Sensing (RS). The availability of a variety of airborne as well as space-borne sensors has led to various data sets of different spatial, spectral and temporal resolutions. Most of these sensors have multispectral (MS) and panchromatic (PAN) images. In contrast, the panchromatic (PAN) image is a grayscale image, but its wide spectral coverage makes it possible to attain much higher spatial resolution [1]. The high spatial information content of PAN images is well-suited for intermediate scale mapping and urban classification studies [2, 3]. Although the combinatory analysis of MS and PAN images can, in principle, provide all the spatial and spectral features concerning the target pixels, better interpretation of high-resolution satellite imagery can often be attained using a pan-sharpened image that is obtained through image fusion [4, 5].
desirable to give a general assessment of the quality of the fused images from the viewpoint of practical use. In this paper, we use fusion algorithm to assess the capability of fusion using multi-resolution analysis (MRA) and component substitution (CS) algorithm to observe of fused image for better quality in object identification. Also, we apply the following statistical approaches for standardizing and automating the evaluation process of the fused images. First, qualitative assessment is made with conventional visual inspection. Then, we examine the spectral quality between the original MS and the fused images.
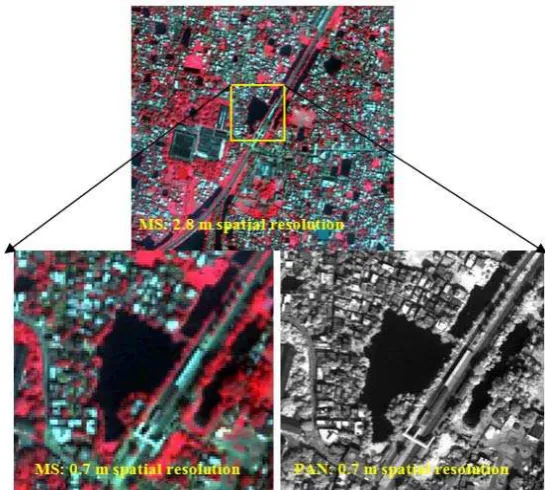
Figure 1. Concept of image fusion
2. Study Area and Satellite Data
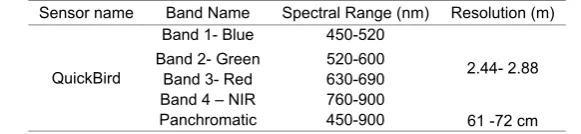
The study site for this work is located in Kolkata area (88°20’27.84”E, 22°32’45.67”N), India, obtained in November 2004 and distributed in the Global Land Cover Facility (http://glcf.umiacs.umd.edu/index.shtml). The PAN sensor collects information in the visible and near infrared wavelengths of 0.45-0.90 µm. The area covered in this imagery is mainly an urban area with a structured road, water, roof, tree, shadow and grass. The spectral bands information of sensors was shown in Table 1.
Table 1. The spectral bands information of optical sensor QuickBird satellite imagery Sensor name Band Name Spectral Range (nm) Resolution (m)
QuickBird
Band 1- Blue 450-520
2.44- 2.88 Band 2- Green 520-600
Band 3- Red 630-690 Band 4 – NIR 760-900
Figure 2. Spectral response curves for QuickBird satellites
3. Research Method
3.1. Spectral Response and Range of Sensor
Significant spectral distortion in image fusion occurs due mainly to the wavelength extension of the new satellite PAN sensors. Table 1 and Figure 2 show the spectral band and spectral response of satellites QuickBird sensors. In image fusion techniques, it is important to include sensor spectral response information [1], since, first, in order to preserve physical meaning of merged spectral bands, the sensor spectral response for each band has to be taken into account and second, image fusion techniques aim at recovering the image obtained by an ideal virtual sensor with the same spectral sensitivity of the MS and spatial resolution of the PAN sensor.
3.2. Spatial Resolution Ratio
The spatial resolution ratio improvement can make a sharpen image while preserving spectral information contained in the fused images. Since PAN images usually have a better spatial resolution than the multispectral images of the same sensor, while the MS images provide spectral properties of the objects. In image fusion, spatial resolution ratio plays an important role in image fusion. The spatial resolution ratio can be defined as the ratio between the spatial resolution of the high resolution PAN image and that of the low resolution MS image [23]. The both of spatial resolution ratio of PAN to MS image 1:4. It is often a challenge fused images with such a high spatial resolution ratio.
3.3. Band Selection Processing by the OIF
Band selection is a key step of fusion techniques. For this purpose, values of optimum index factor (OIF) are useful for designating the most favorable band combination according to their nformation [24]. Generally, a larger standard deviation of an image infers that it involves more information. Thus, the OIF is defined [25] as:
Where σi is the standard deviation of each of the three selected bands and rj is the correlation
coefficients (CCs) between any pair formed by these bands (Table 2).
3.4. Re-sampling
Figure 3. Image Subset for re-sampling in single sensor images
3.5.1. Multi-resolution Analysis (MRA)
Figure 4. FFT- enhanced IHS Techniques based on MRA
hue (H), and saturation (S) components, and low-pass filtering (LPF) is applied to the intensity component. After high-pass filtering (HPF), the PAN image is added to the low-pass filtered intensity component by means of inverse FFT (FFT-1). Finally, inverse IHS transformation (IHS -1
) is performed on the IHS image to create the fused image.
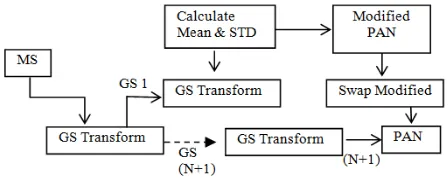
3.5.2. Component substitution (CS)
All fusion methods which do not make use of a filtering process to extract the high frequency details from the PAN image fall in the category of component substitution methods. The principle idea is to add the details of the PAN image into the MS images making use of some transformation. Gram-Schmidt (GS), Intensity-Hue-Saturation (IHS) based fusion methods, Brovey transform based fusion, PCA based fusion, all fall in the category of CS or Component Substitution Methods.
Figure 5. GS Techniques based on CS
3.6. Spectral Quality
The quality of fused image was assessed by means of some quality measures that can predict perceived image quality automatically. In this work, two types of quality assessment approaches are taken, namely qualitative (visual analysis and quantitative methods. The visual analysis is based on the visual comparison of the color between the original MIs and the fused image and that of the spatial details between the original PI and the fused image. These methods inevitably involve subjective factors and personal preference that can influence the result of evaluation. While visual inspection has limitation due to human judgment, quantitative approach based on the evaluation of “distortion” that is brought about by the noise added to the fused image is more desirable for mathematical modeling [27].
In this work, a validation method is proposed based on a quality criterion, namely, the relative average spectral error (RASE) [28-29] and relative dimensionless global error(ERGAS) [30,31] parameter. It is based on root mean squared error (RMSE) [32] to estimation and chosen as a robustness criterion. This statistical parameter is often used for evaluation of fusion techniques. These parameters are defined as follows:
1) Relative Average Spectral Error (RASE) is used to estimate the global spectral quality of the fused images. the root mean square error computed as:
)
4.1. Quality Assessment
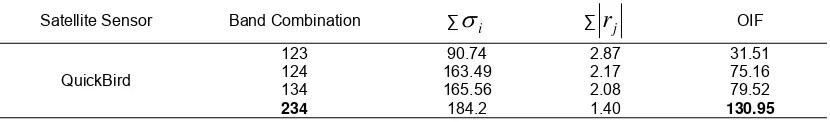
The quality of fused image was assessed by means of some quality measures that can predict perceived image quality automatically. In this work, two types of quality assessment approaches are taken, namely qualitative (visual analysis and quantitative methods. In the visual analysis, image quality is important task in the evaluation, especially in the spectral quality. The spectral quality is denotes well the in pixel of the fusion images match the colors in the original MS is denotes well the sharpness of the image is retained compared to the PAN. A good fusion method have guarantee the preservation of the spectral information of the MS image. A preserve the color is important criterion in evaluating the performance of image fusion. In general, main fusion problem is color distortion has been reported by Zhang (Zhang, 2000). From visual comparison assessment, color combinations of MS bands are produced and analyzed using the optimum index factor (OIF), an index proposed by Chavez et al. [28]. Only three bands (R-G-B) can be employed from the four bands. Thus, these three spectral bands should be selected so as to project the multispectral information as efficiently as possible onto the final pseudo-color image, and this can be achieved by maximizing the OIF. For QuickBird, the maximum OIF (130.95) has been obtained with the same band combination of 2-3-4 as shown in Table 2.
Table 2. OIF index for bands combination the original MS images
Satellite Sensor Band Combination ∑
i ∑r
j OIFQuickBird
123 90.74 2.87 31.51
124 163.49 2.17 75.16
134 165.56 2.08 79.52
234 184.2 1.40 130.95
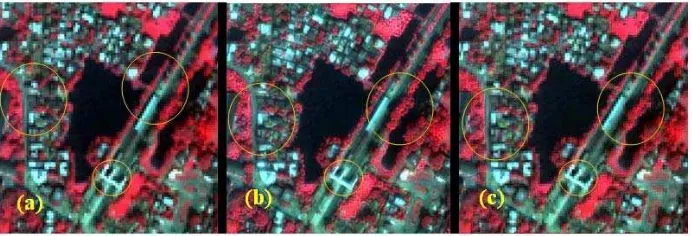
Figure 6(a) shows the false-color composite of the 2-3-4 bands of QuickBird. The pan-sharpened images resulting from the five different image fusion techniques are shown in Figure 6. A major problem in image fusion is color distortion [30]. Preservation of color information is an important criterion in evaluating the performance of different image fusion methods. Before being compared with the original MS images (Figure 6(a)), the fused images must be re-sampled to match the resolution of the original MS image (Figure 3). Ideally, when a fused image is re-sampled, the original color information should be reproduced again [20]. The results in Figure 4 indicate that there is no apparent color distortion in all the fused images as far as the preservation of color information is concerned. Concerning the color preservation it is found that all fused image are closer to the original image. This means that all the techniques can preserve the spatial information for the fusion images.
images. The results of the inter-band correlation (Table 4, on the other hand, indicate that GS fusion method gives results that show similarity with the original MS images.
Figure 6. Results of the false color composite of the QuickBird image: (a) composite of the 2-3-4 bands of the original MS images, and the results of different fusion techniques, with (b) CS and
(c) MRA
Table 3. Spectral correlation for QuickBird .QuickBird waveband ( µm)
Fusion Technique Band 2 (0.52-0.60)
Band 3 (0.63- 0.69)
Band 4
(0.76- 0.90) Average
Original Image (MS) 0.937 0.941 0.951 0.943
CS 0.925 0.930 0.940 0.931
MRA 0.912 0.951 0.967 0.943
Table 4. Inter-band correlation
Fusion Technique Band 2-3 Band 2-4 Band 3-4
Original Image (MS) 0.966 0.377 0.268
GS (CS) 0.961 0.367 0.244
FFF-E (MRA) 0.942 0.359 0.261
4.2. Performance Comparison using Spectral Quality
A thorough examination of spectral quality is made for fused images using the following spectral quality parameters: RMSE, ERGAS, PNSR and RASE. The fused image that best preserves the original spectral information, and hence exhibits the highest spectral quality, can be characterized with the following conditions: (i) the smallest values for the error parameters (RMSE, RASE and ERGAS), and (iii) the highest possible value of PSNR. Tables 5 summarize the results of the present analysis. In Table 5, we can see that the fused image based on GS exhibits the smallest the ERGAS and RASE errors when all bands are considered. Smaller values of spectral distortion given by PSNR (Table 6) are associated with high RMSE values in Table 7. On the basis of Table 5-7, one can conclude that, the CS (GS) method provides good spectral quality, preserving the spectral information contained in the original MS images than MRA (FFT-E) method.
Table 5. Global spectral information evaluation indicator of fused image
Parameter Techniques Fusion QuickBird
Band-2 Band-3 Band-4
ERGAS CS 0.10 0.20 0.33
MRA 0.25 0.48 0.04
RASE CS 15.35 25.69 11.02
5. Conclusion
In order to improve the spatial resolution and enhance structural/textural information while preserving the spectral information in MS images, two fusion methods of MRA and CS have been used for the quality assessment of the produced fused images. In both quantitative and qualitative results, it has been found that the CS based method leads to better spatial quality (sharpness), whereas the MRA based method better spectral quality (fidelity to the original color). In the future research, the methodology presented in this paper can be extended to include the fusion of optical and synthetic aperture radar (SAR) images from satellite remote sensing.
Acknowledgements
We would like to thank Global Land Cover Facility (GLCF) for providing the free download QuickBird data from (http://glcf.umiacs.umd.edu/index.shtml), and the anonymous reviewer for valuable comments and suggestions that helped in improving the clarity and quality of this paper.
References
[1] Pohl C, Van Genderen JL. Multisensor image fusion in remote sensing: concepts, methods, and applications. International Journal of Remote Sensing. 1998; 19(5): 823-854.
[2] Qin Y, De-xiang Z, Qing-wei G, Dong L, Yi-xiang L. Fusion of multi-band SAR images based on directionlet transform. TELKOMNIKA Indonesian Journal of Electrical Engineering. 2014; 12(1): 506-513.
[3] Wald L, Ranchin T, Mangolini M. Fusion of satellite images of different spatial resolutions: Assessing the quality of resulting images. Photogrammetry Engineering Remote Sensing. 1997; 63(6): 691-699. [4] Zhang Y. Problems in the Fusion of Commercial High-Resolution Satellite Images as well as Landsat
7 Images and Initial Solutions. International Archives of Photogrammetry and Remote Sensing (IAPRS), GeoSpatial Theory, Processing and Applications. 2002; 34(4).
[5] Konstantinos G, Nikolakopoulos. Comparison of Nine Fusion Techniques for Very High Resolution Data. Photogrammetric Engineering & Remote Sensing. 2008; 74(5): 647-659.
[6] Cetin M, Musaoglu N. Merging hyperspectral and panchromatotic image data: qualitative and quantitative analysis. International Journal of Remote Sensing. 2009; 30(7): 779-1804.
[7] Vijayaraj V, Younan N, O'Hara C. Concepts of image fusion in remote sensing application, IEEE Trans. Geosciences Remote Sensing. 2006; 10(6): 3781-3784.
[8] Ghosh A, Joshi PK. Assesment of pan-sharpened very high resolution WorldView-2 images. International Journal of Remote Sensing. 2013; 34(23): 8336-8359.
[9] Nikolakopoulos K, Oikonomidis D. Quality assessment of ten fusion techniques applied on Worldview-2. European Journal of Remote Sensing. 2015; 48: 141-167.
[10] Kumar U, Mukhopadhyay C, Ramachandra TV. Pixel based fusion using IKONOS imagery. Int. J. Recent Trend in Engineering. 2009; 1(1): 173-175.
[11] Ling Y, Ehler M, Usery EL, Madden M. FFT-enhanced IHS transform method for fusing high-resolution satellite images. ISPRS Journal of Photogrammetry & Remote Sensing. 2007; 61: 381-392
[12] Choi M. A new intensity-hue-saturation fusion approach to image fusion with a tradeoff parameter. IEEE Trans. Geosciences Remote Sensing. 2006; 2(44): 1672-1682.
[14] Du Q, Younan NH, King R, Shah VP. On the performance evaluation of pan-sharpening techniques. IEEE Geosciences Remote Sensing Letter. 2007; 4(4): 518-522.
[15] Bovolo F, Bruzzone L, Capobianco L, Garzelli A, Marchesi S. Analysis of effect of pan-sharpening in change detection. IEEE Geoscine. Remote Sensing Letter. 2010; 7(1).
[16] Shah VP, Younan NH, King RL. An efficient pansharpening method via a combined adaptive PCA approach and contourlets. IEEE Trans. Geosciences Remote Sensing. 2008; 4.
[17] Kumar U, Mukhopadhyay C, Ramachandra TV. Pixel based fusion using IKONOS imagery. International Journal Recent Trend in Engineering. 2009; 1(1): 173-175.
[18] Wang L, Cao X, Chen J. ISVR: an improve synthetic variable ratio method for image fusion. Geocarto International. 2008; 23(2): 155-165.
[19] Rahman MM, Sri Sumantyo JT, Sadek MF. Microwave and optical image fusion for surface and sub-surface feature mapping in Eastern Sahara. International Journal Remote Sensing. 2010; 31(20): 5465-5480.
[20] Ehler M, Klonus S, Astrand PJ, Rosso P. Multi-sensor for pansharpening in remote sensing. International Journal Image and Data Fusion. 2010; 1(1): 25-45.
[21] Wald L, Ranchin T, Mangolini M. Fusion of satellite images of different spatial resolutions: Assessing the quality of resulting images. Photogrammetry Engineering. Remote Sensing. 1997; 63(6): 691-699. [22] Karathanassi V, Kolokousis, Ionnidou S. A comparison study on fusion methods using evaluation
indicators. International Journal Remote Sensing. 2007; 28(10) : 2309-2341.
[23] Tian S, Zhang J, Yuan Y, Chang B. Multi-source image fusion technology in different fields of few. TELKOMINIKA. 2013; 11(9): 4596-4962.
[24] Li Z, Jing X, Yang S. Color transfer based remote sensing image fusion using non-separable wavelet frame transform. Pattern Recognition Letter. 2005; 26(13): 2006-2014.
[25] Simone G, Farina A, Morabito FC, Serpico SB, Bruzzone L. Image fusion techniques for remote sensing application. Information fusion. 2002; 23: 3-15.
[26] Otazu X, González M, Fors O, Núñez J. Introduction of Sensor Spectral Response Into Image Fusion Methods. Application to Wavelet-Based Methods. IEEE Transactions on Geoscience & Remote Sensing. 2005; 43(10): 2376-2385.
[27] Tsagaris V, Anastassopoulus V. Multispectral image fusion for improved RGB based on perceptual attributes. International Journal Remote Sensing. 2005; 26(15): 3241-3254.
[28] Chavez PS, GL Berlin, LB Sowers. Statistical method for selecting Landsat MSS ratios. Journal of Applied Photographic Engineering. 1982; 8: 23-30.
[29] Zhang Y. Problems in the Fusion of Commercial High-Resolution Satellite Images as well as Landsat 7 Images and Initial Solutions. International Archives of Photogrammetry and Remote Sensing (IAPRS), GeoSpatial Theory, Processing and Applications. 2002; 34(4).
[30] Li S, Li Z, Gong J. Multivariate statistical of measures for assessing the quality of image fusion, International Journal of Image and Data Fusion. 2010;1: 47-66.
[31] González AM, Saleta RG, Catalán R García. Fusion of multispectral and panchromatic images using improved IHS and PCA mergers based on wavelet decomposition. IEEETransactions on Geoscience & Remote Sensing. 2004; 42: 1291-1299.