Traffic Light Strategies in Optimizing the Traffic Flow
E
NDARH.
N
UGRAHANI1,
L
UKMANA
LAMSYAH,
R
ISWANR
AMDHANIMathematics Department, Bogor Agricultural University 1 E-mail: [email protected]
Abstracts. The behavior of traffic system controlled by traffic lights on a single lane is presented using the optimal velocity model. The effect of differrent traffic light control strategies on the traffic flow is discussed using three different strategies, i.e. the synchronized, green wave, and random offset strategies. The flow-density diagrams are analyzed using these strategies. It is found that the saturation of the flow occurs at the critical density, which depends on the cycle time of the traffic light and the strategy being used. On the other hand, the value of saturated flow does not depend on the cycle time or on the strategies.
The numerical investigation is carried out using cellular automata
model to get a better understanding of the microscopic behavior of the
three different traffic light strategies.
Keywords
: traffic light, traffic flow, cellular automata
Introduction
There have been several approaches in mathematical modeling of traffic flow [2,4,6]. One approach, from a microscopic view, studies individual movements of vehicles and interactions between vehicle pairs. This approach considers driving behavior of every single vehicle and vehicle pair dynamics [2,4]. Another approach studies the macroscopic features of traffic flows such as flow rate, traffic density and travel speed [4]. The other approach in analyzing the traffic phenomena is by using the kinetic theory approach in analogy with gas dynamics in physics, which is called the kinetic theory of vehicular traffic [2,6]
Because of ist function to support modern lifestyle, everybody tends to take part in the system of vehicular traffic. As a consequence, there are getting more-more vehicles on the streets. Unfortunately, the capacity of the existing street networks is often exceeded. Therefore, this situation often leads to some traffic problems such as traffic jams. The mathematical explanations and discussions on this matter has been done and getting more-more attention [5].
In urban networks, the flow is controlled by traffic lights. This can be considered as one possibility to reduce the traffic problems. But unfortunately, traffic engineers are often forced to question if the capacity of the network is exploited by the chosen control strategy. One possible method to answer such questions could be the use of vehicular traffic models in control systems as well as in the planning and design of transportation networks. For almost half a century, there were strong attempts to develop a theoretical framework of traffic science [3,7]. For some simulation works, the reader could refer to [1,7]
The Optimal Velocity Model
The optimal velocity model is described by the following equation of motion of car i:
( )
⎭ ⎬ ⎫ ⎩
⎨
⎧ Δ −
=
dt dx x V a dt
x
d i
i i
2 2
(1)
where xi(t) is the posisiton of the i-th car at time t,
V
( )
Δ
x
i is the optimal velocity function,i i
i
x
x
x
=
−
Δ
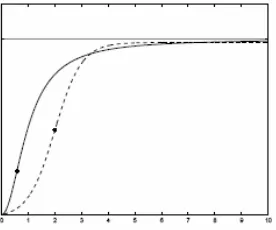
+1 is the headway of the i-th car, and a is the sensitivity. With this model the behavior of a given car in a traffic system is described as follows. A driver always adjusts the car velocity to approach the optimal velocity, which is determined by the observed headway. Moreover his movement will also be influenced by the sensitivity a, which allows for the time lag τ that it takes for the car velocity to reach the optimal velocity, where τ = 1/a. [image:2.595.229.367.315.430.2]The basic properties of an optimal velocity function are as follows. Is should be a mononically increasing function. Moreover, it should have an upper bound (maximal velocity), which could be determined by the traffic rule or by the technical limitations of the vehicle. Generally the graph of an optimal velocity function could take a form given in the following figure.
Figure 1. The general Optimal Velocity Functions.
According to these basic properties, the following typical function is being chosen [S and N, 2003]
( )
i[
(
xi xc)
( )
xc]
Vx
V tanh tanh
2
max Δ − +
=
Δ (2)
where Vmax is the maximal velocity mentioned above.
Traffic Light Strategies
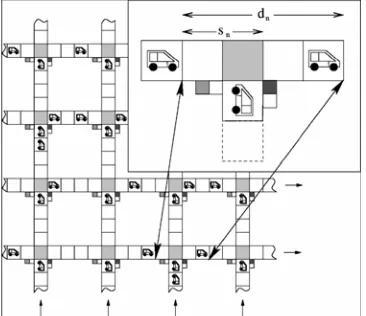
To be considered is the traffic flow on a single-lane roadway. There is a set of two traffic lights defined on this single-lane roadway, which is illustrated in Fig 2. Let the length of the roadway
is L and the interval between the two traffic lights is L/2. The traffic flow is being studied under the
periodic boundary condition, which means that for a given infinite road length, this schema is simply repeated periodically.
[image:2.595.173.420.651.753.2]There are three traffic light strategies to be considered, i.e. the synchronized, the green wave, and the random offset strategy. In synchronized strategy, the traffic lights are chosen to switch simultaneously after a fixed time period T/2. The traffic lights are assumed to flip periodically (green and red respectively) at regular time intervals T/2. Time T is called the cycle time of the traffic light. In the green wave strategy, the traffic light changes with a certain time delay Tdelay between the traffic light phases of two successive intersections. In the random switching strategy, the cycle time T changes randomly and the traffic lights change independently.
In the simple synchronized strategy where all traffic lights change simultaneously from red (green) to green (red), the traffic flow does not depend on the number of traffic lights for the periodic boundary, but is affected by the space interval between the traffic lights. Therefore, the traffic problem reduces to the simple case of a single roadway with one traffic light in the synchronized strategy.
Theoretical Results
If the average headway h satisfies the linear instability condition, the traffic jams appear. The transition point of the jamming is given by the following instability condition [7]
( )
h Va<2 ' (3)
where V’(h) is the derivative of the optimal velocity function. When the headway (density) is less (higher) than the critical value, the traffic flow becomes unstable and the jamming transition occurs. If the jamming transition occurs, the spontaneous jam appears and it propagates backwardas the density wave. The kink solution of the density wave is given by
( )
( )
(
( )
( )
)
(
( )
)
( )
(
( )
)
⎥
⎦
⎤
⎢
⎣
⎡
⎟
⎠
⎞
⎜
⎝
⎛
−
−
−
−
±
=
Δ
V
x
i
V
x
V
x
t
x
V
x
V
x
V
x
t
x
c c cc c c c i
6
1
'
2
'
5
2
1
'
2
5
tanh
''
'
1
'
2
'
5
τ
τ
τ
The headways within and out of the jam are given as follows:
⎟ ⎠ ⎞ ⎜ ⎝ ⎛ − − = Δ 1 2 5 a a x
xjam c c and ⎟
⎠ ⎞ ⎜ ⎝ ⎛ − + = Δ 1 2 5 a a x
xfree c c
where
a
1
V
maxc
c
=
τ
=
[7].Simulation Results using Cellular Automata
In this paper, we analyze the impact of global traffic light control strategies, in particular, synchronized traffic lights, traffic lights with random offset, and with a defined offset in a recently proposed CA model for city traffic. Chowdhury and Schadschneider (CS) combine basic ideas from the Biham-Middleton-Levine (BML) model of city traffic and the Nagel-Schreckenberg (NaSch) model of highway traffic [1].
number of vehicles on each street is conserved. However, in the last few years, various modifications and extensions have been proposed for this model.
The NaSch model is a probabilistic CA model for one-dimensional highway traffic. It is the simplest known CA model that can reproduce the basic phenomena encountered in real traffic, e.g., the occurrence of phantom jams (‘‘jams out of the blue’’). In order to obtain a description of highway traffic on a more detailed level, various modifications to the NS model have been proposed and many CA models were suggested in recent years. The motion in the NS model is implemented by a simple set of rules. The first rule reflects the tendency to accelerate until the maximum speed vmax is reached. To avoid accidents, which are forbidden explicitly in the model, the driver has to brake if the speed exceeds the free space in front. This braking event is implemented by the second update rule. In the third update rule, a stochastic element is introduced. This randomizing takes into account the different behavioral patterns of the individual drivers, especially nondeterministic acceleration as well as overreaction while slowing down. Note, that the NaSch model with vmax = 1 is equivalent to the ASEP which, in its deterministic limit, is used for the movement in the BML model.
One of the main differences between the NaSch model and the BML model is the nature of jamming. In the NaSch model, traffic jams appear because of the intrinsic stochasticity of the dynamics. The movement of vehicles in the BML model is completely deterministic and stochasticity arises only from the random initial conditions. Additionally, the NaSch model describes vehicle movement and interaction with sufficiently high detail for most applications, while the vehicle dynamics on streets is completely neglected in the BML model (except for the effects of hard-core exclusion).
In order to take into account the more detailed dynamics, the BML model is extended by inserting finite streets between the cells. On the streets, vehicles drive in accordance to the NS rules. Further, to take into account interactions at the intersections, some of the prescriptions of the BML model have to be modified. At this point, we want to emphasize that in the considered network, all streets are equal in respect to the processes at intersection, i.e., no streets or directions are dominant. The average densities, traffic light periods, etc., for all streets (intersections) are assumed to be equal in the following discussions.
[image:4.595.207.390.582.740.2]In this result, it can be shown that a simple change of the update rules is sufficient to avoid the transition to a completely blocked state that occurs at a finite density in analogy to the BML model. Note, that this blocking is undesirable when testing different traffic light control strategies and is therefore avoided in our analyses. Furthermore, different global traffic light control strategies are presented and their impact on the traffic will be shown. Further it is illustrated that most of the numerical results affecting the dependence between the model parameters and the optimal solutions for the chosen control strategies may be derived by simple heuristic arguments in good agreement with the numerical results. In the summary, the results may be used benefitably for real urban traffic situations and whether it could be useful to consider improved control systems, e.g., autonomous traffic light control.
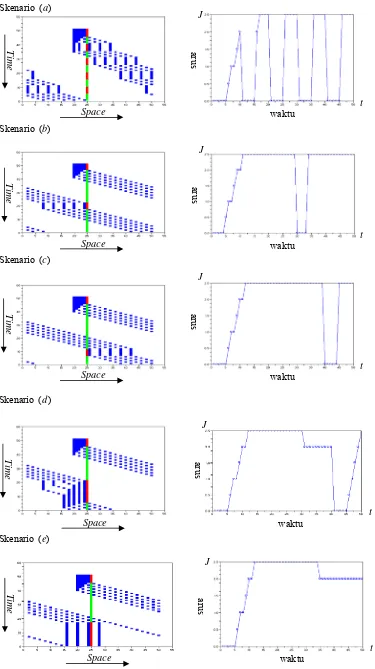
Figure 4. The simulation results for the synchronized strategy using low traffic density. Skenario ( )a
Time
Space
t
waktu
J
arus
Skenario ( )b
Space
Time
t
waktu
J
arus
Skenario ( )c
Space
Time
t
waktu
J
arus
Skenario ( )d
Space
Time
t
waktu
J
arus
Skenario ( )e
Space
Time
t
waktu
J
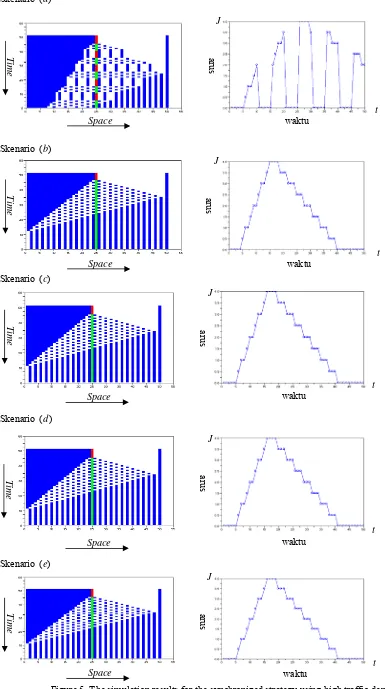
Figure 5. The simulation results for the synchronized strategy using high traffic density. Skenario ( )a
Space
Time
t
waktu
J
arus
Skenario ( )b
Space
Time
t
waktu
J
arus
Skenario ( )c
Space
Time
t
waktu
J
arus
Space
Time
t
waktu
J
arus
Skenario ( )d
Space
Time
t
waktu
J
arus
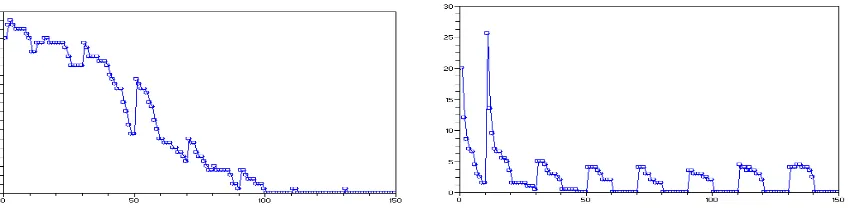
Figure 6. Simulation results for the green wave strategy.
Concluding Remarks
From the above discussions, some remarks could be given. Firstly, the optimal velocity model in traffic flow can describe the occurance of traffic jams by determining the critical headway. Secondly, among the traffic light strategies, the random offset gives the best value of traffic flow.
Finally, it is worth to mention that some further studies are still needed to be done to consider different strategies and/or different assumptions. Also it is still needed to find the actual optimal cycle time of the traffic light, so that this result can be implemented directly in the real situation.
Acknowledgements
This research is partially funded by the Research Grant of the 2005 A2 Project of the Department of Mathematics, Bogor Agricultural University, Indonesia.
References
[1] E. Brockfeld, R. Barlovic, A. Schadschneider, M. Schreckenberg. Optimizing traffic lights in a cellular automaton for city traffic. Physical Review E 64, 056132 (2001).
[2] I. Gasser and J. Struckmeier. Traffic models. Workshop on Modeling in Life and Material Sciences and in Technology, ICTP, Trieste, Italy (2004)
[3] W. Jin. Traffic flow models and their numerical solutions. Thesis at the University of California Davis, 2000.
[4] K. Nagel. Particle hopping vs. fluid dynamical models for traffic flow, LA-UR Preprint 95-4018
(1995).
[5] K. Nagel and H. J. Herrmann. Deterministic models for traffic jams, HLRZ Preprint 46/93
(1993).
[6] I. Prigogine and R. Herman, Kinetic Theory of Vehicular Traffic, Elsevier, Amsterdam, 1971.
[7] M. Sasaki and T. Nagatani. Transition and saturation of traffic flow controlled by traffic lights.