ISSN: 1693-6930
accredited by DGHE (DIKTI), Decree No: 51/Dikti/Kep/2010 55
An Algorithm for Predicting the Speed of Traffic Light
Violators
Iswanjono*1,2, Bagio Budiardjo2, Kalamullah Ramli2
1
Dept. of Electrical Engineering, University of Sanata Dharma, Yogyakarta
Kampus III USD, Paingan Street, Maguwoharjo, Sleman, Telp/Fax: +62274-883037/886529 2
Dept. of Electrical Engineering, University of Indonesia, Jakarta Kampus Baru UI Depok 16424 - Indonesia; Telp/Fax: +6221-7270078/7270077
e-mail: [email protected]*1, [email protected], [email protected]
Abstrak
Pelacakan kendaraan yang menggunakan RFID dikembangkan mengingat tiga masalah utama, yaitu waktu sinyal lalu lintas, kemacetan di jalan dan pencurian kendaraan. Tulisan ini memaparkan suatu algoritma dalam memprediksi kecepatan kendaraan pelanggar lampu lalu-lintas. Algoritma terkini diimplementasikan ke dalam program simulasi. Sistem lampu lalu-lintas dilengkapi pembaca RFID sebagai piranti utama untuk mengidentifikasi kendaraan yang dilengkapi kartu RFID. Dalam simulasi, ID kendaraan dibangkitkan menggunakan pembangkit bilangan acak. Distribusi ID kendaraan adalah seragam dan diharapkan jumlah pelanggara lampu lalu-lintas tidak melebihi 3% dari seluruh ID yang dibangkitkan. Ketelitian penghitungan waktu prediksi kecepatan pelanggar lampu lalu-lintas adalah 100 mili-detik. Simulasi telah memenuhi kinerja yang diharapkan dan secara waktu-nyata mampu memprediksi kecepatan kendaraan pelanggar lampu lalu-lintas antara 5-80 km/jam.
Kata kunci: algoritma pelacakan, lampu lalu-lintas, predeksi kecepatan kendaraan, teknologi RFID
Abstract
The tracking of vehicles using RFID was developed consider three major problems, i.e. traffic signal timing, congestion on road and theft of vehicles. This paper describes an algorithm for predicting the speed of traffic light violators. The novel algorithm is implemented in the form of a simulation program. The traffic light system is equipped RFID reader as the main tool for identifying the vehicle’s RFID tags. In the simulation, the vehicle’s ID is generated using a random number generation. The distribution of the vehicle’s numbers is uniform and the expected number of vehicles violated the traffic light is not more than
3 % of the total number generated. The timing accuracy for speed traffic lights violator is 100 milli seconds.
From the simulation conducted, the algorithm has performed as expected. It is able to predict the speed of traffic light violators ranging from 5 km/h up to 80 km/h in real-time.
Keywords: tracking algorithm, traffic light, vehicle speed prediction, RFID technology
1. Introduction
This paper describes a novel algorithm for predicting the speed of traffic light violators. The word novel is used to capitalize that this kind of algorithm has never been develop in similar environments before. The algorithm is implemented in the form of a simulation program. The traffic light system is designed with radio frequency identification (RFID) as the main device for identifying the vehicles. It is assumed that all cars crossing the traffic light are equipped with active RFID tags.
The vehicle movement is monitored in four directions of the traffic light using a novel algorithm in real-time. In general, there are two ways of traffic light settings. The first is fixed time or fixed driven setting and the second one is the event driven setting [1]. All of the above mentioned settings resulted in the development of queues of vehicles in all traffic light directions.
and magnetic flux sensor for detecting stop line. RFID is used as the main sensor since it is capable of detecting and identifying either static or dynamic objects, such as vehicle movements in various speeds.
RFID technology is one of the most significant breakthroughs in object identification system. This technology has the potential to identify moving objects with high reliability and accuracy and very efficient in consuming bandwidth for transmitting the data [3]. The ID of vehicles could be easily identified if vehicles with RFID tags pass through a RFID reader in the proper path. Then, the IDs could be transmitted and processed in a relatively short period of time. It is logical to say that with this property, RFID could very well improve the scalability of moving vehicle detection compared to similar systems.
In this research, the model of simulation is developed with some assumptions. The RFID traffic light detection system is placed in the four way crossing. The flux detectors are placed in various positions such that it could detect a car (cars) crossing over it when the traffic light is red. A car will be detected as a violator if and only if it is also detected in the other branch of the crossing. The time difference between the RFID detection and the magnetic flux detection is used to predict the approximate speed of the violators in the traffic light crossing.
Recently, Radio Frequency Identification (RFID) technology is one of the most significant breakthroughs in object identification system. This technology has the potential to create various objects which have identification applications of information flow, reliability and high efficiency without requiring additional bandwidth. The information stored in the chip card-sized multiple-bits only, so it does not require wide bandwidth and can be accessed more quickly [3]. RFID applications in traffic systems can more easily monitor the movement of vehicles within the RFID network. Identity (ID) vehicles equipped with an RFID card (RFID tag) will be detected by an RFID reader in its path [4]. RFID together with Internet and GSM technologies are anticipated to create a revolution in traffic management and control systems. The database contains online statistical information, which can be used by operators and planners to develop the better models in the future [5]. The other RFID application, for examples, it was built model can be used in planning of exhibition, in modeling of visitor’s preferences, and/or in generation of prediction related to exhibition lasting, expected sales and pricing [6].
At relating work, the application of RFID technology to intelligent traffic service systems with purpose to improve the data quality is used for real-time traffic information gathering. It’s framework in which moving vehicles with attached passive RFID tags can located with the RFID reader installed at roadside near the road intersections thus to improve the intelligent traffic systems (ITS) traffic real-time road status publish service and forecast service [7].
For tracking vehicles using RFID, it was developed with three major problems: traffic signal timing, congestion on road and theft of vehicles. The traffic signaling is made dynamic based on regressions over data archives, containing a detailed set of traffic quotient and time. Analysis of congestion forms a key attribute for traffic signaling system and is used for suggesting faster routes to vehicle drivers and balancing the traffic across various routes. In this system requires installing RFID tags on all vehicles and RFID readers on various functions of city for tracking [8].
RFID technology applications on the ITS is presented an innovative scheme, hierarchical exponential region organization (HERO), to tackle the position of moving vehicles in real-time. The location information of individual vehicle is actively logged in local nodes which are distributed throughout the city. For each vehicle, HERO dynamically maintains an advantageous hierarchy on the overlay network of local nodes to conservatively update the location information only in nearby nodes. By bounding the maximum number of hops the query is routes, HERO guarantee to meet the real-time constraint associated with each vehicle [9].
2. Research Method
From Figure 2, the width of road is 18 meters and divided by six lines, each of width is 3m. RFID readers placed 3m in distance from each corner of the intersection. To calculate the speed of vehicles we must use the distance between the midpoints of the road, that are:
o The distance of turn left : 11.7853 m o Straight distance : 24 m o The distance of turn right : 25.9286 m
By using the assumption the vehicle motion is linear with constant acceleration > 0 and initial velocity (vo) is zero, then speed across the intersection is [10]:
ݒ=ଶ௦
௧ =
ܽݐ (1)
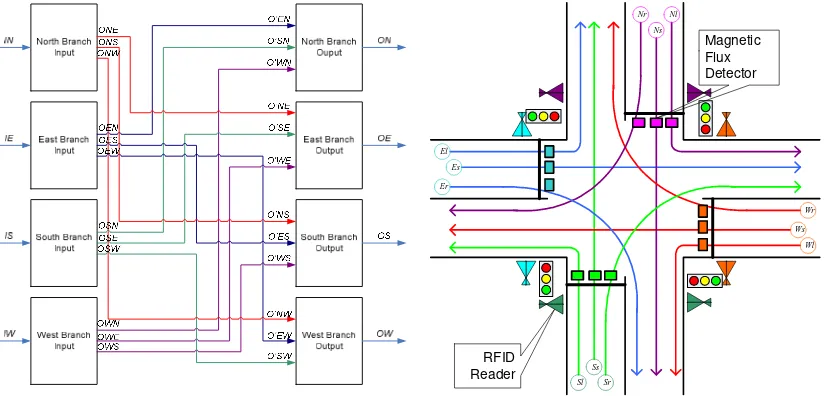
We use active tag RFIDs are tagged on vehicles that are interrogated up to 10m by RFID reader. The magnetic flux detectors are installed on the stop line and that are activated when the traffic light is red lit up.
Wr Ws
Wl Ns
Nr Nl
Er Es El
Sl Ss
Sr
Magnetic Flux Detector
RFID Reader
Figure 1. The model of traffic light violation detection system
Figure 2. The sketch crossing: quarter-intersection
2.1 Tracking Algorithm
To monitor the movement of vehicles equipped with an RFID card, then at each branching junction placed RFID readers as shown in Figure 2. Both vehicles came to the crossing and the left junctions were identified by RFID readers. Thus we will know the intended direction of vehicle after crossing the intersection. The result of detection is expressed with tracking vector [11] as follows:
Tracking vector = <Ti, tj, Rk> (2)
with:
Ti : Identity RFID card tj : Time of identification Rk : Point of RFID Readers
Vehicles will move from one point to point an RFID reader that other RFID readers nearby and it is not possible to skip the nearest point of the RFID reader. This can be seen in Figure 3. A vehicle moves from point (1,1) to (4.1) through the points (2,2), (2.3), (2,4), (1,4), (2.5), (3.5), (4.4), (4,3) and (3.2). A vehicle is detected RFID reader at the point (2.3) is only possible move to the point (1,2), (1.3), (1,4), (2.2), (2,4), (3, 2), (3.3) or (3.4).
Figure 3. The situation placement of RFID readers dots [12]
2.2 Simulation of Model
To achieve the goals of the research then we have created the simulation of model with the following procedures:
1. To created detector lighting status at each branching junction. In this study only used the crossing with 4 branches (quarter intersection).
2. To created identity (ID) a vehicle that came to the crossing at random with probability occurrence of each ID is the same (uniformly random generator) and every generation the maximum is 12 IDs of 2500 ID (0.48%).
3. To created generating random ID vehicle as a candidate red-light violators a maximum of 3 IDs of 12 ID that already exists (0.12%). Three IDs as candidates for traffic light violators were vehicles that are in the queue ahead of each branching point.
4. To create generator ID violators of traffic light violators candidates with the expected value is a maximum of 3%.
5. To created timing for calculation speed of the vehicle if known across the magnetic flux. Vehicles violating the traffic light only if the speed is up to 80 km/hour. Timing is done by sampling every 100ms start the vehicle is detected crossing the flux to be detected by RFID readers at branching destination.
6. To created calculation of the number of vehicles crossing the intersection at each end of the ignition cycle of traffic lights.
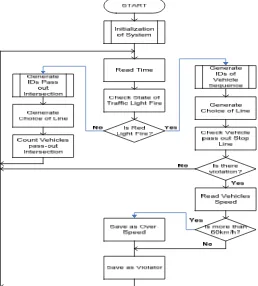
The flowchart of traffic light violation detection algorithm is shown in Figure 4.
The simulation model was constructed using the instruction in accordance with the programming language products from Scilab 5.2.2 and 4.3 of ScicosLab INRIA-ENPC. Function ignition traffic lights is taken from an external file where the cycle period in this simulation is fixed for each day (fixed driven) and is set as Table 1.
Table 1. Cycle setting lighting traffic
Hour Lamp Branching (seconds)
Figure 4. The flow chart of simulation model predictions of traffic light violators
To distinguish ID at each branch, then ID generators are divided as follows: • ID North branch, IN : 0001 - 2499
• ID East branch, IE : 2500 - 4999 • ID South branch, IS : 5000 - 7499 • ID West branch, IW : 7500 - 9999
The maximum number of IDs that allowed each generation is 12 and must not appear on the next generation. This is obtained by taking the first matrix element (1.1) of the generation matrix (12.1), where members of the matrix are the numbers 1 to 12. Each vehicle can choose the path according to the desired goals and lead a queue to cross the intersection, the path L (turn left, XL), S line (straight, Xs), R line (turn right, XR) and occupy queues 1, 2, 3 and so on.
Instructions are as follows: 1. Instruction to generate ID number:
NumberID=[1:12)’; //the Matrix of ID number generator : [1 … 12] NumberID_x=grand(1,’prm’,NumberID); //the Matrix permutation of ID number generator
//of x branching NumberID_x=NumberID_x(1); //taking (1,1) of matrix 2. Instruction to generate ID and channel/line to be choose:
GenID_x = grand(NumberID_x,1,'uin',ID_Low,ID_High_x); //ID of x-branching and GenDest_x = grand(NumberID_x,1,'uin',1,3); //channel selected
3. Instruction for generating ID as a candidate red-light violators, that is if the active magnetic flux sensor is:
CoViolation_x = grand(NumberID_x,1,'uin',ID_Low,ID_High_x);
In the transitional lighting between branching, traffic light will light up simultaneously for 3 seconds.
if (Voult_x_y<>0) then
Speed_x_y=grand(1,'prm',Speed_x_y); // Detection of violator candidate if ((Speed_x_y(1)==Voult_x_y)&(t_x_y>0)) then
…
/ / There are violators who are detected in the branch x to branch y
At the traffic light turns red, then the vehicles in each line that occupy the queue 1 will be monitored, whether detected or not crossing the line stops. If vehicle cross the stop line with the magnetic flux sensor is marked active, then the vehicle will be candidate red-light violators. Vehicles will really be traffic light violator if the vehicle ID detected by RFID readers in other branching direction with a speed between 5 km/h until 80 km/h.
3. Results and Analysis
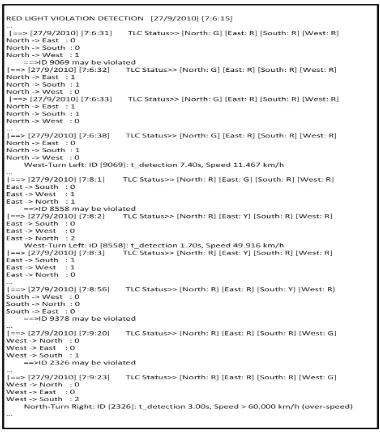
The simulation model according to the algorithm shown in Figure 4 is made with program of Scilab 5.2.2 and ScicosLab 4-3 products from INRIA-ENPC. The examples of program execution results display can be seen in Figure 5 and Figure 6.
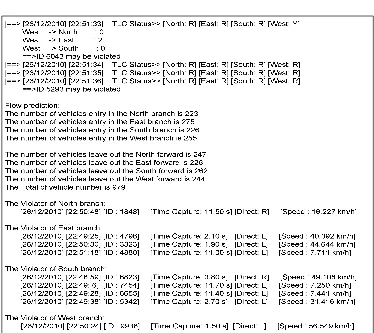
Figure 6. The display of the final of each cycles lighting period
From the simulation results we can be obtained that the generation ID in 1 cycle ignition period traffic lights are different. This is consistent with the arrival of vehicles at the intersection of the entrance area randomly and only allowed once detected. If an ID within 1 cycle period appears more than once, it will be counted once. For example, when simulated on October 27, 2010 at 22:22:9 raised ID vehicle across the intersection as shown in Figure 7.
From Figure 7 can be seen that the ID of vehicles that appear at random is always different and the numbers will always be less than or equal to 12 IDs.
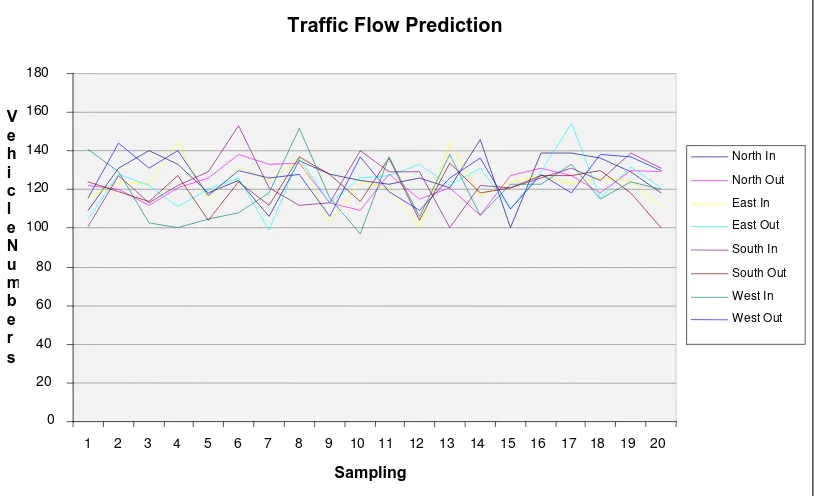
Cumulatively, in 1 cycle ignition (period on October 27, 2010 starting at 00:6:59) obtained numbers of vehicles passing through the crossing is like Figure 8. Vehicles ID is generated uniformly random and a maximum of 12 ID per second (0.48%) at each branching. From 00:00:00 to 03:59:59 hours lighting time is the same in each branch, i.e. 20 seconds of green light, yellow light 2 seconds and the light is red at the same time is 3 seconds. So the maximum number of vehicles that come to a branch when the light is green and yellow is 264. From Figure 8, we can see that the number of vehicles passing through is less than 160 (average 133.88 per vehicle or cycle period of 6.09 vehicles per second (0.24%)) and a second ID that is generated is less than 0, 48%. The average number of vehicles crossing the intersection can be seen in Table 2. From Table 2 can be seen that by using the generator ID type uniform every generation is to have the possibility of 0.24%.
Figure 7. The IDs generate different firing periods in 1 cycle of traffic light
Figure 8. The flows of the vehicle across the intersection
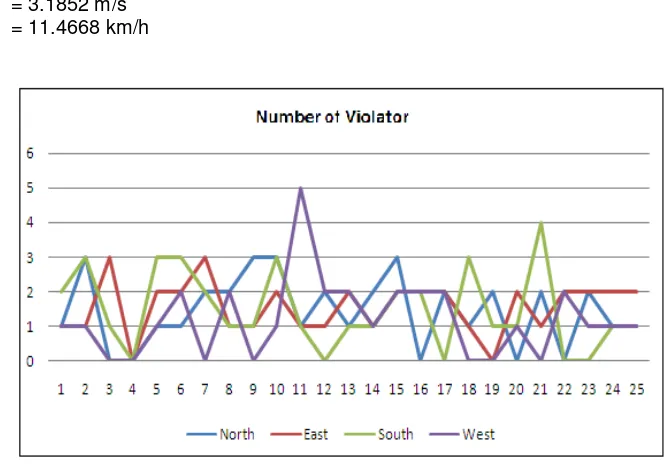
For predicting a traffic light violator vehicle speed is done by detecting ID every 0.1 seconds starting time when the vehicle is detected by a magnetic flux sensor and ends at the time the vehicle ID detected by RFID readers in other branches. Vehicles would otherwise violated if the input speed is up to 80 km/h. Vehicle speed > 60 km/h expressed as a rate of more (over-speed). As shown in Figure 5, that there is a traffic light violations committed by
Traffic Flow Prediction
0 20 40 60 80 100 120 140 160 180
1 2 3 4 5 6 7 8 9 10 11 12 13 14 15 16 17 18 19 20
Sampling V
e h i c l e N u m b e r s
North In
North Out
East In
East Out
South In
South Out
West In
vehicles with ID 9069. The vehicle crossed the intersection of West branching (West) towards North branching (North), which is within 7.4 So from equation (1) obtained the average velocity is:
v = (2* 11.7853)/7.40 = 3.1852 m/s = 11.4668 km/h
Figure 9. The number of traffic light violators
Table 2. The average number of vehicles
Cycle Period Branches:
North East
ID G+Y (s) ID/s ID G+Y (s) ID/s 00:00 - 03:59 133.88 22 6.09 0.24% 132.28 22 6.01 0.24% 04:00 - 05:59 265.80 44 6.04 0.24% 134.32 22 6.11 0.24% 06:00 - 10:59 393.20 65 6.05 0.24% 260.84 44 5.93 0.24% 11:00 - 13:59 203.32 33 6.16 0.25% 268.6 44 6.10 0.24% 14:00 - 19:59 330.44 55 6.01 0.24% 334.24 55 6.08 0.24% 20:00 - 23:59 195.48 33 5.92 0.24% 262.6 44 5.97 0.24%
South West
ID G+Y (s) ID/s ID G+Y (s) ID/s 00:00 - 03:59 134.40 22 6.11 0.24% 131.12 22 5.96 0.24% 04:00 - 05:59 124.88 22 5.68 0.23% 201.08 33 6.09 0.24% 06:00 - 10:59 334.64 55 6.08 0.24% 333.88 55 6.07 0.24% 11:00 - 13:59 263.16 44 5.98 0.24% 266.44 44 6.06 0.24% 14:00 - 19:59 264.96 44 6.02 0.24% 403.28 65 6.20 0.25% 20:00 - 23:59 258.76 44 5.88 0.24% 272.72 44 6.20 0.25%
4. Conclusion
This paper has dealt with prediction of speed vehicle of traffic light violation. The movement of vehicles across the intersection can be detected through the reading of the IDs by RFID readers installed at each branching junction. The number of vehicles crossing the intersection of each ignition cycle period traffic lights has a uniform distribution with an average of 0.24%. The number of violators of traffic light is less than 1% of the number of vehicles crossing the intersection (or an average of 0.09% of total ID that may be) with speed 5 – 80 km/h.
References
[2] Ngo-Quoc K, Zhu K, Guideline For Maintenance Of Traffic Signal Actuation At Signalized
Intersections With Non-Intrusive Technologies. Chapter II ofResearchReport by Traffic Engineering
& Operations Office Florida Department of Transportation dan Department of Electrical and Computer Engineering College of Engineering - Florida State University. October 2003.
[3] Weinstein R. RFID: A Technical Overview and Its Application to the Enterprise. IT Pro. May|Juni 2005: 27-33.
[4] Karygiannis T, Eydt B, Barber G, Bunn L. Guidelines for Securing Radio Frequency Identification
(RFID) Systems. National Institute of Standards and Technology (NIST) Special Publication 800-98.
Section 3: RFID Applications and Application Requirements. April 2008.
[5] Al-Khateeb KAS, Johari JAY, Al-Khateeb WF. Dynamic Traffic Light Sequence Algorithm Using RFID. Journal of Computer Science. 2008; 4(7): 517-524.
[6] Solic P, Rozic N, Marinovic S. RFID-Based Visitors Modeling for Galleries using Markov Model, Proceeding of 2009 10th International Conference on Telecommunications (ConTel 2009).
Zagreb, Croatia. 2009: 105-110.
[7] Zhang Y. RFID-Based Tracking in Supporting Real-Time Urban Traffic Information. IEEE Proceeding of 2009 Fifth International Joint Conference on INC, IMS and IDC. Shanghai. 2009: 657-659.
[8] Pandit AA, Talreja J, Mundra AK, RFID Tracking System for Vehicle (RTSV). IEEE Proceeding of 2009 First International Conference on Computational Intelligence, Communication System and Networks. Mumbai. 2009: 160-165.
[9] Zhu H, Zhu Y. HERO: Online Real-Time Vehicle Tracking. IEEE Transactions on Parallel and
Distributed Systems. 2009; 20(5): 740-752.
[10] Gieck K. Collection of Technical Formulae (Kumpulan Rumus Teknik). Jakarta: PT. Pradnya Paramita. 2000: 142.
[11] Jiang W, Yu D, Ma Y. A Tracking Algorithm in RFID Reader Network. Proceedings of the Japan-China Joint Workshop on Frontier of Computer Science and Technology (FCST'06). Tokyo. 2006: 164-171.
[12] Iswanjono, Budiardjo B, Ramli K, Simulation for RFID-Based Red Light Violation Dectection: Violation
Detection And Flow Prediction. Proceeding of IEEE Conference: Second International Conference
![Figure 3. The situation placement of RFID readers dots [12]](https://thumb-ap.123doks.com/thumbv2/123dok/237743.502374/4.595.222.375.166.255/figure-situation-placement-rfid-readers-dots.webp)