AENSI Journals
Australian Journal of Basic and Applied Sciences
ISSN:1991-8178
Journal home page: www.ajbasweb.com
Corresponding Author: Dewa Ketut Sudarsana, University of Brawijaya, Student at Doctoral Civil Engineering, Faculty
of Engineering, Malang-East Java-Indonesia.
E-mail: [email protected]
The Analysis of Speed-Degree of Saturation Traffic Flow Model on the Road
Reconstruction Project
1Dewa Ketut Sudarsana, 2Harnen Sulistio, 2Achmad Wicaksono and 2Ludfi Djakfar
1Student at Doctoral Civil Engineering Program, University of Brawijaya, Lecturer at University of Udayana, Indonesia 2
Lecturer inCivil Engineering Department, Faculty of Engineering, University of Brawijaya, Malang, East Java, Indonesia
A R T I C L E I N F O A B S T R A C T
During road reconstruction period, a negative impact was imposed on pollution, loss of road user costs, and social costs surrounding environment. In the US, these losses can be mitigated by using loss of road user cost as the scale in the method of Incentive/Disincentive (I/D) in the contract. The application a loss of road user cost as the I/D method of the contract has not been studied in Indonesia. At first stage, this study specifically developed the vehicle speed model during road reconstruction project execution as an important variable for the calculation of the amount loss of road user cost. The arterial road project’s execution of two lane two way, urban and interurban road type, for fiscal year 2013 were used as a case study. The relationship between the vehicle speed and degree of saturation was analyzed with statistical method. The results obtained from the relationship of the speed-degree of saturation of traffic flow is the exponential model. This model can be used to predict vehicle speed on the road during reconstruction project.
© 2014 AENSI Publisher All rights reserved. To Cite This Article: Dewa Ketut Sudarsana, Harnen Sulistio, Achmad Wicaksono and Ludfi Djakfar., Paper title. The Analysis of Speed-Degree Of Saturation Traffic Flow Model On The Road Reconstruction Project. Aust. J. Basic & Appl. Sci., 8(9): 207-212, 2014
INTRODUCTION
Road infrastructure in the life cycle requires maintenance to improve the road services (Level of Service). One of the types of road maintenance is the road reconstruction. Activities of the road reconstruction project generally consist of structural improvement and widening of the road. During the reconstruction period emerge negative impacts, such as economic losses for road users and the surrounding environment (Sudarsana et al, 2014). These effects occur due to the lane use of work zone road reconstruction. One among the strategies to minimize the economic losses, is to apply the method of incentives and disincentives (I/D) in the contract. In the U.S., this method has successfully motivated the contractor to complete the project earlier and avoid delays. As the basis for calculating the I/D is a loss daily road user cost (Sudarsana et al, 2014). The variables that significantly predict losses in the RUC is the vehicle speed during road reconstruction. In Indonesia, the model of vehicle speed during the reconstruction is has not been available yet. Therefore, this study was focused into this issue.
MATERIALS AND METHODS
The study was conducted in Indonesia, located in the Province of East Java and Bali. The data collected in this study were reconstruction National/arteries road projects, for fiscal year 2013. Road type was a lane 2-way urban and interurban roads. The sample of roads were 12 link roads (see Table 1) where 6 link roads (samples 1 to 6) were located in the Province of East Java and other 6 link roads (samples 7 to 12) were located in Bali. Descriptive statistic was used to describe the variables and parameters related to the model. Traffic performance was analyzed using the guidelines of the Indonesian Highway Capacity Manual (1997). Statistical analysis was used to determine the shape of model fit (Bhattacharyya G.K. et al, 1997; Otuzar J.D. et al, 1997; Trihendardi C., 2011)
Data and Analysis:
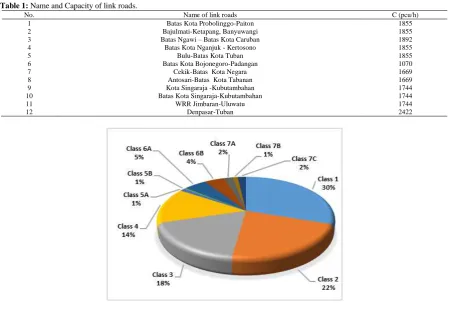
truck). The average proportion of each class of motor vehicles is presented in Figure 1. This proportion is broadly made up about 30 % of motorcycle (class 1), 54 % light vehicle (class 2, 3 and 4); 2 % buses (class 5A and 5B), and 14 % two or more axle trucks (Class 6A, 6B, 7A, 7B and 7C).
Traffic performance variables used for modelling include the mean speed (V), flow (Q), density (D) and degree of saturation (DS). Traffic flow (Q) in the passenger car units per hour (pcu/h) is calculated from the traffic flow of each type of vehicles per hour (veh/h) multiplied by a factor of passenger car equivalent (pce). Density (D) in unit pcu/km is calculated from the ratio of flow Q (pcu/h) with a mean speed V (km/h). Degree of saturation (DS) was calculated from the ratio of traffic flow Q (pcu/h) with the capacity of the road C (pcu/h). Road capacity C can be calculated as follows (DPU, 1997):
C = Co x FCw x FCsp x FCsf x FCcs (1)
Where:
C= actual capacity (pcu / h)
Co= capacity of the base (ideal conditions) (pcu/h), FCw= adjustment factor for road width
FCsp= adjustment factor for directional splits
FCSF = adjustment factor for side friction and road shoulders FCCS= city size adjustment factor
The results of the analysis of the amount of capacity C (pcu/h) for each link road can be seen in Table 1.
Table 1: Name and Capacity of link roads.
No. Name of link roads C (pcu/h)
1 Batas Kota Probolinggo-Paiton 1855
2 Bajulmati-Ketapang, Banyuwangi 1855
3 Batas Ngawi – Batas Kota Caruban 1892
4 Batas Kota Nganjuk - Kertosono 1855
5 Bulu-Batas Kota Tuban 1855
6 Batas Kota Bojonegoro-Padangan 1070
7 Cekik-Batas Kota Negara 1669
8 Antosari-Batas Kota Tabanan 1669
9 Kota Singaraja -Kubutambahan 1744
10 Batas Kota Singaraja-Kubutambahan 1744
11 WRR Jimbaran-Uluwatu 1744
12 Denpasar-Tuban 2422
Fig. 1: Average percentage (%) of vehicle classes on link roads by day.
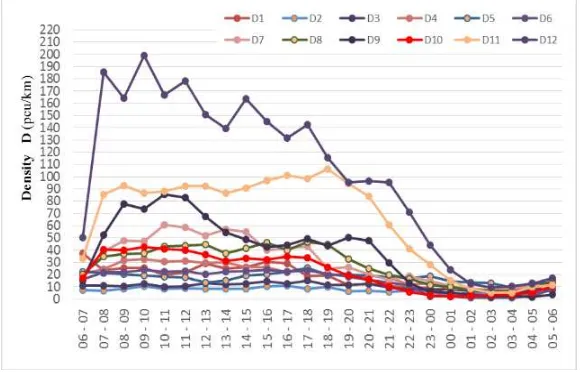
Fluctuations of traffic performance variables V, Q, D and DS per hour daily at 12 link roads are presented in Figure 2, Figure 3, Figure 4 and Figure 5.
The results of a descriptive analysis of variables V, Q, D and DS include the minimum value (min), maximum (max), the mean and standard deviation (std. dev) are presented in Table 2.
Table 1). Models derived from this relationship is controlled by an alignment model with a speed-density (V-D) and the speed-flow (V-Q) relationships.
Normality test results for V-DS, V-D and V-Q relationships indicated that these relationships were normally distributed as shown from the Shapiro-Wilk test scores of probability above 5% (p> 0.05).
Fig. 2: Mean speed V (km/h) fluctuation on the link roads by hour of day.
Fig. 3: Traffic flow Q (pcu/h) fluctuation on the link roads by hour of day.
Fig. 5: Degree of Saturation DS fluctuation on the link roads by hour of day.
Speed- Degree of saturation (V- DS) relationship:
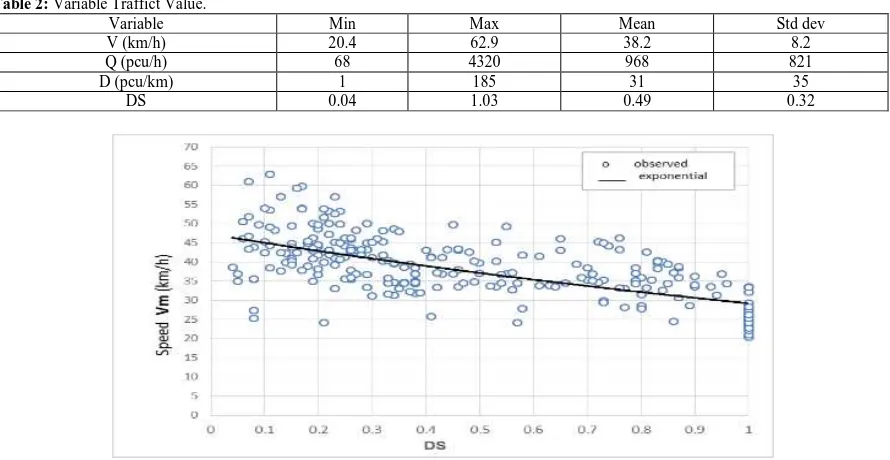
The mean speed (V) and the degree of saturation (DS) relationship is presented in Figure 6. In this model, the response variable is V, while the generator variable is DS. The best model fit for this relationship is exponential model (see Figure 6). This model has a correlation coefficient (r) of 0.680 and the coefficient of determination (R2) is 0.462, which means that 46.2 % of the speed (V) variable can be explained by the degree of saturation (DS). The standard error of estimate is 0.164 which is much smaller than the standard deviation of speed (V) of 8.20. Results of F -test is 228.71 with significance level (0.000), or the probability (p> 0.05). The residual mean square (RMS) is 0.027. Based on the value of the coefficients and the significance obtained, it can be said that this exponential model can be used to predict the speed (V). The mathematical model relationships of the mean speed V in (km /h) with the degree of saturation of the DS can be seen in equation (2).
(2)
Table 2: Variable Traffict Value.
Variable Min Max Mean Std dev
V (km/h) 20.4 62.9 38.2 8.2
Q (pcu/h) 68 4320 968 821
D (pcu/km) 1 185 31 35
DS 0.04 1.03 0.49 0.32
Fig. 6: Speed–Degree of Saturation (V-DS) Relationship.
Speed-Density relationship:
423.42 with significance level (0.000), or the probability (p> 0.05). Residual mean square (RMS) is 0.019. Based on the value and significance of the coefficients obtained, it can be said that this exponential model can be used to predict the speed (V). The mathematical model relationships speed V (km /h) with a density D (pcu/km) can be seen in equation (3).
(3)
Exponential models of the speed - density relationship is obtained, which is in line with the density - speed (U-K) relationship from the Greenberg model (1959) and Underwood model (1961). Both of these models can be seen in equation (4) for Greenberg models and equation (5) for Underwood models (Doh T. et al, 2009).
Um (4)
Uf (5)
The exponential model presented in equation (3) is in line with the Underwood model and this model is more suitable than the other models for the case of a merger of two lane road into one lane (Indrajaya Y. et al, 2003).
Fig. 7: Speed-Density (V-D) Relationship.
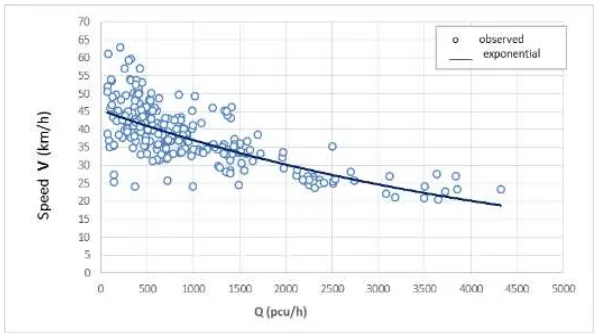
Fig. 8: Speed-Flow (V-Q) Relationship.
Speed - Flow (V - Q) relationship:
used to predict the speed (V). The mathematical model relationships mean speed V (km/h) with a flow Q (pcu/h) can be seen in equation (6). The obtained model, is in line with the speed- degree of saturation (V - DS) model in equation (3).
(6)
Conclusion:
Vehicle speed models that better represent the conditions during reconstruction is the relationship between speed and degree of saturation (V-DS) based on the presence of various road capacities. It was found that the best model fit to explain the relationship of V-DS was exponential model. This model is in line with the model of speed-density (V-D) and the speed-flow models (V-Q).
Modeling vehicle speed is obtained, it is recommended to be used to predict the loss of road users during the reconstruction of roads, particularly vehicle operating cost components that are dependent variable vehicle speed during reconstruction.
ACKNOWLEDGEMENT
Gratitude to the Head and staff "Balai Besar Pelaksanana Jalan Nasional V (BBPJN-V)" East Java Province, and the Head and staff "Balai Pelaksana Jalan Nasional VIII (BPJN-VIII)’’ Bali Province, which has been given permission to study and give permission to use equipment Automatic Traffict Counting (ATC).
REFERENCES
Bhattacharyya, G.K. and R.A. Johnson, 1977. Statistical Concepts and Methods. John Wiley and Sons. DPU (Departemen Pekerjaan Umum), 1997. Manual Kapasitas Jalan Indonesia (MKJI). Direktorat Jendral Bina Marga.
Doh Tcheolwoong, Kim Hyunsang, Kang Kyungwoo and Kook Wookang, 2009. Analysis of Speed-Density Traffict Flow Models on A Merge Influence in An Uninterrupted Facility. Proceedings of the Eastern Asia Society for Transportation Studies, 7.
FEHRL Org, 2008. New Road Construction Concepts: Vision 2040.
http://nr2c.fehrl.org/?m=23&id_directory=429.
Indrajaya Yupiter, Riyanto Bambang dan Widodo Das’at, 2003. Pengaruh Penyempitan Jalan Terhadap Karakteristik lalu Lintas, Studi kasus pada ruas jalan Kota Demak-Kudus, Km.5, Jurnal Pilar Jurusan Teknik Sipil, Fakultas Teknik Universitas Diponogoro, 12(2): 64-72.
Ortuzar Juan de Dios and G. Willemsen Luis, 1997. Modelling Transport. Second edition. John Wiley and Sons.
Sudarsana Dewa Ketut, Sulistio Harnen, Wicaksono Achmad and Djakfar Ludfi, 2014. The Analysis Of Work Zone Road User Costs Due To The Delay Completion Of The Road Maintenance Project. Adv. in Nat. Appl. Sci., 8(3): 103-108