Advances in Natural and Applied Sciences
ISSN:1995-0772 EISSN: 1998-1090Journal home page: www.aensiweb.com/anas/index.html
Corresponding Author: Dewa Ketut Sudarsana, Student at Doctoral Program, Department of Civil Engineering University of Brawijaya, Department of Civil Engineering University of Udayana
E-mail: [email protected]
The Analysis Of Work Zone Road User Costs Due To The Delay Completion Of The
Road Maintenance Project
1
Dewa Ketut Sudarsana, 2Harnen Sulistio, 2Achmad Wicaksono, 2Ludfi Djakfar
1Student at Doctoral Program, Department of Civil Engineering University of Brawijaya, Department of Civil Engineering University of Udayana
2Department of Civil Engineering University of Brawijaya
A R T I C L E I N F O A B S T R A C T negative impact, delay claims, statistical test.
The structural improvement and its extension require work zone at the stage of road maintenance project implementation. This work zone produced a negative impact including the decreased road capacity and travel speed. These involve road user and social costs due to disruption of the environment nearby the project. In the U.S, road user costs calculations were used as a delay claim in a road project completion. This method is known as the incentive/disincentive (I/D) method. An investigation on road user costs due to work zone in Indonesia however, has not yet been conducted. The first stage of this study is to conduct a comparison analysis between the road users costs and delay claims under the contract. A national road improvement project in Bali Province on fiscal year 2012 is used as a case study. Paired statistical t-test and Wilcoxon sign rank test were used for data paired difference test. The study results show that delay claims are applied for one per mil (1/1000) of the contract price. Road users cost due to work zone is an average of (13.7/1000) of the contract price. Statistical test indicated that road user costs are not equal to delay claims stipulated in the contract (t-test p=0.012<0.025 and Wilcoxon sign test p=0.005<0.025).
© 2014 AENSI Publisher All rights reserved. To Cite This Article: Dewa Ketut Sudarsana, Harnen Sulistio, Achmad Wicaksono, Ludfi Djakfar., The Analysis Of Work Zone Road User Costs Due To The Delay Completion Of The Road Maintenance Project. Adv. in Nat. Appl. Sci., 8(3): 103-108, 2014
INTRODUCTION
Both delays and increasing costs are often found in a project implementation. A loss cost during the construction period can be minimized by setting the implementation period. Another strategy is to apply penalties in case of delay claims of a project completion [4].
In the U.S, the daily road user cost (DRUC), due to the work zone is used as the basis for providing incentives and disincentives (I/D). This method is applied for tender and the project implementation period. This method succeeded in motivating the contractor to avoid delays in a project implementation [4].
The value of delay claims of the project completion in Indonesia however, is generally determined by the contract price in which a minimum of 1/1000 per day and a maximum of 5/100 or of bid assurance (Indonesian Government Decree No. 54/2010). Therefore, an investigation on the relationship between the loss of road users costs during the construction period and delay claims in a project implementation has not been conducted.
Data And Method of Analysis:
The case study is on an arterial road reconstruction project in 2012 fiscal year. The study was carried out in Bali Province, Indonesia. This study uses descriptive method involving exposure cases and relevant literature review. The analyzes were conducted to describe the impact of work zone road user cost such as the loss of road user cost (RUC).
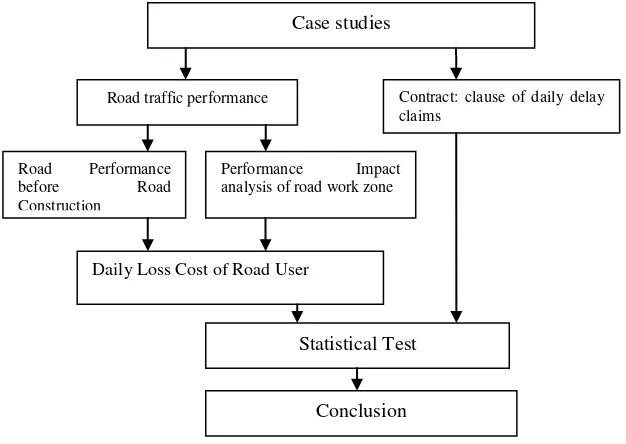
Fig. 1: Analytical framework
Work Zone:
Work zone is required on the implementation of project reconstructions. Work zone is an area of road segment in which one or more lanes of the road closed for the implementation construction. This may reduce the traffic movement and road capacity [5,3].
Road Traffic Performance:
Road traffic performance analysis is conducted before and during road constructions. Traffic performance variables are traffic flow (Q), vehicle speed (V) and travel time (TT). Traffic flow (Q) reflects traffic composition in passenger car unit (pcu). All traffic flow (per and total directions) are converted into passenger car units (pcu) using passenger car equivalent (pce) for which derived empirically following the vehicle types below [1]:
1) Light Vehicle (LV) 2) Motor Cycle (MC)
3) Heavy Vehicle (HV) (including trucks and buses)
4) Medium Heavy Vehicle (MHV) (2 axle truck and a small bus) 5) Large Bus (LB)
6) Large Truck (LT) (3 axle trucks and truck combinations)
The pce value for Light Vehicle (LV) is 1(one) and is required in total vehicles/hour for each type of road. Meanwhile speed is the distance traveled in a unit time, or the rate of change of distance with respect to time. Vehicle speed is also influenced by human factors, vehicle and road infrastructure. In addition, vehicle speed is affected by traffic flow, weather conditions and the surrounding natural environment. Speed can be divided into 5 types including spot speed, time mean speed, space mean speed, travel speed, and running speed.
The Indonesian Highway Capacity Manual 1997 [1] uses travel speed as the primary measure of a road segment performance. Travel speed is the average speed of a light vehicle (LV) segments along the way. Velocity equation is:
V = L / TT (km / h) (1)
wherein:
V = average velocity space of LV (km / h) L = length of segment (km)
TT = average travel time along the LV segments (hours).
The Time Value:
Road user time value was an imaginary service of a road given to road users. This value has not been applied for in Indonesia [11]. In accordance to the guidelines of Bina Marga, Pd. T-18-2005-B, road user time value can be obtained using productivity methods, stated or revealed preferences. Productivity method is to
Case studies
Road traffic performance Contract: clause of daily delay claims
Road Performance
before Road
Construction
Performance Impact analysis of road work zone
Daily Loss Cost of Road User
Statistical Test
determine time value using the average income or gross domestic product (GDP) per capita per year. This value is subsequently converted into a smaller monetary unit value such as rupiah per hour.
Vehicle Operating Costs (VOC):
In theory, vehicle operating costs are influenced by many factors including vehicle condition and types, environment and driving behavior and road conditions. In practice, these estimated costs represent the class and are expressed in time units and vary depending on location. In Indonesia there are several models of VOC estimation which specifically developed for the purposes of road maintenance management systems or feasibility study. PT Jasa Marga, toll road operator manager in Indonesia, is currently using the model developed by Pacific Consultant International (PCI) in 1979. The PCI method can be used to calculate the VOC on arterial road, [10]. In general, VOC considers fuel consumption, lubricant, tyres, vehicles repairment and maintenance, vehicle depreciation, bank interest and insurance.
Incentive/Disincentive (I/D) Method:
Incentive/Disincentive (I/D) methods were intended to motivate contractor reducing project implementation duration. The duration was part of the document within the contract auctioned and was determined by the owner. If contractors could complete its work earlier than the timetable, then the contractor is awarded a bonus/incentive (incentive fee). If the contractor is late to finish beyond the schedule then saddled a penalty (disincentive fee) by the owner. The contract using I/D method tend to accelerate the implementation of the construction time in the majority of road projects [4,5,8].
The daily road user cost (DRUC) is used as a base variable to determine the I/D fee, [4], which is unfulfilled in the case of counterparty obligations, a fine was imposed not less than one-thousandth (1/1000) of the contract amount for each day of delay ".
RESULTS AND DISCUSSIONS
Case Study Area:
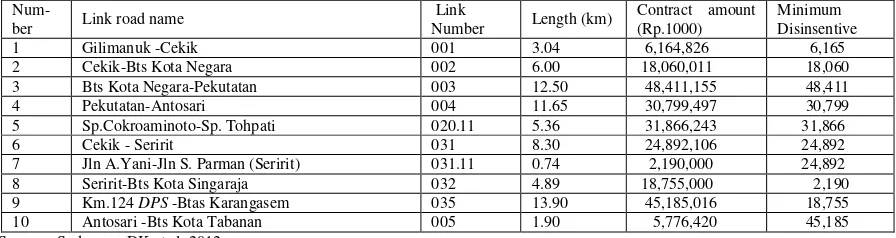
Ten road links was selected for road link project improvement/reconstruction of the national/arterial road of 2012 fiscal year. Table 1 shows the data including number, name, road length of road links, contract amount and minimum delay claims.
Table 1: List of Roads Reconstruction Project
Table 2: Volume of traffic each roads link project (veh/day)
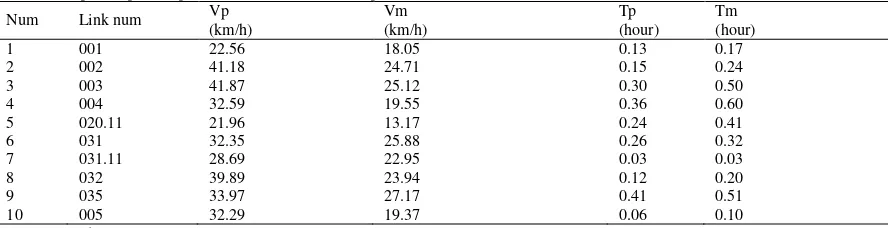
Speed (km/h) and travel time (hours) during the pre-construction (Vp and Tp respectively) and during work zones construction period (Vm and Tm respectively) on each road link are presented in Table 3.
Table 3: Sample of speed (Vp and Vm ) and travel time (Tp and Tm) on each road link
The PCI method to estimate VOC is classified into four vehicle classifications, namely MC, class I, II and IIB. Volumes on each class are presented in Table 4. The vehicle of class I includes vehicle classes of 2, 3 and 4. The class IIA is vehicle types of classes 5a and 5b and the IIB is vehicles classes of 6, 7a, 7b and 7c.
Table 4: Volume of vehicle
Num Link num Volume of vehicle (veh/day)
MC Class I Class IIA Class IIB
Work zone road user costs are in the form of road user cost (RUC). This road user costs consist VOC and time value (TV). The VOC is calculated using the increase of vehicle operating costs due to vehicle speed from pre construction to construction time period. Meanwhile, time value is calculated as a result of the increasing travel time at the time of construction compared to the pre-construction. The results of VOC and time values analyses for each road link reconstructionproject are presented in Table 5.
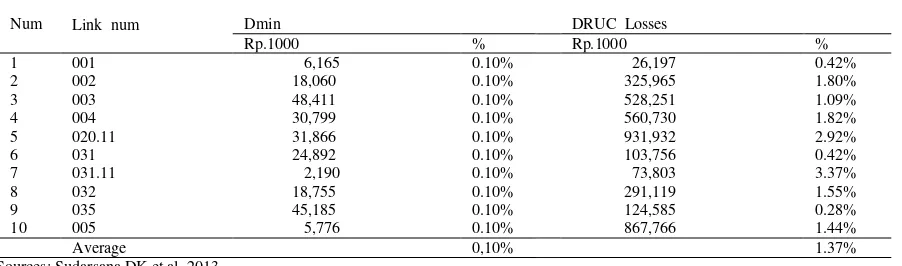
The Comparison between the Minimum Delay Claims (Dmin) with Daily Road User Cost (DRUC):
In the United States, a basis for determining the minimum penalty claims/disincentives (Dmin) delays in daily project completion is a loss of daily road user cost (DRUC). In Indonesia however, delay claims in project completion generally is calculated using the contract price, minimum 1/1000 per day. Dmin and DRUC values and their percentages of the contract prices are presented in Table 6.
on the average of 1.37% (=13.7/1000) of the contract price. The difference between Dmin and DRUC can be seen in Figure 2.
Table 5: Time Value, VOC and Road User Cost
Num Link num Length (km) Time Value Losses
(Rp.1000) VOC Losses (Rp.1000) RUC Losses (Rp.1000)
1 001 3.04 5,670 20,527 26,197
2 002 6.00 59,200 266,764 325,965
3 003 12.50 92,465 435,785 528,251
4 004 11.65 108,553 452,177 560,730
5 020.11 5.36 396,138 535,793 931,932
6 031 8.30 18,804 100,420 103,756
7 031.11 0.74 3,337 11,635 73,803
8 032 4.89 62,168 271,562 291,119
9 035 13.90 19,557 105,816 124,585
10 005 1.90 18,769 83,106 867,766
Sources: Sudarsana DK et al, 2012
Statistical Test:
Statistically, paired t-test and Wilcoxon sign test are used to test the difference between Dmin and DRUC [12].
Fig. 2: The Difference between DRUC and Dmin
Table 6: The Value of Dmin and DRUC and Their Percentages
Num Link num Dmin DRUC Losses
Rp.1000 % Rp.1000 %
1 001 6,165 0.10% 26,197 0.42%
2 002 18,060 0.10% 325,965 1.80%
3 003 48,411 0.10% 528,251 1.09%
4 004 30,799 0.10% 560,730 1.82%
5 020.11 31,866 0.10% 931,932 2.92%
6 031 24,892 0.10% 103,756 0.42%
7 031.11 2,190 0.10% 73,803 3.37%
8 032 18,755 0.10% 291,119 1.55%
9 035 45,185 0.10% 124,585 0.28%
10 005 5,776 0.10% 867,766 1.44%
Average 0,10% 1.37%
Sources: Sudarsana DK et al, 2013
The hypothesis used is Ho: There is no difference between Dmin and DRUC.
Paired t-test produces the t-value count of 3,316 which are greater than t-table (0.975; 9) of 2.841. Therefore Ho is rejected. The probability (p) obtained is of 0.012 which is less than α (0.025). So Ho is rejected.
Wilcoxon sign test produces the z-value count of 2.803 which are greater than the z-table of 1.645. So that Ho is rejected. In addition, the probability (p) obtained of 0.005 which is less than α (0.025). Ho therefore, is rejected.
Based on these results, it can be seen that statistically there were significant differences between Dmin and DRUC. In other words, it can be said that the daily delay claims included in the contract is not comparable to work zone road user costs.
DRUC-Dmin
Conclusions:
A study of delay claims on the project completion of the national road reconstruction projects in Bali Province for 2012 fiscal year found that
1. The daily delay claims under the contract is one per mil (1/1000) of the contract price.
2. Delay claims of one per mil (1/1000) per day in the contract are not comparable to work zone road user costs.
REFERENCES
1. Departemen Pekerjaan Umum (DPU). 1997. Manual Kapasitas Jalan Indonesia (MKJI), Direktorat Jendral Bina Marga, Jakarta.
2. Departemen Pekerjaan Umum (DPU). 2005. Pedoman Perhitungan Biaya Operasi Kendaraan, Nomor: Pd.T-15-2005-B, Puslitbang Prasarana Transportasi, Jakarta.
3. FHWA (Federal Highway Adminitration). 2011, Work Zone Road Use Cost Concepts and Applications, Report FHWA-HOP-12-005.
4. Herbsman, Z.J., W.T. Chen and W.C. Epstein, 1995. Time is Money: Inovative Contracting Methods in Highwaya construction, Journal of Construction Engineering and Management., 121(3): 273-281.
5. Jiang Yi, Chen Huaxin, Li Shuo, 2010. Determination of Contarct Time and Incentive and Disincentive Value of Highway Contruction Project, International Journal of Construction Education and Research, [6],285-302, Routledge Taylor & Francis Group.
6. MTI (Mineta Trasportation Institute). 2010. Improving Trasportation Construction Project Performance: Development of Model to Support the Decision-Making Process for Incentive/Disincentive Construction Projects, MTI Report 09-07.
7. Presidential Decree No.54/2010 (Peraturan Presiden Republik Indonesia Nomor 54 tahun 2010). 2010.
Pengadaan Barang/Jasa Pemerintah.
8. Sillars David N., 2007. Establishing Guidelines for Incentive/Disincentive Contracting at ODOT, Oregon Departement of Trasportation (ODOT) Research Unit.
9. Sudarsana, D.K., N. Swastika, 2012. Analisis Kerugian Biaya Dampak Masa Rekonstruksi Proyek Jalan Arteri di Provinsi Bali, Laporan Hibah Penelitian Ketekniksipilan, Fakultas Teknik, Universitas Udayana. 10. Sudarsana, D.K., N. Swastika, 2013. Kajian Besaran Sangsi Denda Keterlambatan Harian Dalam Kontrak
Proyek Peningkatan Jalan. Laporan Hibah Penelitian Ketekniksipilan, Fakultas Teknik, Universitas Udayana.
11. Tamin, O.Z., 2000. Perencanaan dan Pemodelan Transportasi, Penerbit ITB, Bandung.