C H A PT E R I I
L I T E R A T UR E R E V I E W
2.1 P assive C ontr ol System
T o remove the effect of vibration in a building, passive control system is
used. Passive control system is characterized by the absence of an an external source
of energy in the system. T he dissipation of energy is activated by the structure itself
when vibration motion happens. Passive control system has advantages over active
control system due to the fact that it is usually simple and inexpensive to be
implemented. T here are several mechanisms of passive control system such as
tuned mass damper (T MD ), tuned liquid damper (T L D), bracing, shear wall,
viscoelastic damper, damping system and base isolation system. (A rfiadi.2000).
T he basic equation of motions for structure using passive control system can be
written as:
g d d d
d u c c u k k u e a
m
m ) ( ) ( )
( (2.1)
W here mthe mass of the structure itself,
d
m mass of the passive control system, c the damping of the structure,
d
c the damping of the passive control system, k the stiffness of the structure, and
d
k the stiffness of the passive control system. W hile u the displacement vector,
d
e vector representing the influence of earthquake on passive control system, and
g
a the
2.2 Pr inciple of B ase I solation S ystem
In general, base isolation techniques follow this basic approaches. T he
isolation system introduces a layer of low lateral stiffness between the structure and
the foundation underneath (C hopra et al., 2007). T his isolation layer provides the
structure with a natural period which is much longer than its fixed-base natural
period.
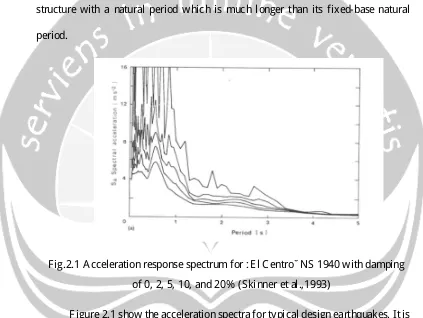
F ig.2.1 A cceleration response spectrum for ‘ E l C entro’ NS 1940 with damping of 0, 2, 5, 10, and 20% (Skinner et al.,1993)
F igure 2.1 show the acceleration spectra for typical design earthquakes. It is
seen that these maximum accelerations are more severe on the first vibrational
period of the structure is in the range of 1.1-0.6 s and the structural damping is low.
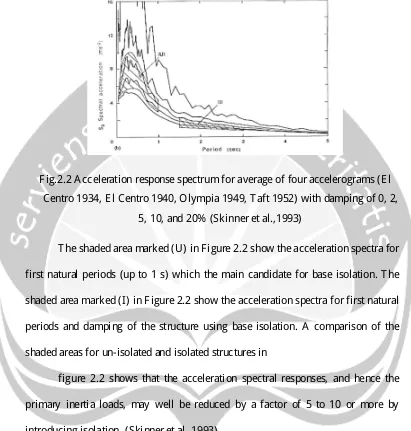
[image:2.612.96.519.215.533.2]F ig.2.2 A cceleration response spectrum for average of four accelerograms (E l C entro 1934, E l C entro 1940, Olympia 1949, T aft 1952) with damping of 0, 2,
5, 10, and 20% (Skinner et al.,1993)
T he shaded area marked (U) in F igure 2.2 show the acceleration spectra for
first natural periods (up to 1 s) which the main candidate for base isolation. T he
shaded area marked (I) in F igure 2.2 show the acceleration spectra for first natural
periods and damping of the structure using base isolation. A comparison of the
shaded areas for un-isolated and isolated structures in
figure 2.2 shows that the acceleration spectral responses, and hence the
primary inertia loads, may well be reduced by a factor of 5 to 10 or more by
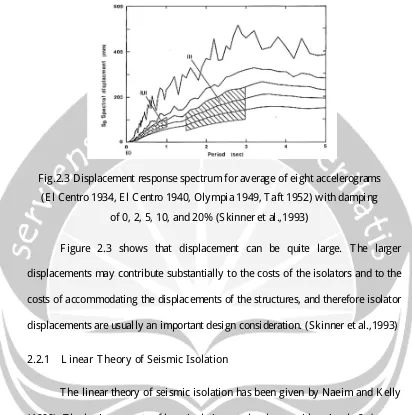
[image:3.612.107.518.118.549.2]F ig.2.3 D isplacement response spectrum for average of eight accelerograms (E l C entro 1934, E l C entro 1940, Olympia 1949, T aft 1952) with damping
of 0, 2, 5, 10, and 20% (Skinner et al.,1993)
F igure 2.3 shows that displacement can be quite large. T he larger
displacements may contribute substantially to the costs of the isolators and to the
costs of accommodating the displacements of the structures, and therefore isolator
displacements are usually an important design consideration. (Skinner et al.,1993)
2.2.1 L inear T heor y of S eismic I solation
T he linear theory of seismic isolation has been given by Naeim and K elly
(1999). T he basic concepts of base isolation can be shown with a simple
[image:4.612.105.517.107.522.2]
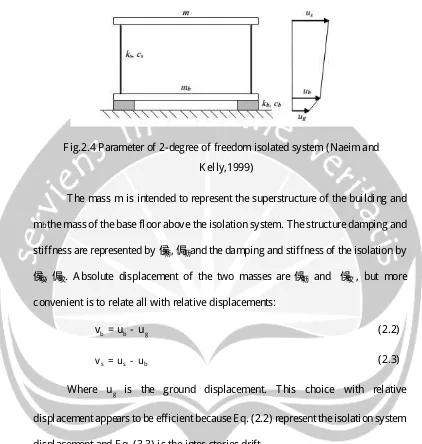
F ig.2.4 Parameter of 2-degree of freedom isolated system (Naeim and K elly,1999)
T he mass m is intended to represent the superstructure of the building and
mb the mass of the base floor above the isolation system. T he structure damping and
stiffness are represented by , and the damping and stiffness of the isolation by
, . A bsolute displacement of the two masses are and , but more
convenient is to relate all with relative displacements:
g b
b u u
v - (2.2)
b s s
u u
v - (2.3)
W here
g
u is the ground displacement. T his choice with relative
displacement appears to be efficient because E q. (2.2) represent the isolation system
displacement and E q. (3.3) is the inter-stories drift.
T he equation of motion can be easily expressed by applying d’A lambert’s
principle:
g b b
b b b s b
b v mv c v k v m m u
m
m ) ( )
( - (2.4)
g b
b b b s
b mv c v k v mu
v
[image:5.612.99.521.102.546.2]If we introduce the total mass
b
m m
M (2.6)
the mass ratio
M m m m m b g (2.7)
the nominal frequencies
M k b b 2
w
m k s s 2w
(2.8)the frequency ratio
) 10 ( 2 2 2 - O s b
w
w
e
(2.9)the damping factor
M c b b b
w
x
m c s s sw
x
(2.10)the basic equations of motion become, in a matrix notation,
g s b s b s b s s b b s b u v v v v v v
w
w
w
w
x
w
x
g
- 1 1 0 0 2 0 0 2 1 1 1 2 2 (2.11)T he characteristic equation of the frequency is
T he solution of which, to first order in ε, are given by ) 1 ( 2 2 1
ge
w
w
-b (1 )
1 2 2 2
ge
g
w
w
- s (2.13)A nd the mode shapes are
e
f
11
- e g g f ) 1 ( 1 1 1 2 (2.14)
T he modal analysis of this system yields with the expressing the participation
factors as
ge
- 1
1
L ge
2
L (2.15)
A nd the damping ratio
-x ge
x
2 3 1
1 b
-
ge
g
gx
x
x
e 2 3 1 1 2 b s (2.16)If Sd(w,x)and Sa(w,x)are the pseudo-displacement and the pseudo-acceleration
spectra, the maximum modal displacement can be calculated and combined using
the SR SS rule to get:
2 ) 2 2 2 2 2 ) 1 1 2 1 max , ( , ( ,x
w
x
w
b bb L S L S
v
(2.16)
2 ) 2 2 2 2 ) 1 1 2 max,
e
(1ge
) b(w
,x
1 2(1g
)e
b(w
,x
s S S
v - - - (2.17)
T he shear coefficient can be defined as:
2 2 2 2 11, ) ( , )
(
w
x
w
x
a a
s S S
T aking into account that, usually, for isolated systems, we have e1and ) , ( ) , ( 1 1 2 2
x
w
x
w
d d SS , consequently,
b
w
w
1 , L1 1and b
x
x
1 : ) , ( max, d b b
s S
v w x (2.19)
) , (
max
, d b b
b S
v e w x
(2.20)
) , ( b b a s S
C
w
x
(2.21)Indicating that for small ε and typical design spectrum, the isolation base can be
designed, at least at initial phase, for relative base displacement of ( , )
b b b
S
w
x
andthe building for base shear coefficient of ( , )
b b a
S
w
x
. T he reduction in base shear ascompared to fixed structure where ( , )
s s a
s S
C
w
x
is given by ( , )b b a
s S
C
w
x
,which constant velocity spectrum is
s b w w
,or roughly order of
e
.2.3 E ffect of B ase I solation System
A s one of the leaders in base isolation use, there are hundreds of building
implementing this technology. One of the examples is 3-chome apartment, in T okyo.
T he building is 12 stories above ground, with total height 37.75m. T he isolator
installed on building are 12 units of L ead R ubber Isolator and 4 units of Natural
R ubber B earing. T he analysis of the structure conducted by analyzing the
acceleration report recorded from several parts of the building during 2011 T he
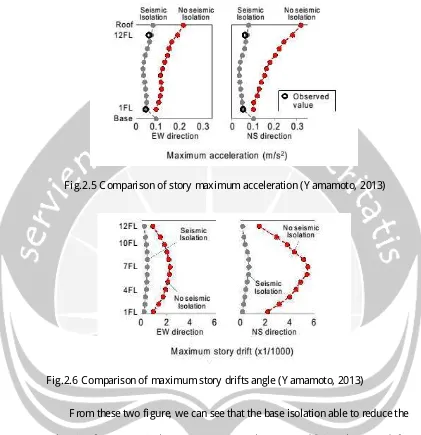
F ig.2.5 C omparison of story maximum acceleration (Y amamoto, 2013)
F ig.2.6 C omparison of maximum story drifts angle (Y amamoto, 2013)
F rom these two figure, we can see that the base isolation able to reduce the
acceleration from 1/2 at its lowest part to 1/4 at the top. In addition, the story drifts
angle of each story able to reduce to 1/5 to 1/10.
A s the use of base isolation is still limited in Indonesia. T here are not many
study case that can be observed. One of the building in Indonesia that implemented
base isolation system is gudang garam tower in J akarta. T he building consists of 22
[image:9.612.97.518.104.539.2]and 2500 years’ return are used for this project, with peak ground acceleration of
0.211g and 0.366g. T he building using the High D amping R ubber (HDR ) from
B ridgestone manufacturer. 16 of the isolator are 1.3m in diameter and 24 of the
isolator are 1.5m in diameter. T he model is analyzed using E T A B S with a linear
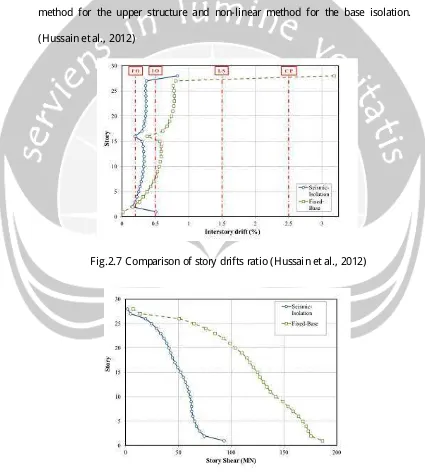
method for the upper structure and non-linear method for the base isolation.
(Hussain et al., 2012)
F ig.2.7 C omparison of story drifts ratio (Hussain et al., 2012)
[image:10.612.94.519.204.677.2]F rom these two figure, we can see that the base isolation able to reduce story
shear and drift by 50%.
Other examples of base isolation use in Indonesia are the analysis of IB IS
hotel in Padang. S imilarly, the analysis is using isolator from B ridgestone
manufacturer and the building analyzed using E T A B S. F rom the analysis, it is
found that the inner force of the structure can be reduced from 60% to 80% and the