Analysis of movement for unmanned underwater vehicle using a low cost integrated
sensor
Mohd Shahrieel Mohd Aras, Shahrum Shah Abdullah, Ahmad Fadzli Nizam Abdul Rahman, Mohd Farriz Basar, Anuar Mohamed Kassim, and Hazriq Izzuan Jaafar
Citation: AIP Conference Proceedings 1660, 070052 (2015); doi: 10.1063/1.4915770 View online: http://dx.doi.org/10.1063/1.4915770
View Table of Contents: http://scitation.aip.org/content/aip/proceeding/aipcp/1660?ver=pdfcov Published by the AIP Publishing
Articles you may be interested in
An overview of unmanned underwater vehicle noise in the low to mid frequencies bands POMA 9, 065007 (2012); 10.1121/1.3492795
Bearings-only target localization for unmanned underwater vehicles J. Acoust. Soc. Am. 130, 2382 (2011); 10.1121/1.3654551
Acoustic noise estimates for a quiet unmanned underwater vehicle. J. Acoust. Soc. Am. 127, 1813 (2010); 10.1121/1.3384169
Unmanned underwater vehicle self‐noise and implications for low‐frequency sonar design. J. Acoust. Soc. Am. 127, 1812 (2010); 10.1121/1.3384122
Analysis of Movement for Unmanned Underwater Vehicle
Using a Low Cost Integrated Sensor
Mohd Shahrieel Mohd Aras
a, Shahrum Shah Abdullah
b, Ahmad Fadzli Nizam
Abdul Rahman
c, Mohd Farriz Basar
d, Anuar Mohamed Kassim
eand Hazriq Izzuan Jaafar
fa,e
Department of Mechatronics, Faculty of Electrical Engineering, Universiti Teknikal Malaysia Melaka, Hang Tuah Jaya, 76100 Durian Tunggal, Melaka Malaysia
b
Department of Electric and Electronics, Malaysia-Japan International Institute of Technology, Universiti Teknologi Malaysia, International Campus Jalan Semarak,
54100 Kuala Lumpur, Malaysia
c
Faculty of Information Technology and Communication Engineering, Universiti Teknikal Malaysia Melaka, Hang Tuah Jaya, 76100 Durian Tunggal, Melaka Malaysia
d
Department of Electric and Electronics, Faculty of Technology Engineering,
Universiti Teknikal Malaysia Melaka, Hang Tuah Jaya, 76100 Durian Tunggal, Melaka Malaysia
f
Department of Control and Automation, Faculty of Electrical Engineering,
Universiti Teknikal Malaysia Melaka, Hang Tuah Jaya, 76100 Durian Tunggal, Melaka Malaysia
Abstract: This paper presents the development of low cost integrated Smart Sensor for Unmanned Underwater Vehicle (UUV) namely as underwater Remotely Operated Vehicle (ROV). In the underwater industries, the most crucial issues are the sensors that are needed for the underwater task. The sensors that are utilized in this area are quite expensive and sensitive. Every sensors used in the underwater vehicle are not in the form of integrated sensors and most of them based on case to case basis. However, nowadays, a lot of industries are involved in the development of the integrated sensor in order to reduce the production cost as well as to increase accuracies, efficiencies and productivities. Therefore, this research proposes an integrated sensor to be applied in the underwater operations. The integrated sensor is designed based on three goal performances which are; the accuracies; the sensitivities and the cost efficiencies. This integrated sensor is the combination of pressure sensor, inertial measurement unit (IMU), digital compass and temperature sensor that are placed in a waterproof casing. This integrated sensor is targeted to be used to control the movement of ROV to maintain its position called station keeping. The purpose of the station keeping is to ensure the ROV to remain stationary at the desired depth by utilizing the pressure sensor. The experimental studies have been carried out in order to see the responses of each sensor.
Keywords:Integrated sensor; pressure sensor; IMU; remotely operated vehicle; NI-DAQ card.
PACS:05.
INTRODUCTION
Unmanned Underwater Vehicles (UUVs) are a combination of the Remotely Operated Underwater Vehicles (ROV), Autonomous Underwater Vehicles (AUV), and Underwater Glider [1][2][3]. These three types of UUVs contribute to the same control problems as mentioned in [4][5][6][7][8]. These vehicles have subsisted for more than 100 years and they have attracted a lot of researchers and industries [9][10]. Unmanned underwater vehicles (UUVs) have become a good platform for the underwater research areas since it can become an autonomous system. These systems are crucial because of the varying operating range and depth posed by underwater areas. Moreover, the rescue operations and risk free to human life are also important factors contributed to this research’s necessity. The applications of UUVs today mostly cover these aspects such as surveillance, inspection, recovery, repair and maintenance, and construction [11].
A Remotely Operated Vehicle (ROV) is a tethered unmanned underwater robot. It is common in the deepwater industries such as offshore hydrocarbon extraction. The ROV is also named as a remotely operated underwater vehicle to distinguish it from remote control vehicles that operate on board or underwater platform. The ROV system is unmanned, highly maneuverable and it is operated by a person on board of a vessel. It is linked to the ship by a tether or known as an umbilical cable, a group of cables that carry electrical power, video and data signals back and forth between the operator and the vehicle. In the underwater industries, the sensors that are utilized for every task are quite costly contributed by high durability, waterproof, long lasting and other factors requirements [12][13]. Due to this limited marine technology application and tools to cope with some
International Conference on Mathematics, Engineering and Industrial Applications 2014 (ICoMEIA 2014) AIP Conf. Proc. 1660, 070052-1–070052-10; doi: 10.1063/1.4915770
© 2015 AIP Publishing LLC 978-0-7354-1304-7/$30.00
070052-1
marine problems along the busiest straits of Malacca, the research about integrating sensors have been carried out. In this project, the focused area will be to control an ROV in a multi-axis motion in order to maintain its desired position. The integrated sensor combination has been developed and it consists of pressure sensor, Inertial Measurement Unit (IMU), digital compass and temperature sensor in a waterproof casing that is purposely used to control the movement of this ROV. The target of multi axis motion is to maintain its stationary and stabilize point or called as “station keeping”.
REMOTELY OPERATED VEHICLE
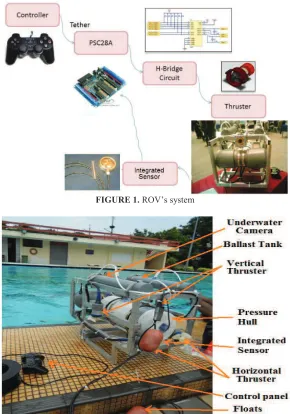
A complete Remotely Operated Vehicle (ROV)system is depicted in FIGURE 1 which gives an overview of functionality ROV while FIGURE 2 shows the final ROV frame with all components in position including the integrated sensor attached on it. The pressure hull in the form of cylindrical PVC pipe with end cap is adopted as the system’s frame since it is the easiest way to fabricate. The pressure hull needs to be sealed and the sealing method used is cable clamp with additional waterproof glues. This ROV system has 2 thrusters for vertical motion while another two thrusters for horizontal motion with 45o angle as shown in FIGURE 2.
FIGURE 1.ROV’s system
INTEGRATED SENSOR
Pressure Sensor
In this research, a pressure sensor is used to know the depth of operating points. The changes in depth (or weight of the water) will influence the pressure of the system as defined in Equation (1):
ο ൌ െݓο݄ (1)
Where:
p is pressure.
w is weight of the fluid. h is the depth
The pressure sensor utilized in this research is Manifold Absolute Pressure (MAP) sensor, a (MAP) MPX5700 series used for engine control. The MAP sensor is designed to sense absolute air pressure within the intake manifold of the engine. However, it also can be used to measure a depth of the underwater as shown in FIGURE 3 as described in [14]. The sensor’s pin used is the only pin number 1, 2, and 3 while the rest is ignored.
FIGURE 3. MPX4250AP CASE 867B-04 with pin configurations.
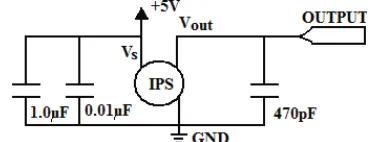
FIGURE 4. Recommended power supply decoupling and output filtering.
FIGURE 5. Complete circuit.
FIGURE 6. Schematic circuit of power supply and pressure sensor.
070052-3
FIGURE 4 elucidates a decoupling circuit to find a typical, minimum, and maximum output curves over a temperature range of 0° to 85°C. The output from the circuit will saturate outside of the specified pressure range. FIGURE 5 shows the complete pressure sensor system. FIGURE 6 shows the Schematic circuit of power supply and pressure sensor.
Inertia Measurement Unit
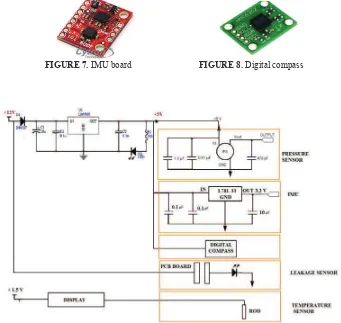
The Inertia Measurement Unit (IMU) is a complete inertial system that incorporates a dual-axis gyroscope and tri-axis accelerometer. The IMU circuitry board is now available with smaller, faster, and cheaper components by Cytron Company as shown in the FIGURE 7. By combining the IDG500 and ADXL335 sensors, the IMU board enables researchers to easily measure roll, pitch, and tilt measurements at their projects [15]. This small IMU size is widely used in the precision instrumentation, platform stabilization and control, industrial vehicle navigation, robotics and etc.
The IMU board uses a standard 0.1" footprint and includes all outputs from both the IDG500 Gyro and ADXL335 accelerometer ICs. The board comes with fully assembled, tested and calibrated. The IDG-500 is an integrated dual-axis angular rate sensor (gyroscope) and exploits InvenSense’s proprietary, patented with MEMS technology [16]. It is vertically driven and the vibrating masses make the system a functionally complete, low cost, dual-axis angular rate sensor.
Digital Compass
Digital Compass is a sensor system integrated with Inertial Measurement Unit (IMU) and interfaced to the Microbox controller as shown in FIGURE 8. The Digital Compass is a fully integrated compass module that combines 2-axis magneto-resistive sensors with complete analogue and digital support circuits, and algorithms for heading computation. FIGURE 9 shows the schematic diagram integrated sensor for ROV.
FIGURE 7. IMU board FIGURE 8. Digital compass
Interfacing Using NI DAQ Card
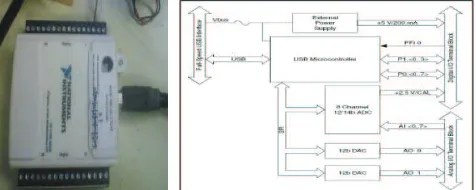
Data acquisition (DAQ) is the process of measuring an electrical or physical phenomenon such as voltage, current, temperature, pressure, or sound with a computer. A DAQ system is a device consists of sensors, DAQ measurement hardware, and a computer with programmable software. Compared to traditional measurement systems, PC-based DAQ systems exploit the processing power, productivity, display, and connectivity capabilities of industry-standard computers providing a more powerful, flexible, and cost-effective measurement solution [17]. The NI USB-6009 provides connection to eight analogue inputs (AI) channels, two analogue outputs (AO) channels, 12 digital input/output (DIO) channels, and a 32-bit counter with a Full-Speed USB interface as shown in Figure 10. All data from NI DAQ can be obtained from LabView software.
RESULTS
The complete integrated sensor is shown in FIGURE 11 and it is the combination of IMU sensor, Depth Sensor and Digital Compass. The length of cable to interface between the sensor and ROV system is about 6 meters. Due to this lengthy cable, there is a delay signal once sensor starts to move or rotate. The sensor casing is made of aluminum material with a transparent surface to make the sensors to be easily seen. An automatic alert can be heard if there is a leakage inside the casing since this integrated sensor is also built with a leakage sensor. The purpose of this leakage sensor is to give a signal to a person on board when there is a leak in the system. Even though, it is hard to leak, the casing still uses the comprehensive sealing technique as shown in FIGURE 12. This type of sealing will block the water from entering the casing of the integrated sensor. Both sides of the casing have a built in O-ring to protect pressure to come into and affect the system.
FIGURE 10. NI-DAQ card and its block diagram.
(a) (b)
FIGURE 11. (a) The actual size of integrated sensor, (b) the sensor with cable.
070052-5
(a) (b)
FIGURE 12. (a) Inside the integrated sensor (b) Clamp cable
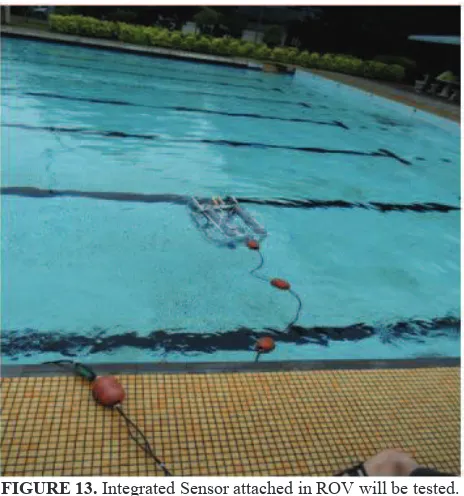
FIGURE 13. Integrated Sensor attached in ROV will be tested.
The complete ROV that is ready to be tested in the pool is shown in FIGURE 13. If pool test success, another test will be conducted like lake test and sea test. In this test, the depth of the pool is set and limits to only 12 feet. The initial results of Integrated Sensor are shown in TABLE 1 to TABLE 4.
TABLE (1). Reading of accelerometer sensor at z-axis.
Axis
Reading of Accelerometer Sensor (m/s2)
Trail 1 Trail 2 Trail 3 Average
X -0.54 -0.46 -0.5 -0.5
Y 0.84 0.8 0.88 0.84
Z -10.5 -10.5 -10.6 -10.53
TABLE (2). Reading of accelerometer sensor at y-axis.
Axis
Reading of Accelerometer Sensor (m/s2)
Trail 1 Trail 2 Trail 3 Average
X -0.04 -0.08 -0.04 -0.05
Y -9.2 -9.24 9.22 -9.22
TABLE (3). Reading of accelerometer sensor at x-axis.
Axis
Reading of Accelerometer Sensor (m/s2)
Trail 1 Trail 2 Trail 3 Average
X -10.1 -10.1 -10.1 -10.1
Y 0.74 0.69 0.73 0.72
Z -0.19 -0.23 -0.15 -0.19
TABLE (4). The reading after adjusting the coding by referring to the offset error.
Axis
Reading of Accelerometer Sensor (m/s2)
X Y Z
X -9.84 m/s2 0.29 m/s2 0.38 m/s2
Y 0.29 m/s2 -9.79 m/s2 -0.97 m/s2
Z -0.28 m/s2 -0.29 m/s2 -9.83 m/s2
From the TABLE 1, the average reading of z-axis is -10.53m/s2. By referring to acceleration of Earth
Gravity, -9.81m/s2, the offset error as below:
-9.81m/s2
– (-10.53m/s2 ) = +0.72m/s2 (2)
Percentages of offset error are as below:
X-axis, [-9.81-(-9.84)] / -9.81 * 100% = -0.31% (3) Y-axis, [-9.81-(-9.79)] / -9.81 * 100% = +0.20% (4) Z-axis, [-9.81-(-9.83)] / -9.81 * 100% = -0.20% (5)
Since the result shows that X, Y and Z-axis error is in the range between - 0.4% to + 0.3%, so this result is acceptable because this error is small and do not affect the actual result. There is no changing for the coding after this adjustment.
(a)
070052-7
(b)
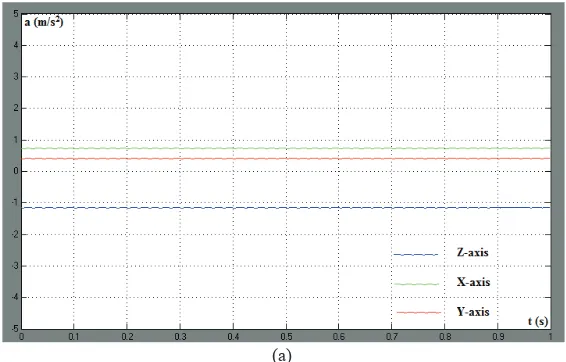
FIGURE 14. (a) Output graph of accelerometer,(b) Output graph of gyroscope
FIGURE 14 (a) shows the graph of this experiment result. The x-axis of the graph is time (second) and y-axis is acceleration (m/s2). The green color line is the z-axis of acceleration, the red color line is y-axis of
acceleration and the blue color line is x-axis of acceleration. From the output graph, green color (z-axis) line was vibrates, following by vibration of the blue color line (y-axis) and the last vibration is the red color line (x-axis). The output graph is matched with the sensor’s box moving sequences. So, the LabView software successfully communicated with the DAQ card via serial communication port.
FIGURE 14 (b) shows the LabView real-time output graph of gyroscope. From the FIGURE 14 (b), the x-axis of the graph represented the time in second and y-x-axis of the graph represented a degree per second of gyroscope’s x, y and z-axis. We can observe that there are 3 maximum points at the positive side and 3 minimum points on the negative side. So, this gyroscope successfully communicated between the DAQ card and LabView software via serial communication port.
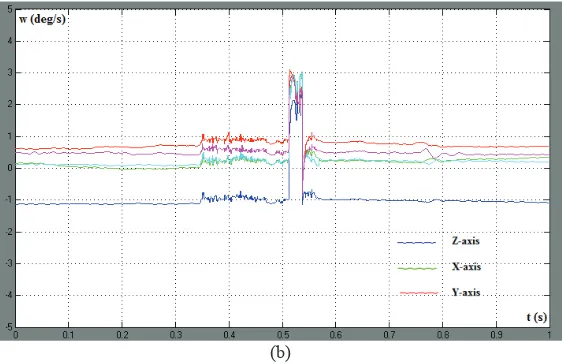
FIGURE 15 (a) and (b) shows the graph of the forward movement of ROV using gyroscope and accelerometer respectively. The theoretical velocity of this ROV is 0.13 m/s. The distance of this movement is 2 meters, and time taken is about 17 second. From these graphs, the z-axis was more stable than x-axis and y-axis. The less vibration shows that the ROV does not too much changing in z-axis, which means the frequency vibration of the ROV at z-axis was less than the vibration at axis and x-axis. The buoyancy force is nearing equal to the ROV gravity force so that the ROV always stable at the surface of water.
The x-axis and y-axis line are more vibrant in the output graph. As observed, the swimming pool has a water flow caused by the filtering water process and it caused the vibration at x-axis and y-axis. The ROV also produced the water flow by its forward motor; this flow was mixed with the flow of filtering and produced larger unwanted flow. The forward movement of ROV also caused the vibration of y-axis. This movement produced by the backward force of the motor. When the backward force, inertial forces of the ROV after it move forward and the resistance of the water mixed, the vibration of the y-axis is stronger as shows in FIGURE 15 (a) and (b). It means when the initial time equal to zero, the y-axis and x-axis graph were more stable if compare after the ROV move after 10 second (inertial of ROV and water resistance occur).
(b)
FIGURE 15. (a) Real-time output graph of gyroscope (b) Real-time output graph of accelerometer.
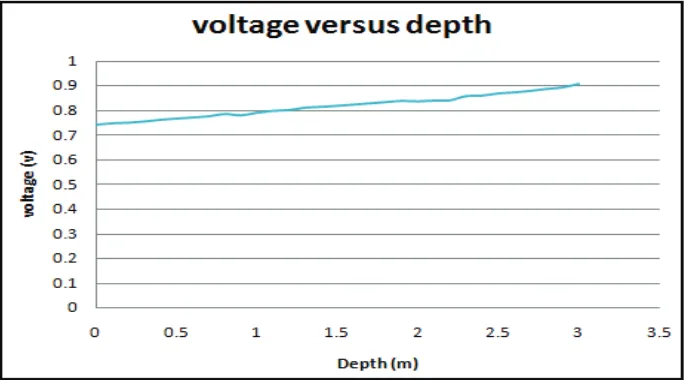
FIGURE 16. Graph of voltage versus depth.
FIGURE 16 shows the voltage (V) from the sensor versus depth (m) of the tested pool. This depth is calculated based on the data sheet of the pressure sensor. From the experimental observation, all the data automatically change from voltage to a depth which means it measures the current depth of integrated sensor and not a depth of seabed.
CONCLUSION
A low cost integrated Smart Sensor for Unmanned Underwater Vehicle (UUV) is successfully developed in this research. The waterproof casing is proven to withstand a depth pressure without any leakage and affects the circuitry inside the casing. Also, the accuracy of Integrated Sensor is acceptable and suitable for implementation in a shallow underwater application because some sensor in integrated sensor can withstand up to 100m only. The batter casing to avoid buckling occurred when increasing with depth. From this research, it is found that the ready-made casing is just enough to hold the pressure for a depth between 20 meters to 30 meters only and for underwater application; the leakage sensor plays an important role to secure entire circuit from damage. The future work elaborated from this research is to design the complete system of Integrated Sensor with LabView software where to display the output in the digital form rather than graphically. The purpose of this future research is to make ROV to make the station keeping operation modes. This research project is hoped to benefit the underwater industries by implementing the sensors with a minimum cost.
070052-9
ACKNOWLEDGMENTS
The authors gratefully acknowledge the continuous support from Universiti Teknikal Malaysia Melaka (UTeM) for UTeM Underwater Technology Research Group (UTeRG) through various grant provided to the research group. Special appreciation and gratitude to honourable University (Universiti Teknikal Malaysia Melaka, UTeM and Universiti Teknologi Malaysia, UTM) especially to the both Faculty of Electrical Engineering for providing the financial as well as moral support to complete this project successfully.
REFERENCES
1. Robert D. Christ and Robert L. Wernli Sr., The ROV Manual: A User Guide for Observation-Class Remotely Operated Vehicles, 1st Ed., Oxford UK: Elsevier Ltd., 2007.
2. M. S. M. Aras, H. A. Kasdirin, M. H. Jamaluddin and M F. Basar, “Design and Development of an Autonomous
Underwater Vehicle (AUV-FKEUTeM)”, in Proceedings of Malaysian Technical Universities Conference on Engineering and Technology (MUCEET2009), 2009, pp 1-5.
3. F. A. Azis, M. S. M. Aras, S. S. Abdullah, Rashid, M. Z. A. and M. N. Othman, Procedia Engineering 41, 554-560 (2012).
4. J. C. Kinsey, R. M. Eustice and L. L. Whitcomb, “Underwater Vehicle Navigation: Recent Advances and New
Challenges,” Proc. IFAC Conf. on Manoeuvring and Control of Marine Craft, Lisbon, Portugal, 2006.
5. Roy Kim Lea, “Control of a Tethered Underwater Flight Vehicle”, Ph.D Thesis, University of Southampton, 1998.
6. Louis Andrew Gonzalez, “Design, Modelling and Control of an Autonomous Underwater Vehicle”, B.Eng. Thesis,
The University of Western Australia, 2004.
7. T. I. Fossen, Guidance and Control of Ocean Vehicles, New York: Wiley, 1994.
8. P. Maurya, E. Desa, A. Pascoal, E. Barros, G. S. Navelkar, R. Madhan, A. A. M. Q. Mascarenhas, S. Prabhudesai, S. Afzulpurkar, A. Gouveia, S. Naroji and L. Sebastiao, “Control of the Maya AUV in the Vertical and Horizontal
Planes: Theory and Practical Results”, in Proceedings MCMC2006 7th IFAC Conference on Maneuvering and Control of Marine Craft, Lisbon, Portugal, 2007.
9. K. R. Goheen and E. R. Jefferys, “The Application of Alternative Modelling Techniques to ROV Dynamics”, in
Proceedings of IEEE International Conference Robotics and Automation2, 1990, pp. 1302-1309.
10. J. V. Morató and S. G. Castro, “Autonomous Underwater Vehicle Control”,in Instrumentation ViewPoint, 2007.
11. Louis Andrew Gonzalez, “Design, Modelling and Control of an Autonomous Underwater Vehicle”, Master Thesis,
The University of Western Australia, 2007.
12. Mohd Shahrieel Mohd Aras, Fadilah binti Abdul Azis,Syed Mohamad Shazali b Syed Abdul Hamid, Fara Ashikin binti Ali, and Shahrum Shah b Abdullah, “Study of the Effect in the Output Membership Function When Tuning a
Fuzzy Logic Controller”, in IEEE International Conference on Control System,Computing and Engineering, 2011, pp.
1-5.
13. M. S. M. Aras, F. A. Azis, M. N. Othman and S. S. Abdullah. “A Low Cost 4 DOF Remotely Operated Underwater
Vehicle Integrated with IMU and Pressure Sensor”, in 4th International Conference on Underwater System Technology: Theory and Applications2012, 2012, pp. 18-23.
14. Mohd Shahrieel Mohd Aras, Shahrum Shah Abdullah, Azhan Ab Rahman, and Muhammad Azhar Abd Aziz, International Journal of Advanced Robotic Systems10, 1 – 12 (2013).
15. Gianluca Antonelli, Underwater Robots: Motion and Force Control of Vehicle-Manipulator Systems, 2nd Ed., Cassino,
Italy: Springer, 2006.
16. A. M. Plotnik and S. M. Rock, "A Multi-sensor Approach to Automatic Tracking of Midwater Targets by an ROV," in
Proceedings of the AIAA, 2007, pp. 1 -5.
17. Aras M. S. M, Abdullah S. S. and Shafei S. S., Majlesi Journal of Electrical Engineering6(2), 1-12 (2012).