PROJECT COMPLETION REPORT
FOR
SHORT TERM RESEARCH GRANT
Study and Design of Multi-blade Wind Energy Conversion
System
Principal Researcher : WAHYONO SAPTO WIDODO
Co-Researchers : 1. HAMBALI BIN AREP @ ARIFF ( FKP) 2. RAHIMAH BINTI ABDUL HAMID (FKP) 3. SAIFUDIN HAFIZ BIN YAHAYA (FKP)
Project Code No. : PJP/2011/FKP (7A)/S00874
Report Submission Date : 30 APRIL 2013
Department of Manufacturing Design
ABSTRACT
This project was performed to study and design a VAWT rotor blade and the gearbox to produces 5 kW of electrical power. This project mainly focuses on Savonius wind turbine. The wind speed distribution was observed and the wind energy site was set at Melaka, Malaysia. The relevant design parameters for designing Savonius rotor blade were studied in this report.
The Savonius rotor was designed with the rotor diameter of 3.5 m and rotor height of 7 m. The rotor blade thickness was designed as 10 mm. SolidWorks was the design software used in this project. The material chosen for the rotor blade was E-glass fiber composite. Pressure difference between the concave and convex blade surface of Savonius rotor induced to drag force that turn the blade. The pressure difference was obtained by implement Computational Fluid Dynamics (CFD) analysis on SolidWorks Flow Simulation. The two flow types in this project were external flow and internal flow analysis. Both analyses were static analysis. Aerodynamic analysis was performed in manually to obtain the resultant drag force on the rotor blade. The resultant drag force obtained was 595.98 N and this value was used in Finite Element Analysis (FEA) to test the structural reliability. The FEA was performed by SolidWorks Simulation and the result was interpreted in three aspects: stress, deformation and Factor of Safety (FoS). The model with blade thickness of 10 mm was found to be able to withstand the load from wind speed of 7 m/s.
ii
TABLE OF CONTENTS
CHAPTER 1 INTRODUCTION TO THE PROJECT ... 1
1.1 Introduction to the Research ... 1
1.2 Background ... 1
1.3 Problem Statement ... 2
1.4 Objective ... 2
1.5 Scope and Key Assumptions ... 2
CHAPTER 2 APPROACH ... 3
2.1. Wind Turbine Design Parameter... 3
2.1.1. Power and Power Coefficient ... 3
2.1.2. Power Performance Curve... 4
2.1.3. Tip Speed Ratio ... 6
2.1.4. Solidity... 6
2.1.5. Aspect Ratio... 7
2.1.6. Overlap Ratio... 7
2.1.7. Reynolds Number ... 7
2.1.8. Diameter of the End Plates ... 8
2.1.9. Number of Blades ... 8
2.1.10. Rotor Blade Material... 9
2.1.11. Required Properties of Blade Materials ... 10
2.1.12. Prospective Material ... 10
2.1.13. Wind Turbine Loads ... 11
2.2. Design of the Savonius Rotor Blade ... 12
2.2.1 Wind Speed Data Analysis ... 12
2.2.2 Wind Speed Parameters ... 15
2.2.3 Detail Design ... 16
2.2.4 Material for Savonius Rotor Blade ... 22
2.3. Design of Gearbox ... 23
2.3.1. Main Shaft ... 23
2.3.2. Intermediate Shaft... 24
2.3.3. Ouput Shaft... 24
2.3.4. GearTrain... 25
2.3.5. 3D Model of Gearbox... 28
CHAPTER 3 ANALYSIS... 30
3.1.1. External Flow Analysis... 30
3.1.2. Internal Flow Analysis... 36
3.1.3. Comparison of External and Internal Flow Analysis ... 44
4.2. Aerodynamic Analysis... 45
4.3. Structural Analysis... 50
3.3.1. Stress... 53
3.3.2. Deformation... 54
3.3.3. Safety Factor... 54
CHAPTER 4 CONCLUSION... 56
4.1. Conclusion ... 56
4.2. Future Work ... 57
REFERENCES ... 58
iv
LIST OF FIGURES
Figure 1 Typical wind turbine power curve... 5
Figure 2 Schematic diagram of a Savonius rotor blade. ... 6
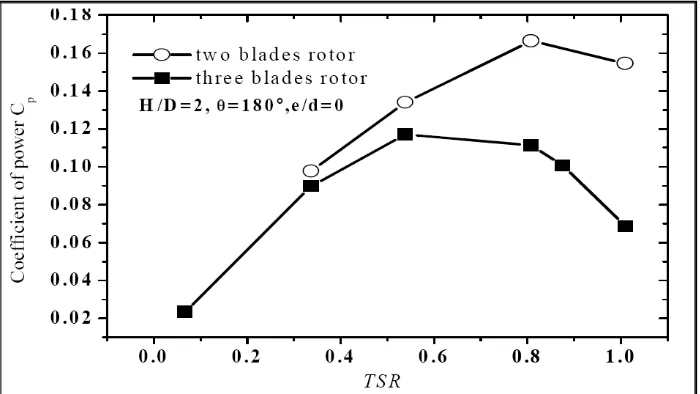
Figure 3 The performance curves of the two and three blades rotor. ... 8
Figure 4 The fluid field of two and three blades rotor (Source: Zhao et al., 2009). .... 9
Figure 5 Wind speed distribution from November 2010 to October 2011 (12 months) at Melaka, Malaysia ... 14
Figure 6 Savonius rotor power curve at average wind speed of 7 m/s. ... 16
Figure 7 Isometric view of Savonius wind turbine. ... 21
Figure.8: Exploded View of Savonius wind turbine... 21
Figure 9 Main Shaft ... 23
Figure 10 Intermediate Shaft... 24
Figure 11 Output Shaft... 24
Figure 12 120 teeth Internal Gear ... 26
Figure 13 3D Model of 18 teeth Spur Gear ... 27
Figure 14 3D Model of Wind Turbine Gearbox with Casing ... 28
Figure 15 3D Model of Wind Turbine Gearbox without Casing... 28
Figure 16 Exploded View of Wind Turbine Gearbox ... 29
Figure 17 Computational Domain for Savonius rotor in external flow analysis. ... 31
Figure 18 Finer mesh is generated around the high-gradient flow region. ... 33
Figure 19 The pressure distribution of external flow analysis... 34
Figure 20 Wind is entered the Computational Domain through a Plane. ... 35
Figure 21 The top view of flow pattern for external flow analysis... 35
Figure 22 The wind is flow out from the Computational Domain before it passes through the whole Savonius model... 36
Figure 23 Model preparation for internal flow analysis. ... 37
Figure 24 Check Geometry to ensure the possibility of internal flow analysis. ... 38
Figure 25 Initial boundary condition for internal flow analysis. ... 40
Figure 26 The mesh tend to be finer around the blade area, the model is observed from the top... 40
Figure 27 The concave surface experience higher pressure than convex surface. .... 41
Figure 28 The pressure distribution in the wind tunnel. ... 42
Figure 30 The flow pattern inside the wind tunnel. ... 43
Figure 31 The flow pattern of wind when it passes the Savonius rotor, observed from top. ... 43
Figure 32 The flow pattern around the Savonius rotor blades... 44
Figure 33 Wind direction that perpendicular to the normal line lead to maximum normal drag force,FN... 46
Figure 34 Wind direction that parallel to the normal line lead to minimum normal drag force,FN. ... 47
Figure 35 The wind is come from different direction... 47
Figure 36 The constraint and load on the Savonius rotor blade in FEA (multi-view). ... 51
Figure 37 The mesh setting and mesh generated on the blade model... 52
Figure 38: Von Mises stress plot for Savonius rotor blade... 53
Figure 39 Static displacement plot for Savonius rotor blade. ... 54
vi
LIST OF TABLE
Table 1 Wind turbine loads (Source: Manwellet al., 2009)... 11
Table 2 Wind speed distribution from November 2010 to October 2011 (12 months) at Melaka, Malaysia (Source: Weather Underground, 2011). ... 13
Table 3 Value of cut-in speed, rated wind speed, and cut-out speed... 15
Table 4 Value of rotor diameter, rotor height and aspect ratio. ... 17
Table 5 Savonius wind turbine dimension list. ... 20
Table 6 Material properties of E-glass fiber (Source: CES Software)... 22
Table 7Torque and Speed on Shaft ... 26
Table 8 Specification of Spur Gear... 26
Table 9 Dimension of Spur Gear ... 27
Table 10 Basic setting of external flow analysis for Savonius rotor blade... 32
Table 11 Basic setting of internal flow analysis for Savonius rotor blade. ... 39
Table 12 Comparison of external and internal flow analysis... 45
Table 13 The forces value on different angle. ... 49
CHAPTER 1
INTRODUCTION
1.1 Introduction to the Research
This project is concern about the design and analysis of wind turbine system applicable to the UTeM Durian Tunggal Campus, Melaka which capable to generate 5 kW electricity.
1.2 Background
As the awareness of people toward global warming issues, pollution issues, and the natural resource depletion issues had increased, people are kept continued finding another more suitable way to solve those problems. One of the solutions for those problems is to use renewable energy instead of keep using fossil fuel that will finish one day. The examples of renewable energy are solar energy, hydropower, and wind energy. Wind energy is one of the useful renewable energy because the wind is free of charge and it exists everywhere on the earth. Everyone can utilize wind to help them to do something they need. For example, sailor use wind for sailing, people use windmill for grinding and water pumping, and the modern wind turbine is used to generate electricity.
In Malaysia, wind turbine is seldom used to generate electricity power in commercialize way. This is because wind speed in peninsular Malaysia is low. The low wind speed is due to the reason where the wind is blocked by both Titiwangsa Mountains and Sumatra Mountains. Besides that, other issues such as the high installation cost and the wind farm location also are the causes that inhibit the use of wind turbine in Malaysia.
2
1.3 Problem Statement
Since, the wind speed in Malacca is low and it is not suitable to set up large scale wind turbine. In this project, the wind turbine blade is designed for the use of small scale wind turbine which capable to generate 5 kW power.
1.4 Objective
The objectives of the research are as follows:
To study the existing design and the design parameters of VAWT rotor blade.
To design VAWT rotor blade in order to generate 5 kW power.
To design a gearbox for the VAWT.
To analyze the structural of VAWT.
1.5 Scope and Key Assumptions
CHAPTER 2
APPROACH
2.1. Wind Turbine Design Parameter
2.1.1. Power and Power Coefficient
Wind power, Pw is defined as the multiplication of mass flow rate, ρAV and the
kinetic energy per unit mass, ½V2(Musgrove, 2010). The wind power is denoted by the equation of
= 1
2
From the wind power equation, wind power is also proportional to the cube of the wind velocity,V3. This mean that the power output will increase by factor of eight if the wind speed increased by a factor of two. Theρin wind power equation represent the air density which is 1.225 kg/m3 for standard condition (Manwell et al., 2009). Besides that, theArepresent the swept area of wind turbine. Swept area is depended on the type of wind turbine. Hayashi et al. (2004) found that the swept area for Savonius Wind Turbine is calculated by multiplication of rotor diameter,D and the rotor height,H. The larger the swept area, the larger the power generated.
= .
The wind power in the above equation represents the ideal power of wind turbine, as in case of no aerodynamic or other losses during the energy conversion processes. However, as state by Manwellet al. (2009), there is not possible for all energy being converted into useful energy. The ideal efficiency of a wind turbine is known as Betz limit. According to the Betz limit, as supported by Musgrove (2011) there is at most only 59.3 % of the wind power can be converted into useful power. Some of the energy may lose in gearbox, bearings, generator, transmission and others (Jain, 2011). However, most wind turbine failed to achieve the 59.3 % of efficiency and thus it is normally referred to as power coefficient, Cp. A power coefficient is defined as the
ratio of power output to power available in the wind (Johnson, 2004). The maximum power coefficient, Cp for Savonius rotor is 0.30. Hence, the Cp value used in this
4
= 0.5
= 0.30
Thus the power output,Pwith considering the power efficiency is
= 1
2
.
2.1.2. Power Performance Curve
Power performance curve define the relationship between wind speed and power output. Manwell et al. (2009) realize that each type of wind turbine has their own characteristic for power performance curve and is varied with wind speed. The function of power curve is to predict the energy production of a wind turbine. Jain (2011) explains that the theoretical power performance curves are derived from field testing.
Both Manwell et al. (2009) and Jain (2011) agree that the three wind speed parameters related to the power performance are as follow:
Cut-in speed.
Cut-in speed is the minimum wind speed for the wind turbine to start produce power. Cut-in speed is counted as 50 % of the average wind speed. Most wind turbines begin to produce power at wind speeds in the range of 3 to 5 m/s. The lower the wind speeds, the lower the power can be produce. An important point stated by Jain (2011) is the torque produce at low wind speed is too small to overcome the inertia of the turbine system and thus failed to generate power.
Rated wind sp
nd speed at which the rated power is reached. G power as the maximum power output of the electr
r defines the shape of the power curve. The wind when it is 50 % more than the average wind spe speed is in the range of 11.5 to 15 m/s (Jain, 2011) ore energy at wind speeds between cut-in and ved with low rated wind speed will produce more
= 1.5
eed.
ed indicates the maximum wind speed at whi deliver power. Most turbine stop produce powe nd turbines are usually stop operating for the rea
onstraints (Jain, 2011).
= 3
1 Typical wind turbine power curve (Source: Tong, 20
d. Gipe (2004) defines power at wind speed of reason of engineering
6
2.1.3. Tip Speed Ratio
Tip speed ratio,λis defined as the ratio of the linear speed of rotor blade,ω.Rto the undisturbed wind speed,V(Solanki, 2009).ωis the angular velocity andRrepresent the radius revolving part of the turbine. The maximum tip speed ratio that Savonius rotor can reach is 1.0. Manwellet al. (2009) write that high tip speed ratio improves the performance of wind turbine and this could be obtained by increasing the rotational rate of the rotor. However, this induces to great aerodynamic noise and lead to structural problem (Strong, 2008).
= .
2.1.4. Solidity
According to Manwellet al. (2009), solidity is related to tip speed ratio. A high tip speed ratio will result in a low solidity. Musgrove (2010) defines solidity as the ratio of blade area to the turbine rotor swept area. For VAWT, the solidity is defined as
=
Where n is the number of blades, d is the chord length or can be defined as the diameter of each half cylinder, andR is radius of wind turbine, as shown in Figure2. Solanki (2009) founds that the value of solidity will affect the starting torque. The higher the solidity, the higher is the starting torque.
2.1.5. Aspect Ratio
Aspect ratio is a crucial criterion to evaluate the aerodynamic performance of Savonius rotor. Menet (2004) defines aspect ratio, ARas the ratio of rotor height, H to the rotor diameter,D. Iqbal and Alam (2010) found that the turbine efficiency can be improved by design a rotor blade that has higher aspect ratio. Saha et al. (2008) agree on this and write that the value of aspect ratio around 4.0 lead to the best power coefficient for Savonius rotor. However, most of the wind turbine is failed to achieve AR of 4.0. Therefore, Johnson (1998) suggests the Savonius rotor is designed with rotor height twice of rotor diameter and this lead to better stability with proper efficiency.
=
2.1.6. Overlap Ratio
The overlap ratio represents the overlap distance relative to its chord length. Menet and Bourabaa (2004) declare that overlap ratio will influence the flow structure inside the rotor and consequently its aerodynamic performance. Akwaet al. (2011) writes that the smaller the overlap between the rotor blades, the higher the rotor performance. A study shows that the values of overlap ratio in range of 20 % and 30 % of the length chord provide better efficiency for wind turbine (Manet, 2004). Blackwell and Feltz (1977) state that the overlap ratio of 0.10 to 0.15 gives optimum performance.
=
2.1.7. Reynolds Number
Kamojiet al. (2008) have mentioned that Reynolds number,Refor Savonius rotor is mainly based on the rotor diameter.
=
8
and Ghajar (2011) state that the absolute viscosity of air at standard condition (T= 20˚C, P= 1 atm) is 1.825 x 10⁻⁵kg/m.s, as shown inAppendix . They also write that the flow is considered as laminar if the Reynolds number is below 2 x 10⁵ and start becomes turbulent for Reynolds number greater than or equal to 2 x 10⁵.
2.1.8. Diameter of the End Plates
Diameter of the end plates,Dfalso play an important role to the turbine performance.
As stated by Manet (2004), Fujisawa has conducted some experimentally studies and concludes that the higher value of power coefficient can be obtained by designing the diameter of rotor end plates,Df10% more than the diameter of the rotor,D.
= 1.10
2.1.9. Number of Blades
Zhaoet al. (2009) have studied the effect of number of blades on the performance of Savonius rotor. Many researchers have proved that the higher the number of blades, the higher the performance for most wind turbine. However, Saha et al. (2008) and Zhaoet al. (2009) found that the two-bladed Savonius rotor has higher performance than three-bladed Savonius rotor.
From experiments that done by Zhaoet al. (2009), the power coefficient of Savonius rotor decreases when the number of blades gets increased from two to three. Figure3 show the experimental result obtained by Zhaoet al.(2009).
From Figure3, it is obvious that the coefficient of power, Cp for two blades rotor is
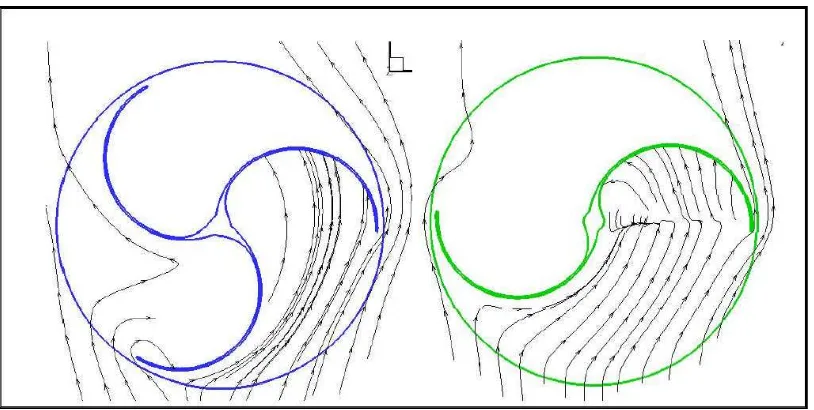
much higher than three blades rotor in the tip speed ratio of 0.8. Zhao et al. (2009) make their result more clearly by conduct the simulation. The simulation results for both two blades and three blades Savonius rotor are shown in Figure 4. From the figure, it is obviously the downwind pressure surface is bigger for the two blades rotor than the three blades rotor. Meanwhile, the upwind pressure surface gets bigger in three blades rotor because of the following blade existing. Zhaoet al. (2009) state that to obtain better rotor performance, the rotor should be designed in big downwind surface and the smaller upwind surface. Therefore, two blades Savonius rotor is better than three blades rotor.
Figure 4 The fluid field of two and three blades rotor (Source: Zhao et al., 2009).
The results of Zhao et al. (2009) is supported by Saha et al. (2008) that doing the similar experiment before. Saha et al. (2008) explain their founding using the phenomenon of air flow: when the number of blades was increased to three, the air strike on one blade get reflected back on the following blade so that the following blade rotates in negative direction as compared to the succeeding blade.
2.1.10.Rotor Blade Material
10
2.1.11. Required Properties of Blade Materials
Tangler (2009) and Burton et al. (2011) found that the blades must be made from high strength-to-weight ratio and stiffness materials to maintain optimum aerodynamic performance. Other properties are further added by Islam et al. (n.d.) such as the following:
Low cost.
Corrosion resistant.
Easy to manufacture.
Lightweight to minimize loads effect to blade fatigue.
Provide long term mechanical performance per unit cost.
Low density for reduced amount of gravity and normal force component.
2.1.12. Prospective Material
Many materials have ever been used to manufacture the wind turbine blades, as list out by Tangler (2000) included wood, steel, aluminium, fiberglass, and carbon fibers.
Islamet al. (n.d.) reveal that in 1977, woods are used as the major material for wind turbine blade because it is a cheap material. Furthermore, since wood is a nature composite material, it has high strength-to-weight ratio and good stiffness. However, the use of woods in this area is hindered because it’s unstable characteristic when deals with moisture.
Manwell et al. (2009) propose using aluminium for VAWT blades since VAWT have a constant chord with no twist. However, Tangler (2000) argues that composite such as fiberglass should be used instead of aluminium because aluminium has low fatigue life relative to composite.
Carbon fiber is a competitive material to fiberglass because it posses highest strength-to-weight ratio and stiffness than fiberglass. However, Tangler (2000) founds that the cost of carbon fiber is very high compares to other blade materials. Its difficulty in handling also inhibits its use for wind turbine blades.
2.1.13.Wind Turbine Loads
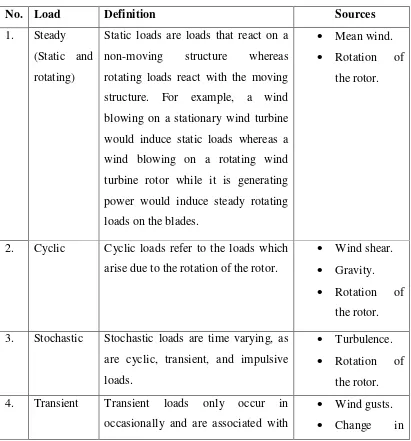
Manwell et al. (2009) define loads as the forces or moments that may act upon the turbine. The loads are the primary elements concerning in wind turbine blades design. According to Manwell et al. (2009), there are five types of wind turbine loads as shown in Table1.
Table 1 Wind turbine loads (Source: Manwellet al., 2009).
No. Load Definition Sources
1. Steady (Static and rotating)
Static loads are loads that react on a non-moving structure whereas rotating loads react with the moving structure. For example, a wind blowing on a stationary wind turbine would induce static loads whereas a wind blowing on a rotating wind turbine rotor while it is generating power would induce steady rotating loads on the blades.
Mean wind.
Rotation of the rotor.
2. Cyclic Cyclic loads refer to the loads which arise due to the rotation of the rotor.
Wind shear.
Gravity.
Rotation of the rotor. 3. Stochastic Stochastic loads are time varying, as
are cyclic, transient, and impulsive loads.
Turbulence.
Rotation of the rotor. 4. Transient Transient loads only occur in
occasionally and are associated with
Wind gusts.
12
starting and stopping. wind direction
Starting / stopping.
Pitch motion.
Teetering.
5. Resonance-induced
Resonance-induced loads are cyclic loads that result from the dynamic response of some part of the wind turbine being excited at one of its natural frequencies. Resonance-induced loads should be avoided. However, it may occur under unusual operating circumstances or due to poor design.
Structure.
Excitation.
Turbulence.
Rotation of the rotor.
2.2.Design of the Savonius Rotor Blade
2.2.1 Wind Speed Data Analysis
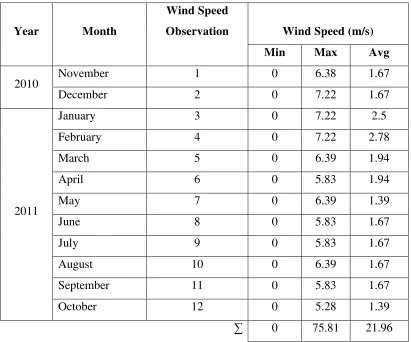
Table 2 Wind speed distribution from November 2010 to October 2011 (12 months) at Melaka, Malaysia (Source: Weather Underground, 2011).
Year Month
Wind Speed
Observation Wind Speed (m/s)
Min Max Avg
2010 November 1 0 6.38 1.67
December 2 0 7.22 1.67
2011
January 3 0 7.22 2.5
February 4 0 7.22 2.78
March 5 0 6.39 1.94
April 6 0 5.83 1.94
May 7 0 6.39 1.39
June 8 0 5.83 1.67
July 9 0 5.83 1.67
August 10 0 6.39 1.67
September 11 0 5.83 1.67
October 12 0 5.28 1.39
∑ 0 75.81 21.96
14
Figure 5 Wind speed distribution from November 2010 to October 2011 (12 months) at Melaka, Malaysia
According to Manwell et al. (2009), the average wind speed Vavg, over the total
period of a year data collection is:
V = 1 Vi
= 1
12(21.96)
= 1.83 /
Where,
Vavg = Average wind speed of a year Vi, = Average wind speed of a month
N = Number of wind speed observation
Based on the result above, the average wind speed of a year is 1.83 m/s. According to Vanek and Albright (2008), the minimum wind speed required for wind turbine to operate is 4 m/s. Hence, the average wind speed of Melaka is too small to generate wind power. Otherwise, the wind turbine must be build with very high tower.
However, Aziz, (2011) found that the wind speed of Malaysia could reach up to 15 m/s during the monsoon season. To proceed for the design stage, the wind speed of 7 m/s is used as average wind speed in this project.
2.2.2 Wind Speed Parameters
The three wind speed parameters involve in this project is cut-in speed, rated wind speed and cut-out speed. All these parameters are depended on the value of average wind speed. The average wind speed,Vavgis 7 m/s. Table3 summarizes the value of
these three wind speed parameters.
Table 3 Value of cut-in speed, rated wind speed, and cut-out speed.
Wind Speed Parameter Equation Calculation
Cut-in speed, = 0.5 = 0.5 (7 / )
= 3.5 /
Rated wind speed, = 1.5 = 1.5 (7 / )
= 10.5 /
Cut-out speed, = 3 = 3 (7 / )
= 21 /
16
Figure 6 Savonius rotor power curve at average wind speed of 7 m/s.
2.2.3 Detail Design
To determine the diameter and height of the Savonius rotor blade, the swept area,A is first determined from the equation of output power. In this project, the power coefficient Cp value used is 0.30, which is the maximum power coefficient for
Savonius wind turbine. The air density is 1.225 kg/m3for standard condition and the rated wind speed is 10.5 m/s.
= 1
2
5000 =1
2(0.30)(1.225 / ) (10.5 / )
= 23.5058
The swept area for Savonius wind turbine is multiplication of rotor diameter,D and the rotor height,H. Both rotor diameter and rotor height is unknown in this equation.
Trial and error method is used to define the rotor diameter and rotor height and the value is rounded up. The value of rotor diameter and rotor height is verified by Aspect Ratio. This means that the value of rotor diameter and rotor height only valid if the Aspect Ratio,ARis acceptable.
= .
Seven groups of data is created and calculated for the aspect ratio to see the possibility for used. Table4 summarizes the aspect ratio for each combination of data.
Table 4 Value of rotor diameter, rotor height and aspect ratio.
Trial and