iDECON 2012 – International Conference on Design and Concurrent Engineering Universiti Teknikal Malaysia Melaka (UTeM)
15-16 October 2012
CAR ACCIDENTS ANALYSIS THROUGH VIRTUAL WINDOW INTERFACE
NurulHuda A., S.R. Kamat and M.P and Mohamad M.
Faculty of Manufacturing Engineering,
Universiti Teknikal Malaysia Melaka, Durian Tunggal, 76100 Melaka, Malaysia Phone: +606-3316447, Fax: +606-3316411, Email: [email protected]
Abstract – Recently, the case of road accident has being a sadly and horrible phenomena which it was seriously concerning everyone. The road accident always occurred especially during the festival season where it terribly changes the mood of happiness into sadness and misery in this country. The statistic data recorded the driver faults/behaviors factor as the highest contributors for accident causation. Nowadays, many accident analyses have been conducted to investigate this global problems and one of the famous methods is using the simulation. This study highlight it strength and unique through the stresses of the accident influential factor which are speed and distance. Also, and analyzed the model of car-to-car accident configuration via simulation. Significantly, speed and distance is influenced to the accident which is the increased of speed and distance causes an incremental for EES value that related to injury severity. The speed also influence to the total impact that faced to car who involved in the crashed. The longest distance offered higher risks of having the severe or fatal injuries when accidents. Also, the road type/design also influenced the accident because straight road with minimum complexity of driving caused drivers more careless, negligent, easy to tail gating and speed etc. Instead, the bend road which giving a more level of complexity for road type/design has been identified to increase the driver alertness and awareness. However, when this road type used for over speeding driving, the accident caused very dramatic effect to the victims and also caused death
Keywords – road accident, virtual crash, accident analysis, injury severity, energy equivalent speed (EES).
I. INTRODUCTION
Statistically, vehicle accidents have caused the trauma, injuries and death for Malaysian. Every year, government has making large of investment in order reduce the accidents especially during the festival seasons and also increase the awareness of road’s users. Moreover, many investments had been made to repair and upgrade the road system, enhancing better car technology and improve safety design. Besides, lots of researches have been done recently about the vehicles accident around the world. Unfortunately, the accident still occurred and it is sometime worst compared to previous cases where this efforts still
futile, stalemate and deadlock. Therefore, this study addressed the analysis of vehicle accident which is recently increases in Malaysia with modeling by simulation. The presented work described the two model of road type/design based on real statistical data provided Royal Malaysia Police and the implementation of the model in the simulation software Virtual Crash. Moreover, for each road type/design simulations runs were performed, each run the speed and distance of the car were varied. For the described purpose the Virtual Crash simulation software tool is the proper choice, as it was designed for road safety issues and provides a large database of different vehicles, so it was possible to focus on the road type/design in first place
A.Virtual Crash
Virtual Crash is the simulation software which was developed especially for road safety purposes in developing the simulation of vehicle accidents. According to Roca A. (2011), the main advantages of this software are its different calculation models which allow increasingly complex real-time calculations to be performed on a personal computer. It is possible to start with a simple model and change it into a more complex one in further steps without losing the prior definitions. Furthermore, all results are viewed and outputted in scale plan and 2D/3D perspective view directly after the termination of calculation. With Virtual Crash it is possible to solve most of the problems of road safety and accident reconstruction efficiently. For this study, the Virtual Crash version 2.2 is used.
II.VIRTUAL PLATFORM
such 60km/h, 70km/h, 80km/h, and 90km/h. While another model (define as Car 2 and Car 3) were driven for 60km/h and 50km/h. Technically, distance limit is another indicator that purposely used to investigate the influence of indicators to the road accident and leaded to the level of injury severity. Two distance limits selected for this study which were 15m and 20 m. Also, the investigation to the influences of speed and distance indicator leads to study of the level of injury severity. The injury severity was analyzed from the energy equivalent speed (EES), pre-impact and post-pre-impact.
III. ANALYSIS OF ACCIDENT MODELS
Based on the simulation, the first model used the straight road as the platform and involved the cars which are significantly named as Car 1 (driver who caused the accident for dangerous overtaking), Car 2 (driver who came from the opposite direction) and the Car 3 (driver who drive slowed and want to overtake by Car 1). The second model developed on bend road as the platform and involved two cars which significantly named as Car 1 (driver who started the accident) and Car 2 (the driver from the opposite direction). The accidents analysis involves total impact that obtained from the difference of pre-impact and post-impact values. Also, the values of EES determine and evaluated for injury severity.
A.Straight Road Model Car-to-Car Accident Configuration
The first design model was selected from the statistic of accident in Melaka as the highest road type accident.
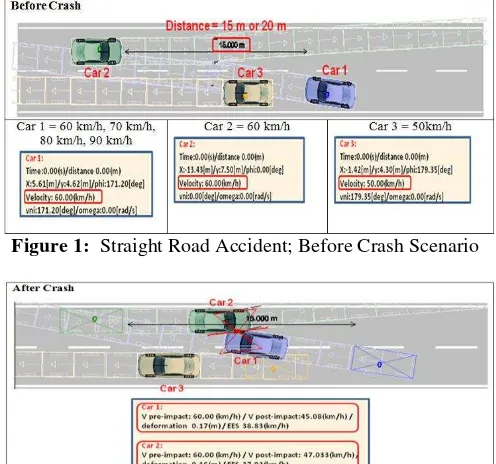
Figure 1: Straight Road Accident; Before Crash Scenario
Figure 2: Straight Road Accident; After Crashed Scenario The simulation model has been developed with two phases of scenario such before accident and after accident. There
was for values of speed and two values of distance used in the model. The model initially setup with t=0.000 and the cars speed used class size of 10km/h with minimum value is 60km/h and maximum value is 90km/h. Figure 1 illustrates the situation or position of the three cars before the accidents occurred. The Car 1 with speed (60km/h, 70km/h, 80km/h, and 90km/h), Car 2 with fixed speed 60km/h and Car 3 with speed 50km/h. The box with blurred color showed the movement of the car after the crashed. Meanwhile, Figure 2 illustrates the situation of after the accident occurred. In the data box, the energy equivalent speed (EES), pre-impact and post-impact will be analyzed. For example, the crashed occurred at t=0.760 s with pre-impact and post-pre-impact for Car 1 is 60km/h and 45.08km/h. Meanwhile, Car 2 having the pre-impact and post-impact for 60km/h and 47.03km/h.
Table 1: Straight Road Model Results for distance, D=15 meter
Table 1 represents that as the speed is increased, the value of EES is higher. Thus, when driving in high speed make the probability of having fatal injuries is higher and the chance for victims to live become smaller when they involved in accidents. Otherwise, the total impact also directly increased as the speed increased. The car that drove in high speed will have harder impact than the car that has been crashed who drove slower than it. In the meantime, Table 2 shows the simplification of overall accident model for accident at straight for in 20m from origin. It showed that the more far distance takes for a car losing control increased the EES value and the total impact faced by them. The EES>60km/h decrease the percentage to live which may 60% or less (Ziedler et al., 2002).
Table 2: Straight Road Model Results for distance, D=20 meter
Miltner and Salwender (1995). The colors were used as follows:
Survival Rate 95% Fatal Injuries < 10% Survival Rate 60%,
No Victims Remain Uninjured Fatal Injuries > 10%
Table 3: Criticality matrix for straight road model impact
Table 3 above represents criticality matrix for straight road model impact. The crashed between both cars at V0=60km/h, showed the probability of live 95% and the risk of having fatal injuries is less than 10%. For accident that occurred in 15m, the probability of having more than 10% of fatal injuries and survival rate less than 60% occurred at speed of 90km/h. Meanwhile, for the accident that occurred in 20m, the possibility of having less 60% to survive with more than 10% fatal injuries occurred at 70km/h. This means, the longer distance to start the accident or lost control the vehicles increased the percentage of fatal injuries. Also, the higher speeds of driving increase the higher level of injury severity. Both indicators are directly perpendicular because the risk of fatal injuries increased as the distance longer and the speed higher.
B.Bend Road Model Car-to-Car Accident Configuration
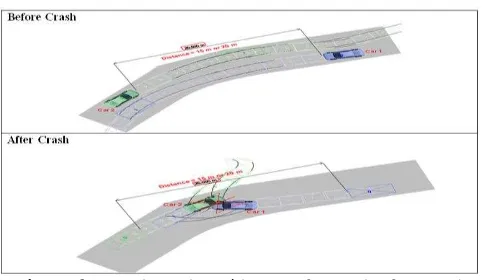
Figure 3: BendRoad Accident; Before and After Crash Scenario
The second model of simulation also developed with before accident and after accident scenario for bend road. From Figure 3 illustrates the situation or position of the two cars using bend road. The Car 1 are setup with speed (60km/h, 70km/h, 80km/h, and 90km/h), Car 2 with fixed speed 60km/h. The box with blurred color showed the movement
of the car after the crashed. Following on the previous figure, Table 4 represents the summary of data for road accident occurred at bend road with distance D=15m from the origin location.
Table 4: Bend Road Model Results for distance D=15m
Table 4 proved that, the total impact is higher when the speed is high velocity and the EES values increased when the speed is increased. For example, the total impact that has been faced by Car 1 increased when the speed of the car increased from 80km/h to 90km/h. In the same time the value of EES also increased.
Table 5: Bend Road Model Results for distance D= 20 meter
Table 5 represents the bend road model results for distance D=20m. For speed V0=60km/h and V0=70km/h, no accident occurred. But, the accidents occurred when Car 1 was driving at V0=80km/h and V0=90km/h. The total impact increased as the speed increase. The EES value also increased as the speed increased which means the fatal injuries expected that reduce of survival rate. Using the EES values, the result for criticality matrix shown in Table 5 was compiled. These values measured according to the EES injury severity level by Zedler et al., (2002) and Miltner and Salwender (1995). The colors were used as follows:
Table 6: Critically matrix for bend road model impact
accident cause no victims remain uninjured with the survival rate is less than 60%.
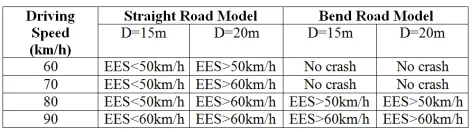
Table 7: Influence of Speed and Distance towards Road Type/Design
Table 7 represents the influenced of speed and distance as the indicators that measured towards the two road type/design. Results found that the different increased of speed and distance contributed to the higher value of energy equivalent speed (EES). The higher of EES value increased the injury severity and decreased the survival rate for road accident’s victims to live. In fact, both speed and distance indicator is directly perpendicular to each other. For straight road model, all the speed values lead towards the accident involvement with different EES. Compared to bend road model, there were two value of speed that did not involved in road accident when driving in this road type.
Technically, the straight road having minimum level of complexity for driver to driving compare to the bend road. Standing of the complexity theory, the complicated road type probably increased the driver’s awareness and alertness compare to the road with minimum complexity drove them to be neglected and careless. Also, the straight road encourages undisciplined drive being rude, over speeding, tailgating etc because this road type is only in linear line. According to this simulation, the two collisions identified occurred at both of the road model which are head-on collision, angular collision and side swipe collision.
IV. CONCLUSIONS
From this study, the simulation has successfully proved that both of speed and distance indicators influenced to the road accident in Melaka. The different value of speed leaded to the different values of injury severity. In the same time, different value of distance also led to different impact in the road accidents. Also, the road type/design also contributed for the road accident to be occurred. This study has been conducted in order to understand the road accident from the different perspectives. The simulation is very effective method to visualize the road accident and at the same time to analyze the accident.
V. FURTHER RESEARCH
Further research efforts needed on determining and investigates the accident analysis on simulation environment. The study on influence of speed and distance in the road accident can be done towards the car-to-pedestrian accident and car-to-other type of vehicles accident. Otherwise, the study can be conducted for influence of refractive error to the driver’s capability, visibility, and behaviors. In fact, statistic reported that many drivers have less awareness towards the influence of refractive error to their driving situations. Sparking in the different perspective, the improvisation of car design possibly can help to reduce road accident. The car design especially interior design was engaging together with ergonomic issues that always need to be highlighted.
VI. REFERENCES
Miltner E. and Salwender J. (1995). “Influencing Factors on the Injury
Severity of Restrained Front Seat Occupants in Car-to-Car Head-On
Collisions”. Heidelberg, Germany.
Moncur R., Chandra S, Jensen G. And Suri B., (2010). “F1 Pace Car:
Crash Analysis using LS-DYNA”.
http://www.lstc.com/pdf/a_pace_car.pdf
Nordhoff L. S. (2005). “Motor Vehicles Collision Injuries: Biomechanics,
Diagnosis and Management”. 2nd Edition. Jones and Bartlertt
Learning. Canada
Rizzi M., (2005). “Steering behaviour of 44 drivers in lane change maneoeuvres on a slippery surface”. Sweden.
Road Transport and Safety Agency (2008) Impact Of Road Accidents. Republic of Zambia. Retrieved on April 2011from:
Robinson D. and Campbell R., (2005). “Contributory Factors to Road Accidents”. Department of Transport.
Roca A. (2011). “Virtual Crash Review”. Retrieved on August 2011 from
http://virtual-crash.software.informer.com/
Royal Malaysia Police (2009). “Statistical Report Road Accident Malaysia
2008-2009”. Bukit Aman, Kuala Lumpur.
Royal Malaysia Police (2011). “Statistical Report Road Accident Malaysia 2010”. Bukit Aman, Kuala Lumpur.
Schoor O. V., Niekerk JL and Grobbelaar B. (2000). “Mechanical Failures
as a Contributing Cause to Motor Vehicle Accidents”. South Africa.
South Africa.
Shahalam A. M. Galal A. Bakheit C.S. and Emad B.F., (2001). “ Factor Analysis: Traffic Accidents and Potential Cause – A Case Study in
Oman”. Oman.
Zeidler F., Pletshen B., Scheunert D., Mattern B., Alt B., Miksch T.