ISSN: 1693-6930
accredited by DGHE (DIKTI), Decree No: 51/Dikti/Kep/2010 287
An Early Detection Method of Type-2 Diabetes Mellitus
in Public Hospital
Bayu Adhi Tama1, Rodiyatul F. S.2, Hermansyah3 1,2
Faculty of Computer Science, University of Sriwijaya 3Faculty of Medicine, University of Sriwijaya
Jln. Raya Palembang-Prabumulih Km. 32 Inderalaya, Ogan Ilir, Southern Sumatera Phone/Fax: +62 711 379249/379248
e-mail: [email protected], [email protected], [email protected]
Abstrak
Diabetes merupakan salah satu penyakit kronis dan merupakan permasalahan morbiditas dan mortalitas utama di negara berkembang. International Diabetes Federation memperkirakan 285 juta orang mengidap penyakit diabetes. Diabetes melitus tipe 2 (T2DM) merupakan yang paling banyak ditemui, sekitar 90-95% dari seluruh tipe diabates yang ada. Deteksi dini T2DM dari berbagai faktor dan gejala-gejala menjadi sebuah hal yang tidak dapat dipisahkan dari asumsi awal yang salah yang berkaitan dengan tanda-tanda yang tidak dapat diprediksikan sebelumnya. Berdasarkan konteks ini, maka teknik penambangan data dan pembelajaran mesin dapat digunakan sebagai metode alternatif melalui pencarian pengetahuan dari data. Kami menggunakan beberapa metode yang sudah diimplemetasikan di Weka, yaitu instance based learners, Naive Bayes, decision tree, support vector machines, and algoritma boosted untuk mengekstrak informasi dari data rekam medis pasien Rumah Sakit Mohammad Hoesin Sumatera Selatan. Rule yang berhasil diekstrak dari decision tree memberikan manfaat dalam sistem pendukung keputusan deteksi dini penyakit bagi dokter.
Kata kunci: data rekam medis, diabetes melitus tipe 2, metode learning, penambangan data
Abstract
Diabetes is a chronic disease and major problem of morbidity and mortality in developing countries. The International Diabetes Federation estimates that 285 million people around the world have diabetes. This total is expected to rise to 438 million within 20 years. Type-2 diabetes mellitus (T2DM) is the most common type of diabetes and accounts for 90-95% of all diabetes. Detection of T2DM from various factors or symptoms became an issue which was not free from false presumptions accompanied by unpredictable effects. According to this context, data mining and machine learning could be used as an alternative way help us in knowledge discovery from data. We applied several learning methods, such as instance based learners, naive bayes, decision tree, support vector machines, and boosted algorithm acquire information from historical data of patient’s medical records of Mohammad Hoesin public hospital in Southern Sumatera. Rules are extracted from Decision tree to offer decision-making support through early detection of T2DM for clinicians.
Keywords: data mining, learning methods, medical records, type-2 diabetes.
1. Introduction
Diabetes is an illness which occurs as a result of problems with the production and supply of insulin in the body [1]. People with diabetes have high level of glucose or “high blood sugar” called hyperglycaemia. This leads to serious long-term complications such as eye disease, kidney disease, nerve disease, disease of the circulatory system, and amputation thas is not the result of an accident.
Diabetes also imposes a large economic impact on the national healthcare system. Healthcare expenditures on diabetes will account for 11.6% of the total healthcare expenditure in the world in 2010. About 95% of the countries covered in this report will spend 5% or more, and about 80% of the countries will spend between 5% and 13% of their total healthcare dollars on diabetes [2].
However, as a consequence of increased obesity among the young, it is becoming more common in children and young adults [1]. In T2DM, the pancreas may produce adequate amounts of insulin to metabolize glucose (sugar), but the body is unable to utilize it efficiently. Over time, insulin production decreases and blood glucose levels rise. T2DM patients do not require insulin treatment to remain alive, although up to 20% are treated with insulin to control blood glucose levels [3].
Diabates has no obvious clinical symptoms and not been easy to know, so that many diabetes patient unable to obtain the right diagnosis and the treatment. Therefore, it is important to take the early detection, prevent and treat diabetes disease, especially for T2DM.
Recent studies by the National Institute of Diabetes and Digestive and Kidney Diseases (DCCT) in United Kingdom (UK) have shown that effective control of blood sugar level is beneficial in preventing and delaying the progression of complications of diabetes [4]. Adequate treatment of diabetes is also important, as well as lifestyle factor such as smoking and maintaining healthy bodyweight [3].
According to this context, data mining and machine learning could be used as an alternative way in discovering knowledge from the patient medical records and classification task has shown remarkable success in the area of employing computer aided diagnostic systems (CAD) as a “second opinion” to improve diagnostic decisions [5]. In this area, classifier such as SVMs have demonstrated highly competitive performance in numerous real-world application such medical diagnosis, SVMs as one of the most popular, state-of-the-art data mining tools for data mining and learning [6].
In modern medicine, large amount of data are collected, but there is no comprehensive analysis to this data. Intelligent data analysis such as data mining was deployed in order to support the creation of knowledge to help clinicians in making decisions. The role of data mining is to extract interesting (non-trivial, implicit, previously unknown and potentially useful) patterns or knowledge from large amounts of data, in such a way that they can be put to use in areas such as decision support, prediction and estimation [7].
Several studies have been conducted regarding T2DM detection. Rule extraction from SVMs has been conducted by Barakat and Bradley [8], an experts system based on principal component analysis (PCA) and adaptive neuro-fuzzy inference systems, Polat and Gunes reported in [9]. In [10] Yu et al combined quantum particle swarm optimization (QPSO) and weighted least square (WLS-SVM) to diagnose type-2 of diabates.
Recently, Huang et al used complementary of three classification techniques such as Naive Bayes, C4.5, and IB1 can be found in [7]. The authors collected 3857 patients, described by 410 features. The patients included not only T2DM’s patients, but also type-1 and others types of diabetes. Overall, C4.5 achieved the best accuracy. Table 1 shows the result classification accuracy with different features.
Table 1. Classification Accuracy (%) conducted by Huang et al [7] Variable Number naive Bayes IB1 C4.5 Average
With this paper, we make two contributions. We present empirical result of inductive methods for detecting T2DM using machine learning and data mining. We report an ROC analysis with AUC in detecting T2DM. We structured the rest of the paper as follow: section 2 provides related research in this area of detecting T2DM, a brief explained of several classifiers and medical data used in this research is provided in section 3. The detailed information is given for each subsection. Section 4 gives experimental design, whereas experimental result and discusion will be provided in section 5. Finally, in section 6 we conclude the paper with summarization of the result by emphasizing this study and further research.
2. Research Method 2.1. Data Collection
We collected diabetic’s patients from one of the government public hospital (Mohammad Hoesin Hospital-RSMH) in Palembang, Southern Sumatera, Indonesia from 2008 to 2009. The patients included only type-2 diabetes, whereas other types of diabetes were excluded. All patients of this database are men and women at least 10 years old. The variable takes the value “TRUE” and “FALSE”, where “TRUE” means a positive test for T2DM and “FALSE” means a negative test for T2DM.
It is important to examine the data with preprocessing which consist of cleaning, transformation and integration. The final data contained 435 cases, where 79,8% (347) cases in class “TRUE” and 20,2% (88) cases in class “FALSE”. There are 11 clinical attributes: (1) Gender, (2) Body mass, (3) Blood pressure, (4) Hyperlipidemia, (5) Fasting blood sugar (FBS), (6) Instant blood sugar, (7) Family history, (8) Diabetes Gest history, (9) Habitual Smoker, (10) Plasma insulin, and (11) Age. The preprocessing method is briefly explained in next section.
2.2. Classification Methodology
2.2.1. Support Vector Machines (SVMs)
Support vector machine (SVMs) are supervised learning methods that generate input-output mapping functions from a set of labeled training datasets. The mapping function can be either a classifiaction function or a regression function [6]. According to Vapnik [11], SVMs has strategy to find the best hyperplane on input space called the structural minimization principle from statistical learning theory.
Given the training datasets of the form {(x1,c1),(x2,c2),...,(xn,cn)} where ci is either 1 (“yes”) or 0 (“no”), an SVM finds the optimal separating hyperplane with the largest margin. Equation (1) and (2) represents the separating hyperplanes in the case of separable datasets.
w.xi+b ≥ +1, for ci = +1 (1)
w.xi+b ≤ -1, for ci = -1 (2)
The problem is to minimize |w| subject to constraint (1). This is called constrainted quadratic programming (QP) optimization problem represented by:
minimize (1/2) ||w||2
subject to ci(w.xi – b) ≥1 (3)
Sequential minimal optimization (SMO) is one of efficient algorithm for training SVM [12] and is implemented in WEKA [12].
2.2.2. Instance Based Learner
2.2.3. Decision Tree
A decision tree is a tree with internal nodes corresponding to attributes and leaf nodes corresponding to class labels. Most implementations use the gain ratio for attribute selection, a measure based on the information gain. C4.5 algortihm in WEKA was implemented as J48 which assigns weights to each class [12].
2.2.4. Naive Bayes
Naive Bayes is a probabilistic method that may not be the best possible classifier in any given application, but it can be relied on to be robust. Bayesian classifiers have also exhibited high accuracy and speed when applied to large databases [14] and was previously shown to be surprisingly accurate on many classification tasks [15]. It also often works very well in practice, and excellent classification results may be obtained even when the probability estimates contain large errors [6].
2.2.5. Boosted Classifier
Boosting [16] is a method for combining multiple classifiers. Researchers have shown that ensemble methods often improve performance over single classifiers. Combining classifiers are becoming popular due to empirical results that suggesting them producing more robust and more accurate predicition as they are compared to the individual predictors [17]. Boosting produces a set of weighted models by iteratively learning a model from a weighted data set, evaluating it, and reweighting the data set based on the model’s performance. During performance, the method uses the set of models and their weights to predict the class with the highest weight. We used the AdaBoost.M1 algorithm [16] implemented in WEKA [12] to boost SVMs, J48, and naive Bayes.
2.3. Performance Evaluation
Estimating the model can be used to estimate its future prediction accuracy. The simple method is holdout, which partitions the data into two mutually exclusive subsets called training set and test set (a.k.a holdout set) [6].
In order to minimize the bias associated with training and holdout data, one can use methodology called k-fold cross validation. In k-fold cross validation, the complete datasets is split into k subsets with equal size and then the model is trained and tested k times. The cross validation will estimate of the overall accuracy of a model is calculated by simply averaging the k individual measures (Equation 4) [6]:
1
1 k
i i
Accuracy A
k =
=
∑
(4)where k is the number of folds used and A is the accuracy measure of each folds. We used 10-cross validation since empirical studies showed that 10 seem to be an optimal number of folds [6]. The number optimizes the time it takes to complete the test and the bias associated with the validation process.
To conduct ROC analysis [18], we rating from the iterations of 10-cross validation, and used Weka [12] to produce an empirical ROC curve and compute its area. We present and discuss the results in the next section.
3. Results and Analysis
We conducted two experimental studies using our data collection described previously. We first applied all the classfication methods to RSMH, and we examined and validated the accuracy both in quantitative and qualitative measure. Quantitative measure is computed in percent, whereas qualitative measure is acceptance degree of patterns by clinicians. All of them we describe in the next section.
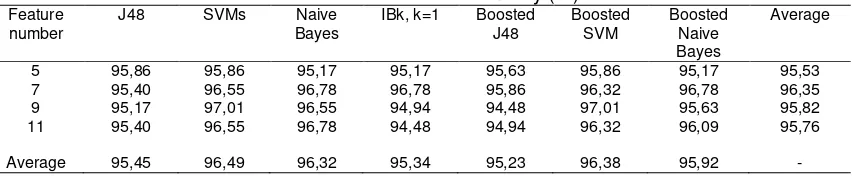
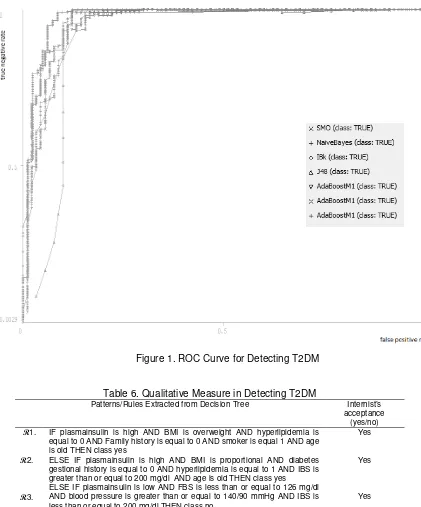
Search. Applying all of classification methods to our dataset (RSMH), then we used k-folds cross validation with k=10 (10-folds) as quantitive measure for all classifiers. Classification accuracy (%) of each splitted feature, ROC curve, and area under curve are shown in Table 4, Figure 1, and Table 5, respectively.
Table 3. Top-11 Features Description patient’s age (children, adult, old)
when pregnant women, who have never had diabetes before (boolean) patient’s family history (boolean)
Condition of abnormally elevated levels of any or all lipids and/or lipoproteins in the blood (boolean)
Table 5. Results for Area Under ROC Curve (AUC) Method AUC clinician’s acceptance regarding the top-6 extracted patterns.
We have collected and analyzed T2DM data from one of the public hospital in Southern Sumatera, Indonesia. We presented best clinical attributes in detecting T2DM. According to this research, we found several important clinical attributes such as smoking behaviour and diabetes gestional history which are presented in patterns. For overall classifier’s performace in our study, SVMs showed best accuracy among other classifiers.
Figure 1. ROC Curve for Detecting T2DM
Table 6. Qualitative Measure in Detecting T2DM
Patterns/Rules Extracted from Decision Tree Internist’s acceptance
(yes/no) R1.
R2.
R3.
R4.
IF plasmainsulin is high AND BMI is overweight AND hyperlipidemia is equal to 0 AND Family history is equal to 0 AND smoker is equal 1 AND age is old THEN class yes
ELSE IF plasmainsulin is high AND BMI is proportional AND diabetes gestional history is equal to 0 AND hyperlipidemia is equal to 1 AND IBS is greater than or equal to 200 mg/dl AND age is old THEN class yes ELSE IF plasmainsulin is low AND FBS is less than or equal to 126 mg/dl AND blood pressure is greater than or equal to 140/90 mmHg AND IBS is less than or equal to 200 mg/dl THEN class no
ELSE IF plasmainsulin is low AND FBS is greater than or equal to 126 mg/dl AND BMI is proportional AND IBS is less than or equal to 200 mg/dl AND diabetes gestional history equal to 1 THEN class no
Yes
Yes
Yes
Yes R5.
R6.
ELSE IF plasmainsulin is high AND BMI is thin AND FBS is greater than or equal to 126 mg/dl AND hyperlipidemia is equal to 1 THEN class yes ELSE IF plasmainsulin is high AND BMI is proportional AND age is old AND diabetes gestional history is equal to 0 AND hyperlipidemia is equal to 1 AND IBS is greater than or equal to 200 mg/d AND gender is male AND FBS is greater than or equal to 126 mg/dl THEN class no
No
No
Third, fasting blood sugar and instant blood sugar are two main attributes which are usually used by inernist in detecting T2DM. In our study, plasmainsulin is the most important attribute since it has highest InfoGain. This method opposes to Huang [7] which use feature selection via model construction as rank method and attribute age become a major attribute.
Fourth, to place our result in the context with the study of Huang [7], they did not report ROC analysis and areas under ROC curves, but we present overall performance classifiers with ROC curves and area under our ROC curves.
4. Conclusion
This paper collects and analyzes medical patient record of type-2 diabetes mellitus (T2DM) with knowledge discovery techniques to extract the information from T2DM patient in one of public hospital in Palembang, Southern Sumatera. The experiment has successfully performed with several data mining techniques and Support vector machines as part of data mining technique achieves better performance than other classical methods such as C4.5, IBk, naive Bayes, and all boosting algorithms. Extracted rules using decision tree are conformed with clinician’s knowledge and more importantly, we found some major attributes such as smoker, gestional history, and plasmainsulin became a significant factor in our case study. Therefore, it leads to be used by physician to diagnose T2DM disease.
This research might have some limitations and is being optimised. Later, it will focus on increasing the datasets in order to maximize result and discover novel optimal algorithm. As further researches, it wolud interesting to include other risk factors such as ethnicity, sedentary lifestyle, and polycystic ovarian syndrome.
Acknowledgements
The authors would like to thank all those who helped in improving the quality and clarity of this paper particularly the anonymous reviewers for their valuable comments.
References
[1] International Diabetes Federation (IDF), What is diabetes?, World Health Organisation, accessed January 2010, http://www.idf.org
[2] Zang Ping, et al. Economic Impact of Diabetes, International Diabetes Federation, accessed January 2010, http://www.diabetesatlas.org/sites/default/files/Economic% 20impact%20of%20Diabetes.pdf. [3] Holt, Richard I. G., et al, editors. Textbook of Diabetes. 4th ed., West Sussex: Wiley-Blackwell; 2010. [4] National Diabetes Information Clearinghouse (NDIC), The Diabetes Control and Complications Trial
and Follow-up Study, accessed January 2010, http://diabetes.niddk.nih.gov/dm/pubs/control.
[5] N. Lavrac, E. Keravnou, and B. Zupan, Intelligent Data Analysis in Medicine, in Encyclopedia of Computer Science and Technology, vol.42, New York: Dekker, 2000.
[6] Olson, David L and Dursun Dulen. Advanced Data Mining Techniques, Berlin: Springer Verlag, 2008. [7] Huang, Y., et al. Feature Selection and Classification Model Construction on Type 2 Diabetic Patients’
Data. Journal of Artificial Intelligence in Medicine, 2007; 41: 251-262.
[8] Barakat, et al. Intelligible Support Vector Machines for Diagnosis of Diabetes Mellitus. IEEE
Transactions on Information Technology in BioMedicine, 2009.
[9] Polat, Kemal and Salih Gunes. An Expert System Approach Based on Principal Component Analysis and Adaptive Neuro-Fuzzy Inference System to Diagnosis of Diabetes Disease. Expert System with
Applications, Elsevier, 2007: 702-710.
[10] Yue, et al. An Intelligent Diagnosis to Type 2 Diabetes Based on QPSO Algorithm and WLSSVM. International Symposium on Intelligent Information Technology Application Workshops, IEEE Computer Society, 2008.
[11] Vapnik, V. The Nature of Statistical Learning Theory 2nd Edition, New York: Springer Verlag, 2000. [12] Witten, I.H., Frank, E. Data mining: Practical Machine Learning Tools and Techniques 2nd Edition.
San Fransisco: Morgan Kaufmann. 2005.
[13] Alpaydm, Ethem. Introduction to Machine Learning, Massachusetts: MIT Press, 2004: 154-155. [14] Han, J. and Micheline Kamber. Data Mining: Concepts and Techniques, San Fransisco: Morgan
Kaufmann Publisher, 2006: 310-311.
[15] Kohavi, R., Scaling Up the Accuracy of Naive Bayes Classifiers: A Decision Tree Hybrid, Proceedings
of the 2nd International Conference on Knowledge Discovery and Data Mining, 1996.
[17] Opitz, D., Maclin, R.: Popular Ensemble Methods: An Empirical Study. Journal of Artificial Intelligence
Research,1999, 11: 169–198.
[18] Fawcett, Tom. An Introduction to ROC Analysis. Pattern Recognition Letters, Elsevier, 2006; 27: 861-874.
[19] Zou, Kelly H. ROC literature research, On-line bibiography accessed February 2011, http://www.spl.harvard.edu/archive/spl-pre2007/pages/ppl/zou/roc.html