Sustainahlc Dcvclopmcnt in thc Mckong Rivcr Basin
Ho Chi Minh City
6
th
-7
th
October 2005
Japan Science and Technology Agency
Proceedings of the International Symposium on
Sustainable Development in the Mekong River Basin
Ho Chi Minh City
6
th
– 7
th
October 2005
Japan Science and Technology Agency
A great deal of additional information on the Water Use and Management System of the Mekong River is available on the Internet.
The proceedings for the symposium of “Sustainable Development in the Mekong River Basin” have been collated to serve a number of important papers by the peoples working at basin development in the Mekong River Basin. These papers cover following themes of sustainable development.
1. Monitoring and Modeling of Water use and Management 2. Influence of Hydrological Cycle Change on Human Activity
3. Evaluation of the Influence of Water Use Change on Economic Development 4. Proposal for Sustainable Water Use System
The aim of the symposium is information exchanges about the Mekong Basin among riparian researchers, administrators and Japanese researches.
The symposium is organized by the JST (Japan Science and Technology Agency) CREST (Core Research for Environmental Science and Technology) research project, “Water Use and Management System of the Mekong River”. It is our great pleasure to have this symposium with the key note by CEO of MRC and heart full arrangement of the symposium hall by Southern Institute for Water Resources Research in Viet Nam.
I hope this symposium can contribute to improve the sustainable development and mutual understanding for direction for solutions of problems. The knowledge will give a useful guideline for sustainable development of the Mekong River Basin, now and in the future.
Hajime Tanji, Ph.D.
Chairman of the Organizing Committee for
ORGANIZING COMMITTEE
- Dr. Hajime Tanji
(National Institute for Rural Engineering, Japan) - Prof. Hisashi Kurokura
- Prof. Mitsuyoshi Yatagai - Prof. Kazuhiko Kobayashi
(The University of Tokyo, Japan) - Prof. Naritaka Kubo
(Tokyo University of Agriculture and Technology, Japan) - Associate Prof. Katsuhiro Saito
(The University of Tokyo, Japan) - Associate Prof. Toshiaki Iida
(Yamagata University, Japan) - Dr. Tang Duc Thang
- Dr. Vo Khac Tri
(Southern Institute for Water Resources Research, Vietnam)
SCIENTIFIC COMMITTEE
- Dr. Tasuku Kato
(Ibaraki University, Japan) - Dr. Satoshi Ishikawa
(Japan Science and Technology Agency) - Dr. Miyusse Sakasegawa
(The University of Tokyo, Japan) - Ms. Hoang Ngan Giang
(Tokyo University of Agriculture and Technology, Japan) - Dr. Koshi Yoshida
(Japan Science and Technology Agency) - Ms. Trinh Thi Long
Contents
Preface
A SYSTEM DYNAMICS MODEL FOR ASSESSING WATER RESOURCES AND SOCIO-ECONOMIC CHANGES : THE CASE OF THE CIANJUR WATERSHED, WEST JAVA – INDONESIA
KATO TASUKU, YANUAR J PURWANTO, BUDI INDRA SETIAWAN, TANJI HAJIME, SAITO KATSUHIRO RELATIONSHIP BETWEEN FLUCTUATION OF WATER LEVEL AND FISH
CATCHES OF HERICORHYNCHUS SPP AND CHHANA MICROLEPTES IN KAMPONG THOM PROVINCE IN KINGDOM OF CAMBODIA
STUDY ON THE MANAGEMENT AND OPERATION OF LARGE-SCALE SURFACE IRRIGATION SYSTEMS IN THE MEKONG DELTA, VIETNAM
A REGIONAL COOPERATION PROGRAMME FOR SUSTAINABLE WATER
RESOURCES DEVELOPMENT OF THE MEKONG RIVER BASIN
DR OLIVIER COGELS
Chief Executive Officer, Mekong River Commission Vientiane, Lao PDR
ABSTRACT
This paper will outline the Mekong River Commission’s orientation to implement a programme for sustainable water resources development, which will help the region achieve the UN millennium goals of halving the poverty level by the year 2015 and improving the welfare of the Mekong Basin’s people. It will discuss the potential for balanced and sustainable socio-economic development in the various water related sectors within the Lower Mekong Basin and explore how the MRC programmes, in conjunction with development partners, can make optimum use of the river’s resources. The paper will highlight the challenges of dealing with trans-boundary issues, inter country cooperation and the need for inclusive dialogue with upstream partners. It will also examine available options for meeting the need to balance environmental, social and economic concerns using the tools available within the MRC.
BACKGROUND
The Lower Mekong River Basin (Cambodia, Lao PDR, Thailand and Viet Nam) is home to approximately 60 million people. There are over 100 different ethnic groups living within the basin's boundaries, making it one of the most culturally diverse regions of the world, but its people are also some of the poorest in the world, with many existing on less than one dollar per day. The population is also growing rapidly and is expected to reach between 80 and 100 million in the next 20 years.
In order to achieve the millennium goals of halving the poverty level by the year 2015 and improving the welfare of the Mekong Basin’s people, it is vital to make optimum and sustainable use of the basin’s biggest resource – its water. Tens of millions of people in the Mekong Basin rely on the waters of the river system to provide them with their primary source of nutrition and as well their livelihood.
Sustainable development of the economic potential of the Mekong river system for food, for power generation, for transportation and for tourism, is a key to fighting poverty and increasing people’s welfare in the region. Today this development is still in its early stages and the water of the Mekong still offers an enormous untapped potential for balanced and sustainable water resources development, but this development must be approached with care.
Water resources development in a large, international river basin is not without risks and difficulties; but the MRC believes that the risks of non-development or of insufficient cooperation are even higher. More, but carefully planned developments and investments are needed in all water related sectors if escalating demands of the rapidly growing population are to be met.
In an increasingly global economy, to attain the goals of poverty alleviation and sustainable economic growth in the Mekong region, it is obligatory that regional integration and cooperation are of prime importance. Furthermore, since water does not recognise borders, it is also clear that for water related developments, regional cooperation at the scale of the whole basin is essential. Development in one country may have consequences in another country, and investments in one sector may affect other sectors. Therefore, there is a need for a joint water resources development programme at basin scale, owned and managed by the riparian countries themselves, in close cooperation with the donor community, investment institutions and civil society.
Since 5 April 1995 Cambodia, Lao PDR, Thailand and Viet Nam have been working together to promote and co-ordinate sustainable management and development of water and related resources in the Mekong Basin.
The water resources of the Lower Mekong Basin are described in some detail in the MRC State of the Basin Report (MRC 2003). In strategic terms, important characteristics of Mekong water resources include the following:
• Abundance: Annual runoff averages around 475 km3/year. Per capita resources currently stand at over 8500
m3/person/year – compared with 2200 for the Nile; 1400 for the Rhine; 2265 for the Yangtze and 1700-4000
for the Ganges (WRI, 2003).
• Low consumptive use: Average annual withdrawals are estimated at around 60,000 million m3, or 12% of
total annual flows; the total volume of regulated storage in the basin (including the Upper Basin) for hydropower and irrigation is less than 20,000 million m3 (less than 5% of annual flows); the per capita
volume of water stored in the Lower Mekong Basin is estimated to be 230 m3 per person, which is about
nine times less than that of China (and 25 times less compared to the US (5800 m3 per capita).
• High dependence on in-stream uses (particularly by the poor): The Mekong fishery is one of the largest inland fisheries in the world, estimated to be worth at least $US 2,000 million annually, and providing the major protein source for many people in the basin. Inland navigation is an important mode of transport for many areas where road access is limited
• Extreme seasonality: In most parts of the Basin, flows in the driest three months constitute less than 10% of total annual flows; while flows in the wettest three months make up over 50% of total annual flows (MRC DSF).
• Importance of the flood pulse for the ecology of the floodplain and the Mekong fishery: During the wet season, between 1 and 4 million hectares of floodplain are submerged, including the Tonle Sap Great Lake.
• Dry season water shortages: Dry season shortages occur as a result of the rainfall seasonality, concentration of extractions in the driest period and drought events during the onset of the wet season.
• Water quality: Water quality in the mainstream is generally good, and is rarely a constraint to water use. The exception is saline intrusion, acid sulphate drainage and pollution in intensively used areas of the Mekong Delta
A BASIN-WIDE DEVELOPMENT PROGRAMME
As an international river basin organisation, the MRC has identified four main roles it can play in the region:
• Development and investment facilitation
• Provision of a regional cooperation framework
• Environmental monitoring and protection
• Knowledge management and capacity development
During the past 10 years, with strong support from the international donor community, MRC has made considerable progress in implementing its 1995 agreement. It has achieved an impressive amount of work in terms of knowledge generation and dissemination, capacity building and development of powerful planning tools. Much of this has helped the member countries in their own strategies. MRC is now promoting a basin-wide development programme aiming at facilitating investments, both structural and non-structural, based on collaborative planning of win-win solutions at basin scale. It is important that such a development programme is owned and managed by the Mekong countries themselves, in close cooperation with the donor community, investment institutions and civil society.
The MRC is currently preparing its Strategic Plan 2006 – 2010, addressing in a holistic way the development needs in the areas of navigation, flood management, fisheries, irrigation, hydropower, environment management, watershed management, tourism, and capacity development. The orientation of the MRC Programme is to implement Integrated Water Resources Management (IWRM) at basin scale as a means to alleviate poverty and to enhance economic growth in the scope of the millennium goals.
The MRC Programme focuses specifically on water resources, and can be seen as a contribution to the Greater Mekong Subregion Economic Cooperation Programme (GMS), promoted by the Asian Development Bank. The MRC programme is also enhanced by other regional initiatives such as the ASEAN Mekong Basin Development Cooperation, and the United Nations Economic and Social Commission for Asia and the Pacific (UNESCAP).
Joint planning, management and coordination of the MRC Programme is achieved in close cooperation with the National Mekong Committees (NMC) and the line agencies of the member countries. The role of the MRC, as an intergovernmental body, is to facilitate coordinated and balanced investments in the basin by supporting the countries at the level of strategic planning and programme implementation.
The MRC is now working to identify, plan and prioritise a broader range of development projects in cooperation with the donor community, investment institutions, and the civil society. MRC’s role in the development process, as an International River Basin Organisation (RBO) owned by its member countries, is complementary to the role of investment banks and it plans to act as a promoter and facilitator of the development and investment process in the water sector in the region, encouraging and coordinating sustainable use and management of water and related resources for navigation, food production, energy production and domestic use.
The MRC Regional Cooperation Programme for Sustainable Water Resources Development of the Mekong River Basin is structured in the following sub-programmes:
Basin Development Planning
Water Use Management
Environment Management
Flood Management and Mitigation
Navigation
Fisheries
Hydropower
Agriculture, Irrigation and Forestry
Tourism
Integrated Capacity Building
Information Management and Decision Support
The sub-programmes are further subdivided into priority subject areas or components under which the MRC projects will be implemented.
Basin development planning
La nd & w a te r m a n age m ent F lood manag e ment H y dr o pow er Nav igati on Fi sh eri e s T our ism Environment Management Information and knowledge management Integrated Capacity Building Regulatory Framework MRC Programme
Sustainable Water Resources Development of the Mekong Basin
Figure 1. The Mekong River Commission’s Programme Structure.
Agriculture is still the dominant economic activity in the Lower Mekong Basin. It accounts for between 20% (in NE Thailand) and 52% (in Lao PDR) of GDP, providing food for 300 million people in the world. It provides livelihoods for around 75% of the LMB population and is an important source of export income. Irrigation is an integral part of the agricultural production systems. Wet season irrigation helps to secure the rice crop and dry season irrigation allows a second (sometimes third) crop and is increasingly important in the production of high value vegetables, fruit and industrial crops. As populations in the region are growing rapidly, irrigation is vital to food security as well as economic development. Thailand and Vietnam have already developed a substantial proportion of their irrigable land and water resources in the LMB.
There is still potential for expansion of irrigation, but more investment is also needed in the improvement of existing irrigation systems and management capacities aiming at increased irrigation efficiency and water productivity. During the wet season, water availability is far in excess of demand, but dry season water shortages are common, particularly in the Mun-Chi basin in Thailand and in the Delta region of Viet Nam, which is currently responsible for about 50% of that country’s total food production. Intrusion of seawater into the Delta is becoming more and more an issue of concern, reducing the potential for irrigated rice production.
Table 1. Importance of agriculture to LMB economies (2002).
Country
Share of agriculture in
GDPa
Growth in agricultural productionb
Growth in agricultural value
addedd
Share of labour force
in agriculturee
Net agricultural
exportsf
% (2003) % per year (2003) % per year (2002) % (2001) US$ millions
Cambodia 37.2 9.8
(1.9)c 1.8 70 -282.1
Lao PDR 48.6 2.2 4.3 76 -41.1
Thailand 9.8 6.8 4.4 56 4,499.70
Viet Nam 21.8 3.3 3.0 67 966.7
Sources: a,b/ ADB (2004); c/ National Institute of Statistics, Cambodia; d/ ADB, 2003; e/ FAO; f/ FAO
(negative numbers indicate imports)
The MRC is monitoring land use changes in the four member countries, identifying problems and implementing technical surveys of irrigation practices to improve efficiency.
The Lower Mekong fishery is one of the most productive inland fisheries in the world, estimated at around three million tonnes per year, with a total value of around $US 2 billion. The basin provides a wide variety of breeding habitats for over 1300 species of fish, but this precious resource is under stress both from over-fishing and from an increasing population. The MRC programme incorporates strategies to manage the productive Mekong fisheries so as to sustain their high yield and economic output well into the future, through research and training; assessment of catches; aquaculture of indigenous species and management of river and reservoir fisheries
WATER FOR TRANSPORT AND TRADE
The Mekong River is an important gateway to trade centres in the Southeast Asia region and beyond. In 2001, trade valued at $4,700 million was transported throughout the LMB on the Mekong River and its tributaries, including the passage of an estimated $88 million of goods between Thailand and Yunnan. There are 25 major ports on the Mekong River and except for a 14 km stretch around the Khone Falls near the Lao-Cambodia border, almost the entire length of the river is navigable for nearly eight months of the year.
ports; integration of navigation with other transport modes (particularly in the international context); physical and non-physical barriers to navigation; and environmental and safety concerns such as pollution.
WATER FOR POWER
The Lower Mekong River Basin has an estimated theoretical potential for hydropower development of about 30,000 MW (17,000 MW for the mainstream and 13,000 MW for the tributaries). However, only a small part of this potential has currently been developed (2000 MW or 7%). It is estimated that the hydropower potential of the Lancang basin (China) amounts to 23,000 MW, of which 13% (3,000 MW) is currently developed. Altogether, the Mekong Basin has an overall hydropower potential of 53,000 MW with an estimated development level of 9.4%.
Demand in the LMB is expected to grow by around 7% per year over the next 20 years, and there are substantial opportunities for trading of power between the countries in the region.
Hydropower options are included in the power development strategies of all the Mekong countries. There is thus still a large hydropower potential that could be developed in the Mekong region. Obstructions to meeting this potential include the lack of an effective regional transmission system, competition from other power sources, and resistance to hydropower development due to concerns about the impacts of dams on fish migration and the river flow regime.
Successful development of the region’s hydropower potential will require a well-structured and integrated development programme.
Table 2. Energy in the LMB. Country Energy
Demand 2000 (GWh)1
Electrification rate (%) in
20012
Projected energy demand 2020
(GWh per year)3
Current installed capacity from
all sources (MW)4
Hydropower Potential (GWh/year)5
Currently installed hydropower
capacity (MW)6
Cambodia 381 4-80 5,700 143 36,300 11
Lao PDR 865 5-100 4,400 643.1 102,300 625.6
Thailand 96,781 802-100 328,000 22,888 26,100 2,936
Viet Nam 26,722 28-100 169,000 8,227 10,000 4,154
TOTAL 124,749 - 507,100 31,901.1 174,700 7,726.6
Notes: 1/ ADB, 2001; 2/ MRC, 1997; BDP, 2002; Meritec, 2004; MRC (2003b); 3/ ADB, 2001; 4/ MRC, 2001; 5/ MRC, 1997; 6/ MRC, 2001
WATER FOR RECREATION
The tourism industry is already making a significant contribution to the economies of the member countries. Being blessed with abundant historical and cultural heritage and unspoiled natural beauty, the Mekong River Basin has also a great potential to attract visitors from various parts of the world, generating more income from foreign exchange. Being a highly labour-intensive industry, tourism also plays a significant role in generating employment opportunities to localities where it is promoted, in a balanced manner, which also ensures necessary environmental protection.
THE NEED FOR PROTECTION
warning mechanism, The MRC has a strong role to play as a facilitator on trans-boundary issues regarding floods and flood protection.
As the population and infrastructure on the floodplain grows there is the potential for increasing loss of life and economic damage due to floods. Development of levees to protect crops and infrastructure as well as construction of elevated roads less subject to flood impact have the potential to unintentionally exacerbate flooding elsewhere in the floodplain. They can also block fish migration routes on the flood plain. To meet the requirements of a regional approach to flood management, the MRC has initated the development of a Regional Center for Flood Management and Mitigation in Phnom Penh, which is hosting the MTC Regional Flood Management and Mitigation Programme strongly supported by the donor community.
In terms of ecological health and water quality, the Lower Mekong Basin is in a fortunate position compared with similar river basins. With generally low levels of industrial activity in the basin at present, the two main immediate concerns about water quality are diffuse pollution due to poor catchment land management, and the potential for water quality emergencies arising from spillages or shipping accidents. Also in the Mekong Delta nutrient levels in the water are high and rising, presumably due to intensive agriculture and aquaculture and the wastewater produced by areas of high population density but this will soon change.
A fast-growing population, together with increased industrial and infrastructure development all place competing demands on resources. The MRC’s Environment Programme is engaged in environmental monitoring and assessment programme, which, together with its work on environmental flow management, will provide environmental decision support for development options.
Deforestation is a significant environmental concern of all Mekong country governments. Concerns focus on the loss of biodiversity and livelihoods as the forests are cleared, as well as the potential impact of the land-use change on the rivers. The MRC is working to preserve the integrity of the watersheds of the four countries.
PLANNING AND DECISION-SUPPORT TOOLS
Integrated Water Resources Management and Development needs to be supported by databases and Geographical Information Systems (GIS) in order to store, analyze, and distribute hydro-meteorological data, land use data, socio-economic data, administrative data, infrastructure data, etc. Planning and decision-making require mathematical simulation models and Decision Support Systems (DSS). During the past five years, the MRC Secretariat has developed rich databases and powerful mathematical tools that will be updated through an effective international data management and exchange policy. The MRC now has a strong basin modelling and knowledge base and the ability to undertake environmental and trans-boundary analysis.
One of the MRC’s objectives has been to strengthen the framework for trans-boundary environmental management by the four Lower Mekong Basin countries. The simulation tools allow for the analysis of a range of multi-sectoral development scenarios, which will help countries make informed decisions.
The scenarios are built up by describing:
• Available water resources, defined by the balance between the supply of water, determined mainly by climate, and current uses. Water use can be consumptive, as in irrigation, domestic and industrial use, or non-consumptive, as in fisheries and navigation.
• Trends that affect water use or availability, such as population growth, increased irrigation or climate change.
• Interventions, which may be physical - for example, dams, weirs and irrigation works - or non-physical, in the case of new management systems, tariffs, water use policies and laws.
• By looking at a range of scenarios, it is possible to build up a picture of how sensitive the river system is to particular types of change, and how different factors interact.
The outcomes of possible scenarios are evaluated using a combination of hydrological modelling, environmental and economic assessment tools and expert opinion. The basin models and Decision Support Framework (DSF) developed under the MRC's Water Utilisation Programme have been designed to give a detailed description of water availability and flows under different scenarios. When information about river flow is known, conclusions can then be drawn about how these will affect the environment and the communities that depend on natural resources.
The DSF includes three detailed simulation models; of the LMB subcatchments, the river network, and the unique floodplain system below Kratie (in Cambodia), including the Great Lake and Mekong Delta. These simulation models can provide detailed statistical information on the daily distribution of water anywhere in the land or rivers of the LMB, and salinity intrusion in the Mekong Delta for a period of up to 16 years.
One essential part of any development strategy is the people behind the planning. In the Mekong region, there is a strong need to develop the technical, institutional and legal water resources management capacity and expertise at various levels. The MRC is developing a regional training programme, involving a network of leading education and training institutions in the region and worldwide, which it expects to increase regional cooperation and integration. Capacity strengthening in all fields will lead to more effective integrated water resources development and river basin management.
REGIONAL COOPERATION AND CONFLICT PREVENTION
In an increasingly global economy, to attain the goals of poverty alleviation and sustainable economic growth in the Mekong region, regional integration and cooperation are of prime importance. Furthermore, since water does not recognise borders, it is also clear that for water related developments, regional cooperation at the scale of the whole basin is essential. Development in one country may have consequences in another country, and investments in one sector may affect other sectors.
The 1995 Mekong Agreement provides the legal framework enabling cooperation for sustainable development within the Mekong Basin. Part of the MRC’s new strategy will be to identify, categorise and prioritise projects, programmes and investment opportunities, to seek assistance for and then to implement them at basin level. But optimal and equitable development of the Mekong’s water resources requires collaborative planning and joint identification of investment priorities referring to basin-wide strategies in each water-related sector.
Joint management of water resources requires appropriate legal administrative procedures and tools, to be used both for development planning and for operational management of infrastructure. Since 1995, and with support of the Global Environment Fund and the World Bank, MRC member countries have been working on agreements on a series of procedures regarding their shared resources. These include agreements on data exchange, on water quality and on procedures for notification of water use, such as diversions of the mainstream and constructions of infrastructures on tributaries.
In any international river basin, there are inevitably potential areas of water related conflicts. MRC has an important role to play at the level of conflict prevention. With its knowledge base and cooperation mechanisms, MRC gets more and involved in the discussions relating to potential conflict areas or “hot spots”. The MRC governance bodies, the Joint Committee and the Council, are playing an increasingly active role in handling sensitive trans-boundary issues. In addition to the regular Joint committee and Council meetings, more than 40 trans-boundary meetings have been organized since 2002. There are also several bilateral and multi-lateral cooperation initiatives between the Mekong countries.
SOCIO-ECONOMIC DEVELOPMENT AND POTENTIAL ENVIRONMENT IN THE
MEKONG DELTA, VIETNAM
MSc. TRINH THI LONG & Prof, Dr, NGUYEN AN NIEN Southern Institute of Water Resources Research
2A Nguyen Bieu Street, Dics. 5, Ho Chi Minh City, Vietnam.
ABSTRACT
Mekong River Delta is one of the 7 key economic regions of the whole country, is an important agricultural production of Vietnam, which contributes more than 50% of food production; more than 55% of aquatic and fruit production; more than 61% of exported aquatic production of the country … Mekong River is considered as water resource of determine meaning to the existence and development of more than 16 million people and society in the Mekong Delta of Vietnam. There has been an encouraging progress in socio-economic development in the Mekong Delta over the past years, especially since the adoption of the policy of renovation. However, there remains and develops serious emerged environmental problems.
Through the steer view and socio-economic development thought of the Party and Government of Vietnam for the Mekong Delta, the objectives and development directions of socio-economic in the Mekong Delta to the year 2010, directions of adjustment on the production of agriculture, forestry and aquaculture till year 2010, the paper has analyzed and assessed the existing environmental problems in the Mekong Delta in different zones; defined serious environmental polluted areas and predicted the potential environment in the process of rapid socio-economic development in the Mekong Delta, especially prediction of the development of environment in the urban zone, industrial zone, agricultural development zone, coastal zones, flooding areas and the area affected by flood protection structures in the Mekong Delta.
Addressing in a harmonic way the linkage between socio-economic development and environmental protection toward sustainable development should be proceeded ahead.
GENERAL INTRODUCTION
The Mekong Delta is located at the South pole of Vietnam. The part which belongs to Vietnam is located at the downstream of the Mekong delta and is recognized with 3,971,232 ha in area, accounting for 12% area of the country, and average population in 2000 was 16,365 million people, accounting for 22% population of the country. Its population density is 412 persons/km2 which is 1.75 times higher than the average population density of the country (i.e. 236 persons/km2). The entire country is covered with 9.3 million ha for farm land whilst 2.97 million ha among
which is found at the Mekong delta, accounting for 32%. Farm land in the Mekong delta is 3-4 times larger than that in other deltas or plains. Hydrological regime of the Mekong delta suffers strong impacts from the hydrological regime of the Mekong river and tidal regime of the East sea.
The Mekong delta is the most important area of agricultural production in Vietnam, contributing over 50% food productivity, over 55% seafood products and fruits, and over 61% value of seafood exportation of the country, etc. The Mekong delta is characterized with:
- Its reputation of being the largest and most fertilized delta not only in Vietnam but also in the South East Asia;
- The largest and key area of the country for food and foodstuff production;
- The largest area of the country for aquaculture farming which accounts most national productivity and value of seafood products annually;
- Its great potentiality in livestock development for egg and meat supply for the locality itself, the entire nation, and for exportation.
development, the Mekong delta should make use of its potentiality and advantages in geography, land resources, water resources, forest, sea, and labor force for further promotion on rice, seafood and agricultural product exportation. Water resources in the Mekong delta is considered as a top important factor of appropriate concerns to ensure sustainable environmental development and the growth of agricultural and aquaculture sectors, and at the same time, facilitate and accelerate the development of other sectors.
However, strong socio-economic development has caused several disadvantages for the environment and ecology of the Mekong at the present and in the future.
OUTLOOK AND DIRECTIVE ON SOCIO-ECONOMIC DEVELOPMENT FOR THE MEKONG DELTA
The direction on the development of the Mekong delta [7] indicated in the ninth Party Congress in 2001 is specified as follows:
“To continue to improve its role as a largest area for national rice, agricultural and seafood product exportation; to accelerate and improve production on food, vegetable, livestock, seafood and commodities; to promote processing industries and mechanics serving for agriculture, home craft and small scale industry, and services; to work out the construction of industrial parks using gas in the South West.
To make complete road system and navigation network; to improve and enlarge the National road 1A and open some new routes for transportation development in the South West; to improve national roads leading to respective provinces; to construct a bridge over Hau river and ensure the availability of bridges on such lines; to develop route systems for through traffic and rural transport; to construct strong bridges to replace foot bridges; to complete and improve river ports and airports; to make residential area planning and construction with appropriate infrastructure to accommodate thousand year flood prevention and salinity intrusion prevention.”
The report on socio-economic development plan for the Mekong delta of the Government [5] identified its outlook and directive as follows:
To accelerate industrialization, modernization; to continue to overcome existing shortcomings in the economy, gradually increasing economic growth and internal accumulation; to look for and make use of external resources to further promote and consolidate internal force and vice versa;
To rapidly change the economic structure and labor allocation oriented to industrialization and modernization, making dynamic comparative advantages, improving economic affects and the compatitiveness on commodities and services of national and international markets and to promote exportation;
For areas of annually flood prone, there should be combined solutions of “living with the flood” and the changing of economic structure oriented to industrialization and modernization and avoid being backward in compared with neighbor localities;
For coastal area, the economy should be directed to the exploitation of benefits from the sea and coastal area and development of new industrial sectors. Economic structure shall be changed in accordance with the capacity of respective components in order to promote available resources.
To prioritize infrastructure construction for areas of comparative advantages and areas of developed double infrastructure to accelerate production development, reducing the developed gap on living standard among respective localities; to gradually develop infrastructure for the socio-economics of the entire area;
To make a distinct changes in human resources, human resources development; to focus on educational development and public awareness improvement; to produce a labor force of high qualification and appropriate allocation which is capable to obtain modern technology, to accommodate new industries, and being qualified and equipped with creativity ability to serve for industrialization and modernization;
To effectively solve social critical issues; to create more job opportunities to the labors; to reduce unemployment rate in town and job deficit in rural area; to eliminate hunger and alleviate poverty and prevent being poor again; to consolidateand further improve public living conditions; to develop culture and information and public health care;
To promote synchronized applications of advanced science and technology to daily production, socio-economic development in associated with ecological environment conservation for the common welfare of the public whilst flooding normally occur annually; and
DEVELOPMENT OBJECTIVE AS OF 2010[5]
• GDP per capita in was USD 412 in 2001, USD 470-500 in 2005, and shall be USD 700-730 in 2010;
• Total export turn-over is estimated at USD 3 billion and shall be at USD 5.5 in 2010. Rice for exportation shall be stable at about 3.5-4 million tons. Export turn-over is estimated at USD 1.5 billion in 2005 and shall be at USD 2.5 billion in 2010;
• To create about 350-400 thousand jobs per year, averagely. Labors with trained skills and competence in 2005 shall be at 20% and shall be at 30-35% in 2010;
• There will be no household of hunger as of 2005; households of poverty shall be reduced to about 8% as of 2005 and to about 4-5% as of 2010;
• Households in rural area to be supplied with power shall be at 70-80% by 2005 and at 100% as of 2010. By 2005, 75% households of the city and 60% of the rural area shall be supplied with clean water, and respectively, 90% and 80% by 2010. There shall be no foot bridge as of 2005; and
•
To increase the average value of agricultural, forestry, and aquiculture farming per hecta of agricultural farm land from USD 1,200 presently to USD 1,600 as of 2010.
DEVELOPMENT ORIENTATION
The population of the Mekong Delta in 1998 was 16 million and shall be increased to 21.1 million as of 2010. Farm land takes major account in land use (i.e. 73.29%); land for forestry takes an account of 11.12%; land for urban area increased 1.51%; and land for residential area decreased to 3.58%. GDP of the area in 2010 shall be VND 159,673 billion (including 41% from the city and 59% from the rural area). It is anticipated that incomings for treasury budget of the Mekong delta from 1995-2010 shall be VND 278,657 billion. Incomings for treasury budget from GDP in 2000 accounts 18.2% and shall be 23.4% in 2010. Expenses from treasury budget shall be increased, i.e. 20% of the budget shall be for the investment and development of social infrastructure [5].
ORIENTATION OF STRUCTURAL ADJUDGEMENT FOR AGRICULTURAL, FORESTRY, AND AQUICULTURAL PRODUCTION AS OF 2010 [4]
¾ To stabilize irrigated area for paddy field from 1.8-2 million ha to ensure the supply of 18-19 million ha of rice for local consumption and for exportation in accordance with national food security strategy and the export target of 3.5-4 million tons of rice per year;
¾ To reduce area for winter crop at coastal areas in the East and West sea for shrimp farming and other aquatic products of both salt and brackish water and of high export value;
¾ To promote rice farming in combination with tiger shrimp farming at coastal area effected with salt water (e.g. one shrimp farming season during dry period on paddy fields of winter crop);
¾ To encourage the development of plants for material to processing industry in order to replace exported material such as cotton, corn, and soya bean;
¾ To continue with the development of other plants which provide material for processing factories in the area such as sugar cane, pineapple, vegetables, beans, coconut, and fruits;
¾ To promote aquaculture farming in salt, brackish and fresh water, and mainly focus to tiger shrimp, blue clawed shrimp, fish of all kinds, and mollusca for national consumption and for export;
¾ To continue with the development of domestic animals, including specific concerns to animals which take the major part in the market, i.e. pig, poultry, cow for meat, cow for milk, etc.; and
¾ To develop forestry not only to have good protection of mangrove forest in the coastal area for ecological and environmental conservation but also to develop indigo forest for the environment of floodplain area and to earn income from making business.
Area of urbanization (area I)
- High speed of urbanization and rapid increase of population whilst the infrastructure has not been developed accordingly;
- Environmental pollution due to waste water, exhaust gas and solid waste discharge from domestic use, activities from respective sectors of services, trading and commerce, health care, education, transportation, livestock, etc; and
- Pollution due to smoke, dust, noise, waste water, solid waste, and toxic waste discharge from industrial parks and home craft and small scale industry enterprises.
Coastal area (area II)
- Degradation of mangrove forest due to deforestation for shrimp farming; - Degradation on aquatic resources;
- Degradation of biological diversification;
- Sea water pollution and water pollution at the coastal area due to the operation of ports and harbors, transportation, aquaculture farming, exploitation and processing;
- Erosion and deposition at the estuaries and coastal area; and - Problems caused by natural disaster and flooding.
Area of agricultural development (area III) - Salinity and alum intrusion;
- Pollution due to the utilization of chemicals and fertilizers in agriculture; - Soil degradation due to intensive cultivation;
- Pollution of surface and ground water resources due to feces, solid waste, waste water from domestic use and waste water from livestock activities;
- Increase of water-born diseases due to polluted water resources; and
- Pollution due to smoke, dust, waste water and solid waste discharge from home craft and small scale industry enterprises which are located along the river.
Floodplain area (area IV)
- Clean water and water for domestic use in flood period;
- Collection and treatment of waste water for residential areas in the floodplains; - Solid waste and waste from domestics in long flood period; and
- Burying dead people and treatment to dead animals for sanitation and environment conservation after flooding.
Area of severe pollution and environmental degradation
- Cities and towns (townships) and factories of large scale, industrial parks and export processing zones (Area I); - Mangrove forest which were destroyed for shrimp farming (Area II);
- Estuaries and coastal areas under erosion and deposition (Area II); - Home craft and small scale industry enterprises along the river (Area III); - Floodplain areas during flood period and after recession; and
- Areas of salinity and alum intrusion.
POTENTIAL ENVIRONMENT IN THE MEKONG DELTA BY 2010
Potentiality, socio-economical and environmental effects of structure changing and adjustment of agricultural, forestry, and aquaculture farming production
¾ The positive change in development of agricultural, forestry, and aquaculture production shall create job opportunities to the labors. It is estimated that there shall be jobs provided to about 2 million people during 2001-2005, including 1.4 million people in aquatic sector, and to about 2.5 million people during 2006-2010, including 1.6 million people in aquatic sector;
product processing as well as the development of services for production and daily life, i.e. commerce, agricultural activity encouragement, credit, etc.;
¾ With natural characteristics, the Mekong delta has formed diversified ecology. It is the sensitive and vulnerable place where several kinds of animals and plants were grown up and settle their living. Currently, the Mekong Delta is facing up with several causes of environmental pollution due to objective factors in respective resources and due to subjective factors from production activities of the human beings, e.g. water pollution on the rivers and channels due to industrial and domestic waste, environmental pollution in residential area of those who moved out from flooding area and have to live with domestic animals whilst there are insufficient power, clean water and water closets are provided, pollution at area of aquaculture farming development in coastal area due to the lack of waste drainage system, environmental pollution at the floodplains after recession, and pollution due to forest fire, etc; and
Prediction of waste discharge in the Mekong Delta
According to the statistical data on 1 April 1999 [1], the population in the Mekong Delta is 16.132.024 people, in which 85% people in rural area and 15% from urban area. The prediction on population of the Mekong delta shows that there will be 21.1 million people by 2010, including around 5,275,000 people from urban area, accounting for 25% of the total population, and around 15.825.000 people from rural area, accounting for 75% of the total population.
Waste water
By 2010, the consumption and wastewater discharge is estimated in the following table: Table 1: Prediction of wastewater discharge in the Mekong Delta up to year 2010
Urban area Rural area Population 5,275,000 15,825,000 Consume water /day (litre) 120 100
Discharge 80% 96 80
Wastewater /day (m3) 5,064,000 1,266,000
Wastewater/year (m3) 1,704,360,000 462,090,000
Compared to the year 2000 4 times higher 1.5 times higher
According to the Rapid assessment of sources in 1993 made by WHO [10] for several developing countries, the daily untreated pollutants discharged by the human beings to the environment shall be as follows:
Table 2: pollutant discharge coefficient
No Pollutant Quantity
(gr/person/day)
Average quantity (gr/person/day) 1 Total suspended solids (TSS) 70 – 145 107.5
2 BOD5 45 – 54 49.5
3 COD (dichromate) 72 – 102 87.0
4 Ammonia (NH4-N) 2.4 – 4.8 3.6
5 Total Nitrogen (N) 6 – 12 9.0
6 Total Phosphorus (P) 0.6 – 4.5 2.5
7 Oil without mineral 10 – 30 20.0
Table 3: Prediction of volume and concentration of pollutants from urban and rural areas in 2010
Urban area Rural area No Pollutant
Volume in 2010 (ton/day)
Concentration (mg/l)
Volume in 2010 (ton/day)
Concentration (mg/l)
1 Total suspended solids (TSS) 544.4 1,120 49,674.7 1,344
2 BOD5 250.7 516 22,873.4 619
3 COD (dichromate) 440.6 906 40,201.8 1,088
4 Ammonia (NH4-N) 18.2 38 1,663.5 45
5 Total Nitrogen (N) 455.8 94 4,158.8 112
6 Total Phosphorus (P) 12.2 25 1,109.0 30
7 Oil without mineral 101.3 208 9,241.8 250
Compared to Vietnamese standard (i.e. TCVN 5954 -1995) [9] , the concentration of the above parameters are tens to hundreds times higher (for type A and B).
Urban and even rural wastewater discharge without proper collection and treatment shall cause severe pollution to the environment and to surface water resources in particular whilst surface water is used for multi-purposes including water supply for domestic use.
According to the master plan, industrial parks in the Mekong delta shall take about 7,000 ha. However, it is predicted and anticipated that area for industrial parks in 2010 shall be less than 50% in compared with that in the master plan.
Based on the estimated water discharge volume in technical planning for industrial parks, it is anticipated that water discharge volume from the industrial parks in the Mekong delta in 2010 shall be 280,000 m3/day and night. Surveys made at the industrial parks in Ho Chi Minh City and the eastern south allows estimating the average volume of substances from waste water discharge in 2010 as follows:
Table 3: Prediction on average concentration of pollutants in waste water discharged from the industrial parks Parameter Average concentration found in the industrial
parks from HCMC and the eastern south (mg/l)
Pollution loading from the industrial parks in the Mekong delta by 2010
(kg)
SS 253 70,840
BOD5 170 47,600
COD 271 75,880
Solid waste
By 2010, if it is estimated that each person from urban area discharges 0.75 kg solid waste per day, solid waste discharge from urban area of the Mekong delta shall be 15,825 tons/day or 5,776,125 tons/year; such discharge shall be 2 times higher than that of 2000. Among which, organic solid waste accounts for about 60% (equivalent to 3,465,675 tons) and 6% for toxic solid waste (equivalent to 346,568 tons/year). Such domestic solid waste shall cause severe pollution to the environment without proper management.
In the rural area, if each person discharges 0.5kg solid waste, the solid waste discharge from rural areas by 2010 will be about 7,912 tons/day or 2,888,062 tons/year. Such discharge shall be 2 times higher than that of 1999. In which organic solid waste accounts for about 80%. Besides, solid waste from agriculture is also significant.
In case 40 kg of solid waste per day is discharged from every ha of industrial land, it is estimated that by 2010 there shall be 140 tons of solid waste discharged per day or 51,100 tons/year, including 5,621 tons of toxic waste.
For the industries of medium and small scales: These industries are located scatteredly at different places in urban area, residential area, along the roads and navigation routes or within the traditional home craft villages, etc. They are equipped with manual technology, outdated equipment and machinery, small work-space, and limited investment capital. Most of the enterprises are not equipped with waste treatment system due to several causes: high cost, no power supply, large area needed, no proper treatment technology is equipped, no encouragement for waste treatment system investment. Therefore, these enterprises have caused pollution to the surrounding residential areas and it is very obvious withthe tendency of pollution increase due to industrial waste and waste from home craft and small scale industries.
State enterprises (as of 31/12/1999), industrial solid waste in the Mekong delta shall be 1,281,280 tons/year and 8,000,000 tons in 2010.
Exhaust gas
Industrial parks eliminate pollutants every day to the air, e.g dust, SO2, SO3, NOx, CO, VOC. Surveyed pollution factor at some industrial parks e.g. Bien Hoa, Suoi Dau, Hon Kho (Nha Trang), etc. shows 4.9 tons of dust/year, 12.6 tons of SO2/ha/year, 1.7 tons of NO2/ha/year; based on this, it is estimated that air pollution at the industrial parks in the Mekong delta by 2010 shall be 17,150 tons of dust, 44,100 tons of SO2, and 5,950 tons of NO2 per year.
In general, Environmental change tendency in the Mekong Delta is very much subject to the collection possibility and the intensity of treatment of domestic and industrial waste before they are discharged to the environment. In general, however, the current rapid speed of population increase and the development of different industries results the increase of waste volume and the degradation of environment in urban area since the management and treatment capacity of relevant authorities cannot keep pace with such development.
Prediction of environmental development in other different areas
In agriculture
The requirements of intensive farming, crop increasing, plan diversifying are increasing in the Mekong Delta. Fertilizers and pesticides are more and more used. Due to the variety of pesticides on the market (about 735 products), it is very difficult to manage the forbidden or limited to use, including high toxic and difficult to degrade products. Those still exist on the market. Besides, due to uncontrolled spraying pesticides, the number of people is influenced of poisons by eating agricultural products content residual of pesticides may possible increasing in coming years.
The rice monoculture and using new variety of rice with high yield and short growing life will lose the old variety with positive characteristics and suitable for the natural condition in the Mekong Delta such as the capacity of standing in the condition of inundation, acid sulphate soil, salinity soil, draught, …
The development of breeding in coming years will increase the volume of waste, causing adverse impacts on water and air environment, especially in flooding season. It is estimated that till 2010 the waste from breeding discharge to the environment will be 220,000 tons/day if it is not collected and treated. Besides, the waste also generates from the epidemic and dead animals.
Because of speed up industrial raising fish and shrimp for exportation, the area and yield for them will be increasing. The environment concerns:
- Increasing water pollution in ponds, lakes, fields due to excess food, pesticides, … - Increasing catching disease capacity of fish and shrimp due to pollution environment - Exhaustion of aquatic products due to catching fish by batteries, nets, mines, …
In coastal area
The coastal area is the area with potential of forest exploitation and aquaculture, therefore recent years it’s exploited without organizing and planning. This area is more and more suffered negative impacts on the environment. Due to the construction of beach dykes crossing the mangrove forest, the mangrove forest inside the dyke has disappeared and that outside the dike has degraded, such as in Ben Tre, Tra Vinh, Ca Mau and Kien Giang provinces. The structures for freshenization in the coastal area besides bring positive impacts, they cause adverse effects on the environments, and the results of observation shows that:
- Contamination of water in dry season because of closing of salinity prevention sluices - Setting obstacles to the migration of shrimp and fish, causing decline of aquatic products
- Setting obstacles to the transportation of fresh water, sediments, and nutrients … impacts on the balance of mangrove forest ecosystem.
Mangrove forest is the receiving of most pollutants from the upstream. Increasing utilization of agricultural chemical, increasing of industrial activities in the upstream will increase toxic substances for the mangrove forest.
In flooding area
All the areas in side the dyke, therefore, seriously contaminated with organic matters and microorganisms, lacking of clean water for domestic use, in addition domestic wastewater has not treated, no way to escape and stagnant for 5 months long of the flood season. This is the cause for many waterborne diseases.
The inhabitant areas have not yet been planned with landfields or dumping grounds. The waste from breading farm, pigsties, and houses without collecting and treating is dumped directly to canals, rivers. The environment in this encirclement conditions will be more and more degraded.
Due to flood prevention of the Government, the people’s levies are safer in the flooding area, more land for cultivation; the population in the flooding area will increase. As consequence, domestic waste, agricultural waste and chemical using for agriculture will be increased unless suitable management measures supported.
Environmental development due to impacts of flood protection structures
The flood protection structures have positive impacts on the flooding areas: decreasing area and time of flood, increasing agricultural productions. However, construction activities and operation of those flood protection structures is one of the reason causing changes of environment in the whole regions. The potential environmental changes have been predicted as follows [3]:
Direct impacts:
- Lower level of flood but flooding time longer in the downstream
- Increasing the dangerous level about human and property if those structures or the flood control measures are not meet the capacity requirements.
- Enrichment for ground water
- Significant impacts on aquatic source of income due to disordering their migration routine (because of salinity prevention sluice), damage habitat and water quality changes … resulted in decreasing yield at the river mouth, at shore and sea production.
- The impacts due to flood drainage canal excavation: disordering habitat, narrowing flooding area, increasing water temperature due to clearance of bank vegetation, increasing soil erosion and sedimentation, increasing flood in the downstream.
- Changing the ecosystem, decreasing agricultural development projects needing irrigation water - Setting obstacles to wildlife
- Increasing salinity intrusion in dry season due to no reserved water in the depression to push salinity water out.
Indirect impacts:
- Improving transportation, increasing development opportunities in the flooding areas and feeling safety of living with flood protection structures. Those resulted in increasing population, infrastructures, agricultural production, deforestation, encroaching on wildlife, …
- Increasing utilization of fertilizers to compensate losing soil nutrients, increasing water contamination and depending on importing productions.
CONCLUSION AND RECOMMENDATION
Conclusion
Vietnam is directed toward sustainable development, and if she accepts the viewpoint of sustainable development, she should consider 3 factors: economic, society, and environment. Vietnam has its important role in international integration into environmental protection, taking part in most international Conventions and Agreement on environmental protections.
Mekong Delta has very important role in the industrialization and modernization of Vietnam. Company with socio-economic development the environmental protection should be in concern. The pressing environmental issues need to be integrated management in the Mekong Delta are:
- Degradation of natural wetland ecosystem - Environmental issues due to flooding - Salinity intrusion, acid soil and water
- Bank erosion, sedimentation in estuaries and coastal area
- Pollution due to wastewater, solid waste, dust, noise, … in the urban areas
- Pollution due to industrial waste from industrial zones, the industries of medium and small scales - Pollution due to waste in the rural areas, and fertilizers, pesticides, …
Recommendations
- The people’s committee of provinces in the Mekong Delta should plan to invest for environmental improvement and protection for areas with severe pollution and degradation.
- The Government should promulgate policy and mechanism aiming at drawing investment and mobilizing capitals from different sources for environmental protection activities.
- Accomplishment of organization mechanism for environmental management from national level to local level. Strengthening human resources and investment on equipment for environmental monitoring, controlling and coerce to comply with environmental protection laws.
- Raising awareness on environmental protections for different classes: managers, peoples, teenage, and children. For sustainable development in the Mekong Delta, sustainable development of agriculture – and rural development the following factors should be ensured [8]:
- Rural economic growing should be 3 times higher then the population increasing in the regions. - Income of each farmer should be over the poverty line
- Changes in socio-economic should create jobs for people, especially women.
- The cultivated system should protect soil, surface and ground water and gene of plan variety
- Production technology and production organizing form should be suitable to infrastructures, finance capacity of the Government and farmers, appropriate to education level and customs belief of farmers. - Economic associate with reinforcement of national defense and national security.
Study and research are required for mitigation solutions to respective areas. However, development of production and infrastructure in accordance with relevant planning shall also be one method contributing to forest and water resources protection, reducing causes of pollution particularly to the coastal and floodplain areas where millions of people are settling and earning their living.
REFERENCES
[1] “Overview of Vietnam”, The Publishing House of Statistics, 1999.
[2] Center for Environmental Technology (ENTEC), “Study on the surveys and assessment on environmental pollution and degradation in the Mekong delta due to industrialization and modernization, serving as a basis for sustainable socio-economic development”, Ho Chi Minh City, 2000.
[3] Hoang Khanh Hoa, Le Trinh, “Environment changes due to urgent flood control structures in the Mekong delta”, Interim report of a national level research X 07-03-02, 1998.
[4] Institute for Agricultural Planning and Design, “Report on changes of structure and land use for agricultural, forestry and aquaculture farming development in the Mekong delta”, March 2003.
[5] Ministry of Planning and Investment- Center for Southern Economic Research, “Consolidation report on master plan for socio-economic development of the Mekong delta in 1996-2010”, 1996. (Approved on 5/11/1998 by the Prime Minister).
[6] Southern Institute for Water Resources Research, “Study on environmental changes due to the implementation of socio-economic development planning and proposed solutions in the Mekong delta (Research 07 – 03)”, June 2001.
[7] The Communist Party of Vietnam, “Document of National Delegation Congress IX”, the Publishing House of National Politics, Hanoi 2001.
[8] Tran Vo Hung Son et al, “Economic surveys, analysis and assessment on economic structure changes for the floodplain of the Mekong delta”, The first scientific seminar- an independent research of national level: Status and solutions for issues on socio-economics and environment of the floodplain area in the Mekong delta, HCMC, December 1999.
[9] Vietnamese Standards, “Standards of Vietnam Government on environment – volume 1: water quality”. Hanoi 1995
CANAL WATER POLLUTION OF CAN THO CITY IN THE MEKONG DELTA
É
DAC, NGUYEN TAT
Sub-Institute for Water Resources Planning 271/3 An Duong Vuong, Dist. 5, Ho Chi Minh City,Vietnam
TRINH, LE
Vietnam Environment and Sustainable Development Institute 8 Mac Dinh Chi str., Dist. 1, Ho Chi Minh City, Vietnam
ABSTRACT
Located on the Bassac River’s bank, Can Tho is a City newly established on the basis of the same town. Crossing by a dense canal network, Can Tho is facing on water pollution problem due to domestic sources and industrial zones newly constructed. Using modelling approach it is presented in this paper the current situation of water canal pollution. The near future of this pollution picture is also predicted based on planning development activities.
INTODUCTION
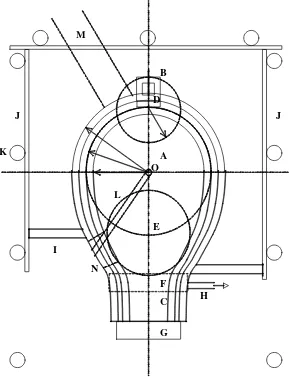
Located on the Bassac River’s bank, Can Tho is a City newly established on the basis of the same town and has been considered as the Capital of the Vietnam Mekong Delta . It consists of 4 districts, namely, Ninh Kieu, O Mon, Binh Thuy, Cai Rang, and all locate along the Bassac and Can Tho Rivers’ banks. Population of the City is estimated of 548,220 in 2005 and 971,200 in 2010, respectively. The City is crossed by a dense network of creeks and canals (see figure 1), such as Binh Thuy, Cai Khe, Khai Luong, Tham Tuong where waste water is directly discharged to.
Figure 1: a) Can Tho area location map b) Schematization of Can Tho area in computation Based on survey and statistical data, it is seen that waste water come mainly from domestic, fish and food processing, brewage, drug, hospital, fertilizer sources. As a newly established city and with rapid growth of population, drainage as well as sewage has become great concerns of authority. In addition, rapid urbanization in recent years brought about damages and overload to drainage and sewerage facilities, causing serious urban inundation along with water pollution. Therefore, water quality in Can Tho City is one of the most serious environmental issues, particularly in relation to development activities of the city.
With the purpose to identify water pollution issues and impacts of development scenarios of the city serving for EIA , a study using mathematical model on hydraulic regime and water pollution status was carried out [2].
R.Bình Thuyû
R.Caùi Kheá R.Traø Noùc
Soâng Caàn Thô
Bassac River
A
B P U
Q Khai Luoâng Creek
NN N C R M V L K D
S E
F
T
It is seen that all canals of Can Tho area are conneced to the Bassac River and all are strongly affected by semi-diurnal tide from the South China Sea. During a day there are two times when water level reaches highest and lowest values (see figures 2a and 2b for discharge). When tide changes the direction flow velocity becomes relatively zero, and consequently polluted water can not be diluted or spreads to other area. Water becomes more polluted during ebb tide and more clean during spring tide.
Figure 2: a) Discharge at point D on the Bassac River (April); b) Discharge at point E on the Can Tho River (April)
Based on scheme of drainage pipeline system of the city, discharging points of wastewater are mainly located along the Can Tho River (from E to F on fig. 1b), the Cai Khe creek (from N to K), the downstream part of the Khai Luong creek, between A and B on the Bassac River, and from S to T on the Tham Tuong creek (see fig. 1b). Due to organic materials is dominant in the wastewater; BOD5 was used as indicator for canal water pollution. The water
quality model [1] briefly illustrated in below appendix was used for BOD computation. Scenarios in simulations
It is given in table 1 data corresponding to five scenarios used in simulation: Scenario No.1 denoted by PA_2005: the current status of wastewater in 2005 Scenario No.2 denoted by PA_2010: wastewater status estimated for 2010
Scenario No.3 denoted by XL100: wastewater status estimated for 2010 with primary treatments of sources in order BOD5 in all sources are less than 100mg/L.
Scenario No.4 denoted by XL50: wastewater status estimated for 2010 with full treatments of sources in order BOD5
in all sources are less than 50mg/L.
Scenario No.5 denoted by PA_2020 : wastewater status estimated for 2020 with primary treatments of sources in order BOD5 in all sources are less than 100mg/L and with load increased at 1.5 times compared to that of 2010.
Table 1: data for five scenarios in simulation
Load (m3/d) BOD mg/L Load (m3/d) BOD mg/L Load (m3/d) BOD mg/L Load (m3/d) BOD mg/L Load (m3/d) BOD mg/L
Can Tho River 4964 430 6658 378 6658 100 6658 50 9987 100
Cai Khe Creek 15367 354 20060 299 20060 100 20060 50 30090 100
Th. Tuong Creek 3088 439 3800 384 3800 100 3800 50 3800 100
Khai Luong Creek 3264 151 3984 163 3984 100 3984 50 3984 100
Binh Thuy Creek 3264 84 3984 84 3984 84 3984 50 3984 84
Tra Noc Creek 13337 84 21481 84 21481 84 21481 50 21481 84
Bassac River 14748 120 38896 120 38896 100 38896 50 38896 100
XL50 PA_2020
Scenarios
PA_2005 PA_2010 XL100
-8000 -6000 -4000 -2000 0 2000 4000 6000 8000 10000
1 41 81 121 161 201 241 281 321 361 401 441 481 521 561 601 641 681
Hours Q ( m 3 /s ) -1000 -800 -600 -400 -200 0 200 400 600 800 1000 1200
Due to tidal variation, computed BOD is seen oscillation with time as seen in figures 3 a, b.
Figure 3: a) Variation of BOD at point A on the Bassac River and b) at point E on the Can Tho River
Simulations of the dry season are carried out with hydraulic data of 2000 and river water can be considered clean if BOD5 in river water is less than 5mg/L. For simulation purpose the hydraulic schematization covers the whole delta
but only rivers and canals of Can Tho area are received polluted wastewater.
It is noted that due to variation in time of BOD only maximum and average values are used to estimate pollution status of river water. Table 2 below shows results of computed BOD corresponding to five mentioned scenarios.
Table 2: Computed BOD max (BODmax) and BOD average (BODbq) corresponding to 5 scenarios
Unit mg/L
River LocationBODmax BODbq BODmax BODbq BODmax BODbq BODmax BODbq BODmax BODbq
A 8.24 5.1 8.02 5.02 7 4.61 5.14 3.9 7.02 4.63
501 11.98 5.68 15.57 5.52 13.05 4.96 6.82 4.06 13.06 4.99
504 10.55 6.29 7.63 5.74 6.54 5.04 5.12 4.1 6.56 5.08
C 18.09 6.99 10.07 5.97 6.74 5.14 5.17 4.14 6.79 5.18
D 12.28 6.93 8.56 5.98 6.44 5.14 5.01 4.14 6.46 5.18
R 11.84 5.52 11.35 5.48 6.88 4.76 5.16 4 6.89 4.78
S 56.83 8.54 43.86 8.66 23.16 5.69 23.16 4.43 23.16 5.71
T 30.31 7.79 24.68 7.67 15.02 5.47 15.02 4.34 15.02 5.5
U 22.29 8.11 14.18 6.52 8.14 5.33 6 4.23 8.17 5.36
6447 28.3 10.99 18.2 7.78 9.9 5.82 6.14 4.45 9.92 5.85
6448 39.23 13.86 31.78 9.34 13.74 6.4 7.44 4.71 13.76 6.44
6449 47.6 17.28 23.92 8.82 11.27 6.2 6.46 4.62 11.3 6.24
V 29.71 12.27 26.63 7.7 11.82 5.78 6.49 4.43 11.83 5.82
Scenarios PA_2005 PA_2010 PA_XL100 PA_XL50 PA_2020
Bassac River
Tham Tuong Creek
Khai Luong Creek
3 3.5 4 4.5 5 5.5 6 6.5 7 7.5 8
1 26 51 76101126151176201226251276301326351376401426451476501526551576601626651676701
Hours
BO
D (
m
g
/L
)
4 5 6 7 8 9 10 11
1 40 79 118 157 196 235 274 313 352 391 430 469 508 547 586 625 664 703
Hours
BO
D
(
m
g
/L
Table 2 (continued)
River LocationBODmax BODbq BODmax BODbq BODmax BODbq BODmax BODbq BODmax BODbq
K 21.9 9.2 24.07 8.88 10.73 6.01 8.52 4.54 12.62 6.45
6411 22.16 9.94 24.52 9.79 10.86 6.28 8.39 4.66 12.78 6.85
6412 22.75 10.43 25.39 10.37 11.08 6.46 8.02 4.74 13.07 7.1
6413 23.51 10.88 26.52 10.93 11.33 6.63 7.93 4.82 13.39 7.34
L 25.74 11.22 28.95 11.37 11.96 6.76 8.03 4.88 14.45 7.53
6415 27.04 11.39 30.8 11.58 12.5 6.82 7.52 4.91 15.17 7.62
M 27.69 11.41 30.8 11.61 12.49 6.83 7.47 4.91 15.16 7.63
6417 26.63 11.23 28.92 11.48 12.07 6.79 7.39 4.89 14.34 7.57
N 25.47 11.05 26.77 11.27 11.45 6.72 7.15 4.86 13.48 7.48
6419 22.86 10.8 23.72 11.03 10.66 6.65 6.96 4.83 12.59 7.38
6420 20.67 10.64 22.39 10.92 10.25 6.61 6.82 4.82 12.04 7.33
6421 19.46 10.55 21.18 10.88 9.87 6.6 6.71 4.81 11.53 7.31
6422 18.82 10.49 20.05 10.89 9.5 6.6 6.61 4.81 11.04 7.31
6423 18.28 10.44 19.33 10.9 9.28 6.6 6.53 4.81 10.8 7.32
6424 17.79 10.4 18.71 10.91 9.19 6.61 6.46 4.82 10.68 7.33
6425 17.46 10.36 18.48 10.91 9.12 6.6 6.41 4.82 10.59 7.32
6426 17.33 10.31 18.33 10.89 9.07 6.6 6.37 4.81 10.53 7.31
6427 17.23 10.26 18.23 10.86 9.04 6.59 6.32 4.81 10.48 7.3
6428 17.13 10.21 18.12 10.82 9.01 6.58 6.28 4.81 10.44 7.28
6429 17.02 10.14 18 10.76 8.98 6.56 6.25 4.8 10.39 7.26
6430 16.9 10.07 17.86 10.69 8.93 6.54 6.22 4.79 10.34 7.23
6431 16.78 9.97 17.72 10.59 8.89 6.51 6.2 4.78 10.28 7.19
6432 16.66 9.87 17.55 10.47 8.84 6.47 6.18 4.76 10.22 7.13
6433 16.52 9.75 17.36 10.34 8.78 6.43 6.15 4.74 10.14 7.07
6434 16.36 9.61 17.12 10.18 8.71 6.38 6.13 4.72 10.04 7.01
6435 16.16 9.47 16.85 10.02 8.63 6.33 6.1 4.7 9.94 6.94
6436 15.95 9.32 16.55 9.84 8.54 6.28 6.08 4.68 9.82 6.86
6437 15.71 9.17 16.22 9.66 8.44 6.22 6.05 4.65 9.69 6.78
6438 15.47 9.01 15.91 9.47 8.35 6.16 6.03 4.63 9.57 6.7
6439 15.23 8.84 15.59 9.27 8.25 6.1 6 4.6 9.44 6.61
NN 13.17 6.09 13.55 6.12 7.73 5.03 5.37 4.12 8.67 5.17
1986 9.28 6.17 7.25 5.65 5.84 4.98 5.14 4.08 5.87 5.02
1987 7.63 5.12 7.8 5.02 6.85 4.61 5.16 3.92 6.86 4.63
Cai Khe Creek
Scenarios PA_2005 PA_2010 PA_XL100 PA_XL50 PA_2020
Table 2 (continued)
River LocationBODmax BODbq BODmax BODbq BODmax BODbq BODmax BODbq BODmax BODbq
E 10.7 7.14 11.31 6.33 6.5 5.21 5.3 4.17 6.78 5.29
2005 10.83 7.25 11.61 6.52 6.67 5.25 5.31 4.19 6.96 5.35
2006 24.3 7.37 22.06 6.72 8.6 5.3 5.32 4.21 9.37 5.42
2007 11.99 7.43 11.74 6.83 6.71 5.33 5.34 4.23 7.05 5.46
2008 12.14 7.42 13.25 6.84 6.73 5.33 5.37 4.23 7.