ISSN 0097-8078, Water Resources, 2015, Vol. 42, No. 5, pp. 735–746. © Pleiades Publishing, Ltd., 2015.
735
1 INTRODUCTION
Regions with water deficiency (in various fields of life support) become widespread in the world. This deficiency may be due to either natural causes (low precipitation, river runoff, or groundwater reserves) or social factors (rapid population growth, economic development in a particular territory). In the latter case, the shortage of water resources in different terri-tories demonstrates some common features [2, 11]:
a high population density in the urban agglomera-tion;
the active use of both surface and subsurface water; pollution of both surface water and groundwater; regulation of river flow and water transfers.
The main principles of water management under its deficiency are well known: (1) water saving, that is, its most efficient use for any purpose; (2) taking mea-sures to reduce water pollution; (3) the use of water recycling technologies. As a rule, management units are water basins. Most water laws are based on the so-called “basin principle” [31, 32]. In the case of water resources management of large rivers subjected to a high anthropogenic impact, the basin principle is the only possible control mechanism. Here, the water management comprises evaluating water and pollutant
1The article is published in the original.
balances for major water users. The result of these cal-culations is the choice of measures to optimize water use. These measures are aimed to ensure that water resources are used within the balance considered as optimal.
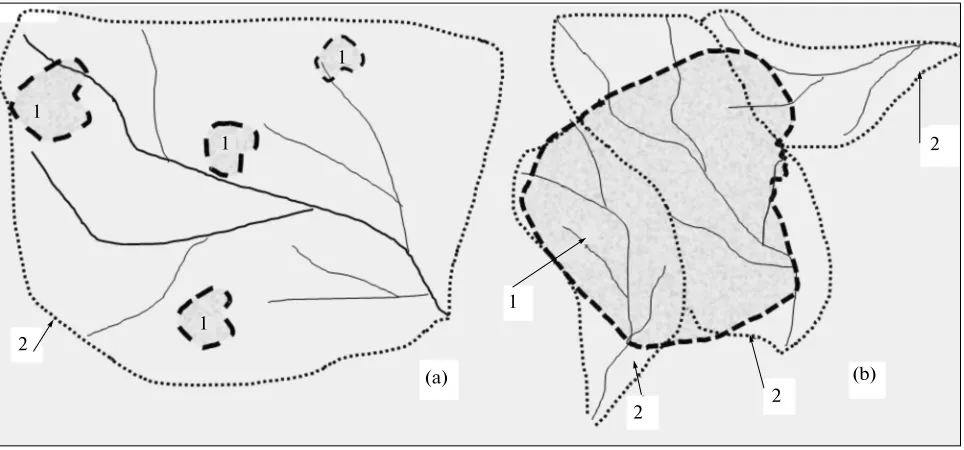
The space distribution of the load on water bodies is extremely heterogeneous. There are zones of maxi-mum load (intensive water consumption, water pollu-tion by effluents) and areas with nearly no load. We can distinguish two types of impacts on river basins by the ratio of the size of the object (the source of high anthropogenic impact) and the size of the basin: (1) the size of the river basin is much larger than the object of high anthropogenic influence (urban settle-ments, agricultural irrigated land, industrial facilities); (2) the objects of high anthropogenic influence include several river basins or their size is comparable with basin area, and/or river cannot ensure water con-sumption of some settlements within the basin (Fig. 1).
Island Bali (Indonesia) and the Moscow Region (including Moscow and Moscow oblast) are referred to the second type. In both cases, there are a large urban agglomeration (Denpasar City and Moscow, respectively) and large water consumers, in addition to residents: agriculture in Bali and industry in the Mos-cow Region. Both regions use rivers as water sources (the Moskva River and rivers in Bali). In their natural
Analysis of the Specifics of Water Resources Management in Regions
with Rapidly Growing Population under Different Climate
Conditions: Case Study of Bali Island and the Moscow Region
1I. Nyoman Raia
, S. Shobab
, N. Shchegolkovac
, R. Dzhamalovc
, E. Venitsianovc
,
I. Gusti Ngurah Santosaa
, Gede Menaka Adnyanaa
, I. Nyoman Sunartaa
, and I. Ketut Suadaa
a Udayana University, Bukit Jimbaran, Bali, 80361 Indonesia b Moscow State University, Moscow, 119991 Russia
c Water Problems Institute, Russian Academy of Sciences, Gubkina 3, Moscow, 119333 Russia E-mail: [email protected], [email protected]
Received March 3, 2015
Abstract—The paper analyzes long-term consumption dynamics of surface water and groundwater in two different regions of the world, namely the current structure of water consumption and its change over the past decade, as well as forecasts of water consumption in the future. Changes in water resources of Bali and the Moscow Region, depending on water consumption, are illustrated based on long-term datasets. The specifics of water consumption in each of the two regions were characterized, and the effectiveness of the measures reg-ulating the amount of water in the regions was estimated. The paper provides the general principles and spe-cific recommendations for solving the problem of water deficiency in both regions.
Keywords: water consumption, water deficiency, rapid population growth DOI: 10.1134/S0097807815050127
736
WATER RESOURCES Vol. 42 No. 5 2015
NYOMAN RAI et al.
state, these rivers cannot meet the historically formed water demand. There is a rapid population growth in both regions (including immigrants). For a long time (more than 100 years), both regions have been suffer-ing periodic water deficits: these were water shortages for the agriculture and population during the dry sea-son in Bali, and for the growing population and indus-try in the Moscow Region (before water transfer from the Volga River).
In Bali, this problem was solved as early as the first millennium A.D., by creating a unique system of river water redistribution. Rivers that direct from the center of the island to the ocean were combined in a canal system enabling effective reallocation of water between individual agricultural consumers, including water transfer from one river basin to another. The water system, which was reliably working for two mil-lennia, is spontaneously degrading now. Researchers from different countries have been studying this sys-tem, called Subak [18, 19, 21, 24, 29, 30, 34]. The Subaks of Bali is one of the best examples of user-based allocation. The discovery of the sophistication of these systems provided the basis for some early chal-lenges to assumptions that the governmental manage-ment of irrigation was necessary [6, 35]. These irriga-tion associairriga-tions have developed and constructed their own irrigation systems with very little external assis-tance. The systems have been sustained over time by elaborate management rules and practices that specify obligations of each member in terms of labor and cash contributions for operation and maintenance, includ-ing periodic rehabilitation. A key feature of the Subaks is the “tektek” principle of proportional water alloca-tion to each individual member. The tektek shares are
based on a proportion of flow through diversions structures. There is a strong emphasis on equity, so that allocation takes into account the farmers' role in the association, the distance from the intake, the initial investment, soil conditions, and transfers of water rights among members. The systems also exhibit a high degree of flexibility and responsiveness to negotiations among members. Balinese Subaks have several advan-tages, which contribute to their effectiveness, and the sustainability of the institutions for user-based alloca-tion over time [3].
As for the Moscow Region, water scarcity for the industry and households has been occurred since the 1920–1930s due to the rapid growth in the urban pop-ulation and industrial development. In the same period and earlier (since the early 20th century) the Moskva River showed unsatisfactory ecological condi-tions due to large amounts of untreated sewage it received. The cause of water deficiency was the loca-tion of an intensive growing metropolis on a river with a moderate runoff. It is worth noting that the Moscow Region traditionally used groundwater for domestic needs, while Moscow preferred surface water. Since the 1930s, Moscow has been using water reservoirs, which accumulate water of two rivers—the Volga and the Moskva. The transfer of river water from the basin of another river (the Volga) solved not only the prob-lem of water supply to the population and industry, but also the problem of increasing the Moskva River run-off to improve its ecological conditions. Before the construction of the Moscow water supply system, the drainage basin of the Moskva River was as little as 8000 km2. The construction of the system increased the basin area sixfold. Nowadays the drainage area of 1
2
(a) (b)
2 2
2 1
1
1
1
WATER RESOURCES Vol. 42 No. 5 2015
ANALYSIS OF THE SPECIFICS OF WATER RESOURCES MANAGEMENT IN REGIONS 737 the Moscow water supply system, located on the
terri-tory of Moscow, Smolensk, and Tver regions is about 50000 km2 [8]. Thus, the scarce water resources were replenished by the resources of the neighboring Volga basin. The natural–technogenic water system in the Moscow Region has been operating for over 50 years.
At present, the structure of water use in both regions is expected to change: the number of tourists increases in Bali, and Moscow borders are expanded (the area of the capital increased by 2.5 times). The choice of the optimal scheme of water use requires a comprehensive study of the long-term dynamics of water consumption.
We have analyzed the structure of long-term dynamics of water use in both regions. For Bali, we used data obtained from the Statistical Office of Bali, reports of Environment Management Agencies, reports of the Department of Agriculture and other agencies [1, 4, 5, 12, 33]. For the Moscow Region, we used statistical data of Rosstat [9], data of MPUE “Kanal imeni Moskvy”, and a database of JSC Mos-vodokanal [21].
Data on rainfall and evaporation for Bali were obtained from materials of BPS Provinsi Bali (1995, 1995–1999, 2014) [1], and for Moscow, from Davydov et al. [8], papers [16, 17] and the Internet resource of Geocenter Moskva [10]. The available surface water resources were evaluated based on the total river flow (in Bali) and the runoff of the Moskva River at its mouth (for the Moscow Region).
Irrigation water consumption in the Moscow Region was evaluated proceeding from 550700 ha of sown areas, 5% of which are irrigated [9]; the irriga-tion rate was assumed 1000 m3/ha. Water use by indus-try in the Moscow Region is calculated for the most water-intensive industrial sectors (the production of cement and reinforced concrete structures and power generation at TPP), according to Rosstat data. Spe-cific water consumption rates per production unit were used [13, 20].
GEOECOLOGICAL FORMATION CONDITIONS OF THE VOLUME AND QUALITY OF WATER RESOURCES
Bali
The main factors that govern the formation of water resources of the island are (1) tropical marine climate with pronounced seasonal rainfall: a wet period from October to March and a dry period from April to Sep-tember; (2) hydrogeological characteristics: a very high permeability of fractured rock and the absence of aquicludes, i.e., groundwater is genetically uniform over depth; (3) the heterogeneity of rainfall over the territory; the rainfall in different parts of the island varies from 1700 to 3300 mm/year, the amount of pre-cipitation tends to be higher in the central part of the island and lower on the coast.
Water resources of the island are composed of sur-face waters (rivers, canals, and lakes) and groundwater. About 162 rivers and streams flow from the center of the island to the ocean, some of them originating in the three largest lakes of volcanic origin, located in the central highlands of the island. The total volume of these lakes (Buyan Lake, Beratan Lake, and Tamblin-gan Lake) is about 0.2 billion m3, and the water yield of lakes is more than 0.3 billion m3/year.
Groundwater supplies are 0.54 km3/year, and the runoff of rivers and canals are 4.43 km3/year.
The major aquifers in the Southern Bali include a Pliocene lower calcareous sequence and a Quaternary upper volcanic sequence. Both exhibit rapid lateral and vertical facies changes, and hence their hydrogeo-logic parameters are highly variable. Yields of up to 90 L/s are known from the calcareous system and up to 60 L/s from the volcanic formations. A model for recharge was prepared [23], using all relevant available soil, land use, hydrogeological, and meteorological data for calibration. The annual recharge for different soils was 308–605 mm in a medium-rainfall year and 267–481 mm in a dry year.
According to Nielsen et al. [23], the piezometric surface of the Southern Bali (where groundwater is most intensively consumed) is very heterogeneous. The depth of groundwater table in wells is less than 10 m in the coastal area near the ocean, 30–75 m near the city of Denpasar, and up to 300 m and more in the central part of the island.
The irregularity of rainfall during the year deter-mines the temporal heterogeneity in the amount of water (Fig. 2), consisting of surface water and ground-water. The fractured rocks determine a direct relation-ship between the groundwater level and the amount of precipitation: the levels and consumption of ground-water significantly decrease in a dry season. The differ-ence in water resources between seasons reach ten times (Fig. 2).
The main sources of water pollution are domestic wastewater, sewage of agricultural enterprises, live-stock waste, tourist and shopping complexes, diffuse runoff from agricultural fields, as well as from illegal dumps. In 2006 I. Ketut Sundra [33] found a high con-tent of organic matter (BOD and COD), nitrogen compounds, suspended solids, and bacteria in groundwater in the Southern Bali. The water extracted from wells in the areas near the ocean in most cases is salty or brackish because of seawater intrusion.
738
WATER RESOURCES Vol. 42 No. 5 2015
NYOMAN RAI et al.
Moscow Region
The natural conditions that affect the formation of regional water resources are the temperate continental climate, the hilly-plain relief, the hydrogeological structure with pronounced aquicludes and aquifers. The distribution of precipitation over the year (com-pared with Bali) is nearly uniform with an average of 40 to 90 mm per month. The average annual precipi-tation rate over the past 20 years is 705 mm (with a minimum of 485 and a maximum of 885 mm per year). The region shows pronounced seasonal variations in air and water temperature (4 seasons) and river water flow (spring floods, winter and summer low water periods). All the rivers have steady flow, well-devel-oped valleys and floodplains; the spring flood takes place in April–May. The hydrographic axis of the region is the Moskva River. Before the construction of the Mozhaisk Reservoir, which flooded a part of its meandering riverbed, the river length was 502 km. Now it is taken equal to 473 km. Most of the rivers of Moscow oblast are tributaries of the Moskva River.
The Moskva River and its tributaries are the main resource of river water in the Moscow region for use. Therefore, the discharge of the Moskva River at its mouth is an integral characteristic of river water avail-ability in the region. According to reference materials at runoff modulus is 5.12 L/s km2 the annual runoff before the transfer of the Volga water was 89 m3/s, while in recent years, it averaged 199 m3/s. This was the basis for the calculation of water reserve of rivers under natural conditions (Table 1).
The largest reservoirs (or artificial water bodies) near Moscow were formed in the 1930s and 1960s. These include the Ozerna, Istra, Ruza, and Mozhaysk reservoirs in the Moskva basin, and reservoirs of the
Volga basin: the Ivankovo, Iksha, Pyalovskoe, Pestovskoye, Klyazma, and Ucha. The total useful volume of all constructed reservoirs is 2399 million m3. The main sources of water pollution are domestic, storm, and industrial effluents [26] and diffuse flow [14, 15]. As a result, many rivers in the region are mod-erately or heavily polluted. It is worth noting that groundwater is polluted in some areas of the Moscow Region with a high concentration of industry (the towns of Lyubertsy, Khimki, Elektrostal, Dzerzhinsky, and Schyolkovo). This is primarily due to contamina-tion introduced during water intake operacontamina-tion. About 80% of groundwater withdrawal takes place within industrial and residential areas, where the likelihood of aquifer contamination is maximal. The concentra-tions of ammonium, nitrates, and organic matter (COD) as indicators of anthropogenic stress are the highest in Balashikha, Lyubertsy, Lotoshinsky, and Lukhovitsy areas. For less urbanized regions of Mos-cow oblast, the industrial pollution of groundwater takes place when there are no impermeable layers overlying the aquifers. These conditions are typical of the Podolsk-Myachkovsky aquifer along the valleys of the Pakhra and Desna rivers.
Surface water quality within a year is determined by the following major factors: short-time pollution peak from diffuse runoff, intense self-purification of water bodies and streams in summer, the dilution of waste-water by receiving waste-water bodies, self-purification in wastewater discharge zones [27].
1600 1400 1200 1000 800 600 400 200
0 m3/s
Month
Jan Feb Mar Apr May June July Aug Sep Oct Nov Dec
1
2
3
WATER RESOURCES Vol. 42 No. 5 2015
ANALYSIS OF THE SPECIFICS OF WATER RESOURCES MANAGEMENT IN REGIONS 739
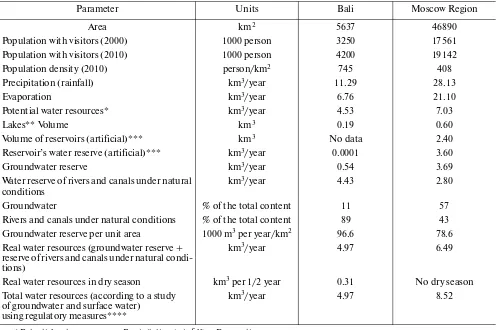
THE STRUCTURE OF WATER RESOURCES To assess potential water resources (PWR), avail-able in both regions, the following calculation was made:
PWR = (Precipitation – Evaporation) × Area. For Bali, we performed the separate calculation for dry period. The results are presented in Table 1. In addition to the calculated data, the table shows the values for available water resources taken from statisti-cal reference books and public sources [1, 4, 5].
It should be taken into account that the Moscow Region is greater than Bali in 8 times. However, poten-tial water recourses (as the difference between rainfall and evaporation) differ as little as 1.6 times. Moreover, real water resources according to the research of groundwater and surface water differ by 1.3 times.
The structure of the available water sources also differs: the proportions of groundwater resources for Bali and the Moscow Region are 11 and 57%, respec-tively. Groundwater reserves are proportional to the area of the regions as confirmed by hydrogeological surveys. Specific groundwater resources per 1 km2 are
almost the same for so different regions: 96.6 for Bali and 78.6 thousand m3 per year/km2 for the Moscow Region. While the difference in rainfall is 2.5 times, the groundwater reserves differ by less than 20% (which is within the error of experimental studies).
The volume of water resources (due to the expan-sion of water-economic system to another river basin) has increased by 1.3 times in the 1930s–1960s in the Moscow Region. In Bali, there are nearly no regula-tory mechanisms to create large-scale reserves of sur-face and rainwater.
WATER CONSUMPTION
Bali
There is a centuries-old water system of Bali. This system is degrading due to the intensive growth of water consumption and changes in its structure in the recent years. Bali is an island with an area of 5636.66 km2, one of Indonesian provinces. Bali popu-lation is about 3.7 million, taking into account consid-erable number of tourists. The increment of the total Table 1. Estimates of water resources structure in both regions
Parameter Units Bali Moscow Region
Area km2 5637 46890
Population with visitors (2000) 1000 person 3250 17561
Population with visitors (2010) 1000 person 4200 19142
Population density (2010) person/km2 745 408
Precipitation (rainfall) km3/year 11.29 28.13
Evaporation km3/year 6.76 21.10
Potential water resources* km3/year 4.53 7.03
Lakes** Volume km3 0.19 0.60
Volume of reservoirs (artificial)*** km3 No data 2.40
Reservoir’s water reserve (artificial)*** km3/year 0.0001 3.60
Groundwater reserve km3/year 0.54 3.69
Water reserve of rivers and canals under natural conditions
km3/year 4.43 2.80
Groundwater % of the total content 11 57
Rivers and canals under natural conditions % of the total content 89 43 Groundwater reserve per unit area 1000 m3 per year/km2 96.6 78.6 Real water resources (groundwater reserve +
reserve of rivers and canals under natural condi-tions)
km3/year 4.97 6.49
Real water resources in dry season km3 per 1/2 year 0.31 No dry season Total water resources (according to a study
of groundwater and surface water) using regulatory measures****
km3/year 4.97 8.52
* Potential water resources = Precipitation (rainfall) – Evaporation. ** Buyan Lake, Beratan Lake, Tamblingan Lake.
740
WATER RESOURCES Vol. 42 No. 5 2015
NYOMAN RAI et al. population (including tourists) from 2000 to 2010 was
more than 350000 [4]. Bali population is mostly increasing due to the tourism sector. More than 300000 tourists stay in Bali nowadays. This number reaches above 400000 tourists in some seasons.
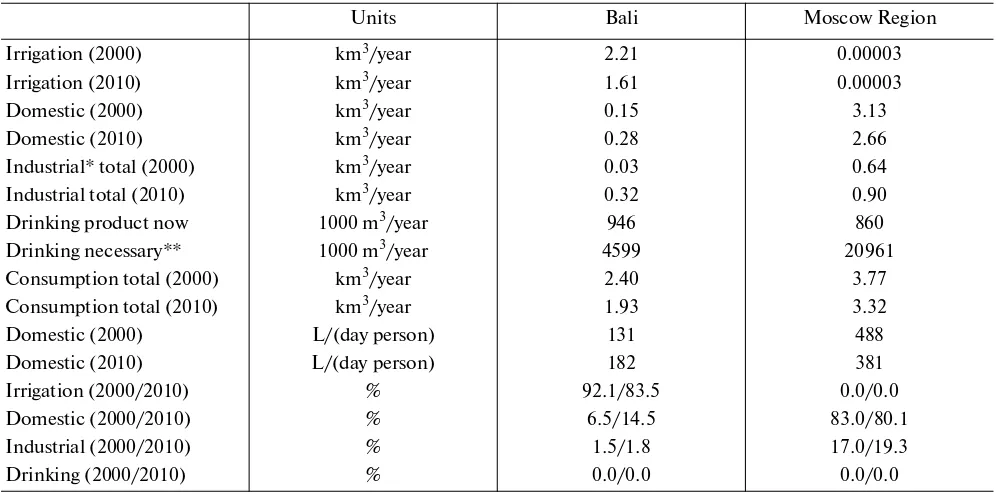
The structure of water consumption for the main expenditure items in the recent years (2010) is: irriga-tion – 79.7, domestic water – 17.8, industrial water (including tourist business, education facilities, healthcare, hotels and restaurants, ports and airports, sports and general, livestock and fisheries) – 2.2, bot-tled drinking water – 0.02%.
The main water consumer is agriculture. From the earliest times in Bali, water resources have been allo-cated based on social criteria—maintaining the com-munity by ensuring that water is available for human consumption, sanitation, and food production. The Indonesian island of Bali is famous for its unique sys-tem of irrigation. Guided and informed by religious values, it combines impressive feats of engineering with complex and elaborate social structures. Most of 162 large streams and rivers that flow from Bali’s mountainous interior have cut deep channels into its soft volcanic rocks. This has made impossible for farmers to dam and channel water for irrigation in the usual way. Therefore, they constructed elaborate aque-ducts and bamboo piping systems to carry water to the top of terraced rice fields. From here it can flow, with gravity, from field to field. Community organizations, called Subak, control the water irrigation system to ensure reliable, fair, and equitable distribution. Besides its technical functions, the Subak also pro-vides social benefits including strengthening the possi-bilities of its members to maintain social contacts. Community groups and group activities are tradition-ally very important in the Balinese society. They reflect the significance attached in Hindu philosophy to the relationships an individual has with other members of the society. This is a highly valued principle particu-larly in a rural society. Bali’s famous Subak system is one of the most vital components of the Balinese soci-ety. Built over the course of several centuries, Subak system remains an integral part of Balinese life and is a product of the island’s history and culture. The exist-ing subaks in Bali number 1583 unit organizations which cover an area of about 81744 ha [30].
The average area of Subak is about 52 ha. The channel system for supplying water is constructed in such a way that all facilities are supplied with water alternately in accordance with agreements inside the system. As it was mentioned, the channel system can redistribute water between Balinese river’s basins. It should be noted that almost all the plains and foothills, where it is possible to place terraced fields, participate in agricultural production. The population density in Bali is high. On the average it is 700 person/km2, but for different regencies it varies from 310 (in Jembrana) to 6400 person/km2 (in Denpasar Regency).
Now water supply in Bali is limited, and water defi-ciency is expected to decrease due to the pollution of natural waters. Meanwhile, water consumption will grow rapidly because of population growth and the development of tourist industry. Thus, the imbalance between water supply and water demand will increase [24, 28]. There were officially fixed periods of acute water deficit for the population (in 1997 in the regen-cies of Badung and Denpasar, in 2007 in Gianyar and Tabanan).
Water shortage leads to lower crop yields, resulting in a decline in food production and employment of the population. In addition, the domestic water deficiency has a negative impact on the tourism business through the increasing morbidity [34].
The total current water consumption (in 2010) is 1567.14 million m3/year. The main consumers are agriculture—1247.16, the domestic sector—279.1, and the tourist industry—34.86 million m3/year (Table 2).
The one of the structural features of water con-sumption in Bali Island is the small specific (per cap-ita) water consumption in the domestic sector (131– 182 L/day person), which is in 2 times less as com-pared to the Moscow Region (Table 2). Currently Bali is on the stage of increasing individual household con-sumption, similar to one that was in the Moscow Region in the middle of 20th century. At that time, this growth had resulted in excessive consumption, which required taking special measures later.
The second feature of the region is the consump-tion of treated water from a reservoir, which was cre-ated by a dam in the estuary of one of the rivers. Clean-water demand is increasing continuously, responded by the Regional Water Company by utilizing the exist-ing wastewater from the Badung River, known as Estu-ary Dam. The long-term program is aimed to increase the water flow to the southern part of Badung Regency (Bukit Jimbaran). The growing local population and the number of tourists in Bali have increased the water demand. To increase raw-water supply capacity, the government has built the Estuary Dam.
WATER RESOURCES Vol. 42 No. 5 2015
ANALYSIS OF THE SPECIFICS OF WATER RESOURCES MANAGEMENT IN REGIONS 741
Over the last decades, pronounced trends in chang-ing of the structure of the water consumption have been observed (Table 2). The proportion of water use for irrigation decreased, and the proportion of domes-tic consumption increased. The proportion of indus-trial water consumption (including education facili-ties, healthcare, hotels and restaurants, ports and air-ports, sports and general, livestock and fisheries) increases. Estimated projections show that the total water consumption in the next decade will increase by at least 20% due to the growth of domestic and non-domestic consumption, while the use of irrigation water use will continue decreasing. Our calculations show an ascending trend in domestic consumption, even in the last decade–from 131 to 182 L/day per user (Table 2).
Wastewater from domestic sector, tourist com-plexes, and Subaks, discharged into canals, rivers, and ocean are completely untreated or partially treated. Furthermore, intensive agricultural technologies include a widespread use of fertilizers and plant pro-tection chemicals. Considering that the irrigation water is partially returned back into the channels and reused for irrigation of downstream Subak; the con-centration of xenobiotics increases downstream by many times. Thus, the deficit of fresh water increases due to the pollution of surface waters.
Moscow Region
Currently, the total use of surface water and groundwater for supply in Moscow Region is 3.32, compared to 3.77 km3/year ten years ago. Moscow City consumes about 4.2 million m3/day (including 0.07 million m3/day of groundwater). Moscow oblast consumes 3.1 million m3/day (including 2.8 million m3/day from groundwater sources). Thus, the proportion of groundwater in the water supply of Moscow amounts to only 1.5%, whereas the water supply of the Moscow oblast now is almost entirely based on groundwater (about 90% of the total water consumption).
The present capacity of water supply system [21] can increase the water supply of the Moscow Region by utilizing surface water. The main sources of water supply are the Moskva–Vazuza and Volga water sys-tems, which include 15 reservoirs. There are 5 water treatment stations (the Northern, Western, Eastern, Southwestern, and Rublevskaya stations) in Moscow. Their total capacity is 6.7 million m3/day (domestic water supply) and 0.83 million m3/day (technical water supply). Surface water from Moscow is partially supplied to 8 districts of Moscow oblast at a rate of 0.3–0.4 million m3/day.
Groundwater extraction in the Moscow Region is performed through more than 8000 wells. Groundwa-ter quality reflects the joint effect of the two factors: natural geochemical anomalies of water and the degree of anthropogenic pollution. Groundwater Table 2. Estimates of water consumption structure in both regions
Units Bali Moscow Region
Irrigation (2000) km3/year 2.21 0.00003
Irrigation (2010) km3/year 1.61 0.00003
Domestic (2000) km3/year 0.15 3.13
Domestic (2010) km3/year 0.28 2.66
Industrial* total (2000) km3/year 0.03 0.64
Industrial total (2010) km3/year 0.32 0.90
Drinking product now 1000 m3/year 946 860
Drinking necessary** 1000 m3/year 4599 20961
Consumption total (2000) km3/year 2.40 3.77
Consumption total (2010) km3/year 1.93 3.32
Domestic (2000) L/(day person) 131 488
Domestic (2010) L/(dayperson) 182 381
Irrigation (2000/2010) % 92.1/83.5 0.0/0.0
Domestic (2000/2010) % 6.5/14.5 83.0/80.1
Industrial (2000/2010) % 1.5/1.8 17.0/19.3
Drinking (2000/2010) % 0.0/0.0 0.0/0.0
* For Bali, it is non-domestic including for tourist business, education facilities, healthcare, hotels and restaurants, ports and airports, sports and general, livestock and fisheries.
742
WATER RESOURCES Vol. 42 No. 5 2015
NYOMAN RAI et al.
aquifers show diverse water chemistry, which varies from bicarbonate to bicarbonate-sulfate or even hydro-chloride. Groundwater salinity increases steadily northeastward, depending on its depth, and also in the area of exploitation in urban areas from 0.3 to 0.7 g/L. Natural pollutants of groundwater include primarily iron, water hardness, lithium, fluo-rine and strontium. Most common anthropogenic contaminants include dissolved organic matter, salts of nitrogen compounds, as well as microbiological con-tamination.
The sewage systems of the Moscow City and Mos-cow oblast have been developed separately. Canalized area includes the entire Moscow City and about 50% of Moscow oblast. Sewage system receives only domestic, municipal, and industrial wastewater. Sur-face storm waters are collected by an independent sys-tem. All domestic and industrial wastewaters are treated in wastewater treatment plants (WWTP) with a total design capacity of 6.34 million m3/day. The total length of the sewerage network in the city is more than 8178.4 km [21]. Wastewater is directed to Lyubertsy and Kuryanovsky WWTP. Treated wastewater is dis-charged into the Moskva River and its tributaries: Pekhorka, Desna, and Skhodnya.
The structure of water consumption in the Moscow Region for the main expenditure items in the recent years (2010) includes: irrigation – 0.0, domes-tic water – 80.1, industrial water (including the needs for the production of reinforced concrete structures and electric power on a cogeneration plant) – 19.3, bottled drinking water – 0.01% (Table 2).
The consumption of bottled drinking water is not widespread in Russia. Water supplied from water treat-ment plants must conform with the quality standards for drinking water. However, because of the large dis-tances of supplying water pipes there is risk of
second-ary contamination of water that reaches the consum-ers. Therefore, the production and use of bottled water has emerged in Russia over the last 20 years. In addi-tion, residents actively use domestic filters to improve water quality immediately before use.
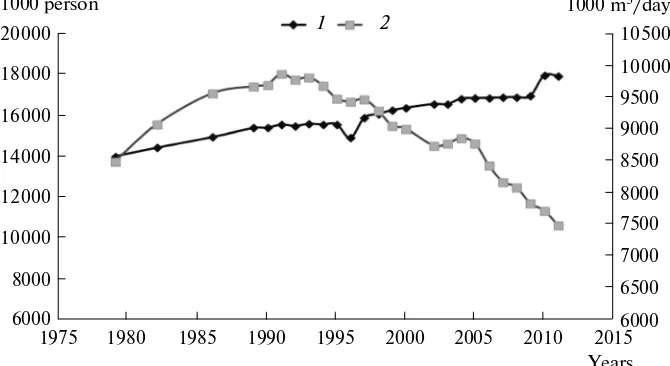
In the 1990s, a complex of measures was taken to reduce domestic consumption, including replacing plumbing devices, installation of water meters, and increasing water charges. The population growth by 15% was accompanied with a 20% decrease in water consumption (Fig. 3). The capacity of five treatment stations exceeded water consumption in the city. The excessive resources of clean water can now be used for the consumption in Moscow oblast, where groundwa-ter is mostly consumed. This can slow down the devel-opment of depression cones in the region and enable the resumption of groundwater reserves.
During the last decade, one could observe the fol-lowing trends in the restructuring of water consump-tion in the Moscow Region (Table 2). The proporconsump-tion of domestic water consumption decreased, while the proportion of industrial water consumption increased. Estimated projections indicate that the total water consumption in the next decade will not increase or even decrease due to the incipient trend of reduction of specific water consumption in the domestic sector. Thus, the domestic use decreased over the past decade from 488 to 381 L/day person and continues decreas-ing due to the use of the regulatory mechanisms: pay-ment for water is made in accordance with the read-ings of ubiquitous water meters (Table 2).
The pollution of surface water and groundwater is mainly due to domestic sewage and diffuse pollution (from urban and agricultural areas). Wastewaters from various sources with different chemistry enter reser-voirs. The self-purification capacity of reservoirs decreased significantly during their operation. For
10500
1000 person 1000 m3/day
Years
WATER RESOURCES Vol. 42 No. 5 2015
ANALYSIS OF THE SPECIFICS OF WATER RESOURCES MANAGEMENT IN REGIONS 743
many reservoirs (e.g. Klyasminskoye), it is almost at its limit [15]. In addition, groundwater is contaminated too: about one-third of extracted groundwater does not meet the standards for drinking water.
Water transfer from another basin also solves one important problem in the region—an improvement of the ecological state of the Moscow River. In the early 20th century, the Moskva River has become unsuitable for recreational use because of anthropogenic over-load: the odor, the high content of pollutants, and low oxygen in water [26]. Part of the Volga water supplied the Moskva River. By diluting with clean water of the Volga River, the ecological status of the Moskva River was improved. Self-purification processes resumed, the structure of river ecosystem balanced. However, since 2010, the river has shown a decreased rate of self-purification processes. Estimates show that watering of the river alone fails to maintain a sustainable eco-logical state [22]. The concentrations of all forms of nitrogen, organic matter, and other pollutants in the river’s water are higher now.
There are common features demonstrating the effects of significant anthropogenic pressures for two regions.
First, it is the formation of zones with a deficit of groundwater resources, i.e., the development of depression cones in aquifers (Fig. 4).
In Bali, a depression cone formed in the area of urban development of Denpasar and its surroundings. The population density in the area exceeds 6000 per-sons/km2, while the average density in Bali is 745 per-sons/km2. The population density in the urban areas of Moscow and adjacent satellite cities reaches 8000 per-sons/km2. Intensive groundwater consumption from Carboniferous deposits in Moscow Region has led to the formation of a regional depression cone. This cone embraces most part of the Moscow Region and partly Vladimir, Tver, and Kaluga oblasts. Because of the pro-longed use of groundwater, the level of aquifers has moved down in some areas, thus forming unconfined groundwater.
The second common feature of the two regions is the increasing pollution of groundwater with anthro-pogenic contaminants (so-called organic xenobiotics:
plant protection products, detergents, drugs, products of petroleum processing). Only surface waters are sub-ject to biological self-purification. The pollution of groundwater may be irreversible because there are no biological processes in deep layers. There is a small number of living organisms in groundwater layers. Groundwater may become unusable.
The third feature is the expansion of densely popu-lated urban areas where no large water streams are present; there are only small and medium streams here. These areas are represented by tourist complexes in Bali and urban districts of the New Moscow. This means that the wastewater will have a hydrological impact on the nearby rivers. Sewage flow rate will be comparable with that of the rivers: the discharged water is abstracted from subsurface sources or extracted from another river basin. An increase in the hydrological load on the surface waters changes the natural hydrological regime of rivers and streams. In Bali, this problem was solved by constructing a system of canals, fixing riverbanks. In the Moscow Region, there are changes of bed and collapses of riverbanks on some rivers [25].
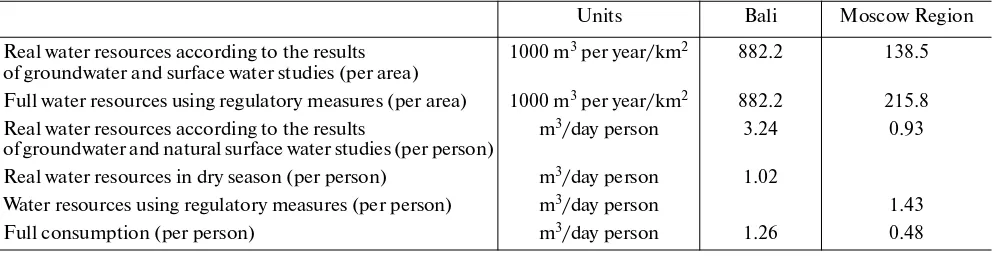
Regulatory mechanisms have been already imposed to stabilize water consumption. For Bali, it is the system of redistribution of water between Subaks, while for the Moscow Region, it is the system of water redistribution between river basins. However, these measures are not sufficient to fix the water scarcity (Bali) and to enhance the stability of self-purification and improve water quality in rivers (for Bali and the Moscow Region). We calculated some specific indica-tors of water consumption structure in both regions per area and per person (Table 3) for the present time. Table 3 illustrates the similarity of these indicators (per 1 inhabitant) between such geographically differ-ent regions experiencing similar problems of water consumption. For both regions, the critical value of real water resources per person according to the results of groundwater and natural surface water studies is about 1 m3 per day (for Bali—in dry season). The comparison of potential water resources and real water consumption demonstrates that these values have become almost identical.
Table 3. Specific indicators of water consumption structure in both regions
Units Bali Moscow Region
Real water resources according to the results of groundwater and surface water studies (per area)
1000 m3 per year/km2 882.2 138.5 Full water resources using regulatory measures (per area) 1000 m3 per year/km2 882.2 215.8 Real water resources according to the results
of groundwater and natural surface water studies (per person)
m3/dayperson 3.24 0.93
Real water resources in dry season (per person) m3/dayperson 1.02
Water resources using regulatory measures (per person) m3/dayperson 1.43
744
WATER RESOURCES Vol. 42 No. 5 2015
NYOMAN RAI et al.
Taking into account the development of depression cones in groundwater, growing pollution of waters, and the limited ability of self-purification of ground-water from organic xenobiotics, it is necessary to min-imize the use of groundwater and maxmin-imize the self-purification of surface water. To do this, the world has
already developed technologies and techniques that can be used in different regions [27].
To optimize water use in any region of the world, local governments always develop a complex of water management measures and measures for protection of water bodies to achieve water quality targets. Taking (a)
Bali
Denpasar
(b)
R iver M
osk va Laut Bali
Sel at l
om bo
k
S ea
t B ali
1 2
3
4 5 6
7
1
2
3
4
5 6
7
1
2
WATER RESOURCES Vol. 42 No. 5 2015
ANALYSIS OF THE SPECIFICS OF WATER RESOURCES MANAGEMENT IN REGIONS 745 into account the development of such practices in
var-ious regions, we can say that in most cases these mea-sures are based on calculations of water balances within the basin (basin principle). However, as shown by our study, to select appropriate control measures one should consider long-term dynamics of water use in the region, assess the changes in the structure of water use, and make the calculation of specific indica-tors of water. Of course, the “critical value” for both regions that we found cannot act as the basis for deci-sion making in other regions, but we proposed a meth-odological approach to the evaluation of the available resources. This approach can serve as a basis for the development of such activities.
The activities that primarily will solve the prob-lems:
(1) The development of scientific and technical programs of accumulation and optimal use of surface water, including rainwater;
(2) Separate supply of drinking water and domestic water in case of possible water pollution in the piping system;
(3) Extended governmental and industrial moni-toring of the entire water system;
(4) The development of technologies enabling effective landscape self-purification of water resources.
CONCLUSIONS
Regions with rapid population growth and high population density that are not located on a major watercourse but include one or more basins of small and medium rivers at certain stage of development begin to suffer water scarcity, exacerbated by ground-water pollution. To assess the situation and forecast the state of water complex, we propose to use specific indi-cators, calculated as the ratio of available water resources per 1 inhabitant. We have shown that critical value of real water resources according to the results of groundwater and natural surface water research for two geographically distinct regions is about 1 m3 per day per person. The recommended regulatory mea-sures after reaching such values include reducing the consumption of groundwater, the construction of local reservoirs and purification plants for surface water, the development of measures to intensify the self-purifi-cation of surface water, and monitoring the entire water system.
To solve the problem of water supply to the growing population, industry, and agriculture of these territo-ries, one should begin by determining the boundaries of the water system, where the mechanisms of distri-bution of water resources will be implemented. The design of the structure of a water-economic system should consider two options: (1) the creation of groundwater abstraction system, and (2) the creation of a surface water treatment system. It is necessary to
take into account that renewability of groundwater in these areas may decrease because of groundwater pol-lution at a critical value of specific water consumption. Therefore, the problem of water scarcity must be addressed only as a complex problem of creating a uni-fied water management system.
ACKNOWLEDGMENTS
This study was supported by the Russian Founda-tion for Basic Research, project no. 14-17-00672.
REFERENCES
1. BPS Statistics of Bali Province. http:// bali.bps.go.id/tabel.php?id=1&rd=
2. Acharyya, S.K., Lahiri, S., Raymahashay, B.C., and Bhowmik, A., Arsenic toxicity of groundwater in parts of the Bengal basin in India and Bangladesh: the role of Quaternary stratigraphy and Holocene sea-level fluctu-ation, Environ. Geol., 2000, 39, pp.1127–1137. 3. Ariel, D., Rosegrant, M.W., and Meinzen-Dick, R.,
Water allocation mechanisms-principles and examples, Policy Research Working Paper, http://elibrary.world-bank.org/doi/pdf/10.1596/1813-9450-1779
4. Bali tourism statistic 2011. http://www.baliprov.go. id/files/subdomain/disparda/file/CD%20Interaktif/ CD%20Interaktif%202011.pdf
5. BPS, Jakarta, Statistik Air Minum 1996–2000, CV Mitra Bersama. http://bali.bps.go.id/index_eng. php? reg=pub_det&id=Statistik%20Air%20Minum% 201996-2000
6. Coward, E.W., Direct or indirect alternatives for irriga-tion investment and the creairriga-tion of property, Irrigairriga-tion Investment, Technology and Management Strategies for Development, Easter, K.W., Ed., Boulder, CO: Westview Press, 1986, pp. 225–244.
7. Danilov-Danilyan, V.I., Jamalov, R.G., Vasilyeva, V.P., and Egorov F.B., Water problems of Moscow agglomer-ation: the state of groundwater resources and surface waters, Proc. Conf. “Unsolved Environmental Problems Moscow and Moscow Region”, Moscow: Media-Press, 2012, pp. 115–125.
8. Davydov, L.K., Dmitrieva, A.V., and Konkin, N.G., General Hydrology, L.: Gidrometeoizdat, 1973. 9. Federal State Statistics Service. http://www.gks.ru/ 10. Geocenter Moskva. http://geocentr-msk.ru/content/
view/21/46/
11. Garduño, H., Romani, S., Sengupta, B., Tuinhof, A., and Davis, R., India groundwater governance case study, June 2011. http://water.worldbank.org/sites/ water.worldbank.org/files/GWGovernanceIndia.pdf 12. JICA, 2006. The Comprehensive Study on Water
Resources Development and Management in Bali Province in the Republic of Indonesia. http://www. jica.go.jp/english/publications/reports/annual/2006/ 13. Kalaida, M.L., and Mugantseva, T.P., Improving the
746
WATER RESOURCES Vol. 42 No. 5 2015
NYOMAN RAI et al. 14. Kirpichnikova, N.V., Investigation of uncontrolled
sources of pollution (for example, the reservoir Ivank-ovskoye), Abstract of Cand. Dissertation. Ph.D., M., 1991.
15. Kirpichnikova, N.V., The main sources of pollution of the reservoir, in Ivankovskoe Reservoir. Current Status and Problems of Protection, M., 2000, p. 89.
16. Klepov, V.I., Water resources management in the upper Volga basin, Advances in Hydro-Science and Engineer-ing, BeijEngineer-ing, China, 1995, vol. II, Pt A, pp. 729–734. 17. Lebedev, N.A., Natural Groundwater Resources of the
Moscow Artesian Basin, M.: Publishing House “Sci-ence”, 1972.
18. Lorenzen, R.P. and Lorenzen, S., Changing realities. Perspectives on balinese rice cultivation, Human Ecol-ogy, 2011, vol. 39, pp. 29–42.
19. Lorenzen, R.P., A case study of Balinese irrigation management: institutional dynamics and challenges, 2nd Southeast Asia Water Forum 29 August–3 Septem-ber, 2005, https://crawford.anu.edu.au/rmap/pdf/ _docs/Lorenzen_irrigation.pdf
20. Mosekomonitoring. http://www.mosecom.ru/
21. Mosvodokanal. http://www.mosvodokanal.ru/water-supply/
22. Nevsky, A.V., Meshalkin, V.P., and Sharnin, V.A., Anal-ysis and Synthesis of Water Resource Saving Chemical Engineering Systems, Moscow: Nauka, 2004, 212 p. 23. Nielsen, G.L. and Widjaya, J.M., Modeling of
ground-water recharge in Southern Bali, Indonesia, Ground Water, 1989, vol. 27, pp. 473–480.
24. Rai, I.N. and Adnyana, G.M., Land Use and Water Competition. Perspective of Agricultural and Environ-mental Sustainability, Denpasar, Bali: Udayana Univer-sity Press, 2011.
25. Schegolkova, N.M., Danilovich, D.A., Kozlov, M.N., Moizhes, O.V., Pushkar, V.Y., Vladov, M.L., and Staro-voytov, A.V., Effect of purified water flooding on the ecological state of river Pekhorka, Water Supply and Sanitation Equipment, no. 10, 2008, p. 77–83.
26. Shchegol’kova, N.M., Urban effect on the formation of the Moskva river environmental state (historical aspect), Water Resources, 2007, vol. 34, no. 2, pp. 217– 228.
27. Schegolkova, N.M. and Venitsianov, E.V., Protection of Polluted Rivers: the Intensification of Self-Purification and Optimization of Water Disposal, M.: RAAS, 2011. 28. Stroma, C., A political ecology of water equity and tourism. A case study from Bali, Annals of Tourism Research, 2012, vol. 39, no. 2, pp. 1221–1241.
29. Sutawan, N., Swara, M., Windia, W., Suteja, W., Arya, N., and Tjatera, W. Community-based irrigation systems in Bali, Irrigation and Water Management in Asia, Gooneratne, W. and Hirashima, S., Eds., New Delhi/Bangalore: Sterling Publishers Private Limited, 1990, pp. 81–147.
30. Sutawan, N., Negotiation among irrigators’ associa-tions in Bali, Negotiating Water Rights, Bruns, B.R. and Meinzen-Dick, Eds., R.S., London: IT DG Pub, 2000, pp. 315–336.
31. Water governance for agriculture and food security, Proc. Twenty-fourth Session Rome, 29 September– 3 October 2014, FAO, Committee on agriculture. http://www.fao.org/3/a-mk967e.pdf
32. Water policy and strategy of the United Nations Envi-ronment Programme. http://www.unep.org/themes/ Freshwater/Documents/pdf/WPS_adpoted_ at_GC% 2024.pdf
33. Water quality degraded in Bali’s tourism areas, Xinhua News Agency December 7, 2007. http://www.china .org.cn/english/environment/234747.htm
34. Windia, W., Sustainability of subak irrigation system in Bali (experience of Bali island), Dipresentasikan Dalam: Seminar on The History of Irrigation in Eastern Asia, Yogyakarta, Indonesia: ICID.IID, 2010, http:// www.rid.go.th/thaicid/_6_activity/History-Seminar/ HS.06.Wayan_Windia.pdf
![Fig. 2. Monthly water potential in Bali: 1—potency of surface water, 2—potency of groundwater, 3—potency of total availability[1].](https://thumb-ap.123doks.com/thumbv2/123dok/586374.256748/9.612.75.526.61.264/monthly-potential-potency-surface-potency-groundwater-potency-availability.webp)
![Fig. 4. Water spring potency in Bali (a) and location of depression cones in the Moscow region (b) [7, 11]](https://thumb-ap.123doks.com/thumbv2/123dok/586374.256748/15.612.151.452.60.583/water-spring-potency-bali-location-depression-moscow-region.webp)
