MEASUREMENT AND EVALUATION OF THE SOUND ABSORPTION COEFFICIENT FOR VARIOUS ASIAN WOODS
NORENA MASLIHA BINTI MASURI B040410163
Laporan ini dikemukakan sebagai memenuhi sebahagian daripada syarat penganugerahan
Ijazah Sarjana Muda Kejuruteraan Mekanikal (Struktur & Bahan)
FAKULTI KEJURUTERAAN MEKANIKAL UNIVERSITI TEKNIKAL MALAYSIA MELAKA
Saya/kami akui bahawa telah membaca karya ini dan pada pandangan saya/kami karya ini
adalah memadai dari segi skop dan kualiti untuk tujuan penganugerahan Ijazah Sarjana Muda Kejuruteraan Mekanikal (Struktur & Bahan)
Tandatangan:………. Nama Penyelia 1:……… Tarikh:………
“ I hereby declare that this project report is written by me and it is my own effort and that no part has been plagiarized without citations”
Signature :………...
Name of Writer:……….…
Date :……….
ACKNOWLEDGEMENT
First of all the author would like to express highest gratitude especially to the supervisor Rainah bt. Ismail for sharing ideas, giving moral support, advises and guideline from the early until the end of the project.
All the cooperation from the management of laboratory, especially to UiTM staff Prof,Madya Puan Seti Meriam and all the technicians, during the experiment testing were very much appreciated. Finally yet importantly, thank you to En. Hamzah bin Mohd Dom who also gives valuable advice and guideline in order to complete this research.
ABSTRACT
ABSTRAK
CONTENT
CHAPTER TITTLE PAGES
CONFESSION ii
DEDICATION iii
ACKNOWLEDGEMENT iv
ABSTRACT v
ABSTRAK vi
CONTENT vii
LIST OF FIGURE x
LIST OF TABLE xiii
LIST OF APPENDIX xiv
CHAPTER 1 INTRODUCTION 1
1.1 Background 1
1.2 Objective 2
1.3 Scope 2
1.4 Problem statement 3
1.5 Report Structure 8
CHAPTER 2 LITERATURE REVIEW 9
2.0 Introduction 9
2.1 Terms definitions 9
2.1.1 Frequency 10
2.1.3 Sound Absorption Coefficient 11
2.1.4 Diffraction 11
2.2 Acoustic Theory 13
2.3 Sound 13
2.4 Sound Absorption 14
2.5 Perception of Sound 16
2.6 Speed of Sound 17
2.7 Sound Pressure 18
2.8 Sound Pressure Level 19
2.9 Sound Power Level 19
2.9.1 SPL in Audio Equipment 22
2.10Loudness 23
2.10.1 A-Weighting 23
2.10.2 Loudness Weighting 25
2.10.3 Phons 25
2.10.4 More on Loudness 25
2.10.5 Sone 26
2.10.6 Loudness Calculation 26
2.11 Sound Intensity 26
CHAPTER 3 RESEARCH METHODOLOGY 28
3.0 Introduction 28
3.1 Raw Material In Used 29
3.2 Methodology 30
3.2.2 Random Incidence Technique 30 3.2.3 Sound Intensity Technique 33
3.3 Method to Measure 36
CHAPTER 4 EXPERIMENTAL METHODOLOGY 37
4.1 Reverberation Room 38
4.2 Measurement Preparation 38
4.3 Receiving equipment 44
4.4 Measurement Procedure 45
CHAPTER 5 RESULTS AND DISCUSSION
5.1 Data from Experimental Results 48
5.2 Calculation 50
5.3 Errors in Experiment 52
CHAPTER 6 CONCLUSION and RECOMMENDATION
6.1 Conclusions 53
6.2 Recommendation 54
REFERENCES 55
LIST OF FIGURE
Figure
Number Figure Description Pages
1
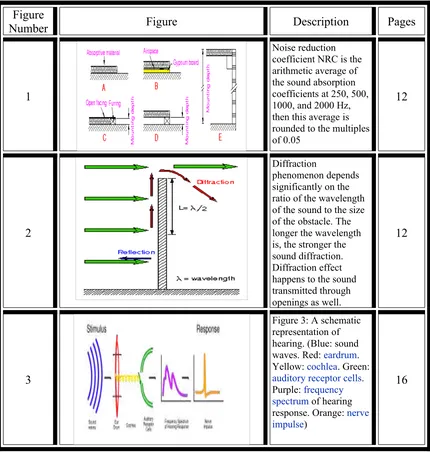
Noise reduction coefficient NRC is the arithmetic average of the sound absorption coefficients at 250, 500, 1000, and 2000 Hz, then this average is rounded to the multiples of 0.05
12
2
Diffraction
phenomenon depends significantly on the ratio of the wavelength of the sound to the size of the obstacle. The longer the wavelength is, the stronger the sound diffraction. Diffraction effect happens to the sound transmitted through openings as well.
12
3
Figure 3: A schematic representation of hearing. (Blue: sound waves. Red: eardrum. Yellow: cochlea. Green:
auditory receptor cells.
Purple: frequency
spectrum of hearing
response. Orange: nerve
impulse)
[image:11.612.105.535.222.674.2]4 Reflection, absorption, and transmission 24
5 Standing wave method 31
6
The phenomena of the principle of
conservation energy 34
7
The phenomenon of reflection, absorption and transmission of sound power in an acoustic material
35
8
01dB Dual Channel Analyser type
Symphonie, Serial No. #01223
40
9 PMCIA Card 974133-6,
10
01dB ½” Microphone, Serial No. #17404 with 01dB ½” Preamplifiers, Serial No. #011280
42
11
Brüel & Kjær Electronic Calibrator type 4231, Serial no. #1800414
42
12
01dB Noise Source Type GDB95, Serial No. 10256 complete with amplifier
43
13
01dB Building Acoustics Software type dBBati32 32-Bit Version
43
15 Graph of Reverberation Time vs. Frequency 49
26 Reverberation Time
LIST OF TABLE
TABLE TITLE PAGE
1 Absorption coefficients of common building materials and
finishes 3
2 Sound power level and sound power of some sound source 21 3 Data for RT depend on frequency with different test
specimen. 48
4 Data Collection 50
LIST OF APPENDIX
Description Pages
Appendix 1: Measurement data for all specimens xv Appendix 2: Graph of signal for measurement data f xvi
or all specimens
Appendix 3: Graph of decay for measurement data xx for all specimens
Appendix 4: Graph of Reverberation Time for measurement xxiv data for all specimens
Appendix 5: Graph of average Reverberation Time for xxviii measurement data for all specimens
Appendix 6: Result of Sound Absorption Coefficient xxix for various Asian woods.
CHAPTER 1
INTRODUCTION
1.1. Background
Acoustics is the science that concerned with the production, control, transmission, reception, and effects of sound. Their origin began with the study of mechanical vibrations and the radiation of these vibrations through mechanical waves. This research will do to look into many aspects of the fundamental physical processes involved in waves and sound and into possible applications of these processes to determine the sound absorption coefficient that apply on this theory.
Althoughpeople must have been aware of the acoustic peculiarities of rooms since
and the measuring technology have been evolving ever since. The paper traces these processes from the viewpoint oftheir effects on acoustical design.
1.2 Objective
The objectives of this project are to determine the sound absorption coefficient among various Asian woods like Damar Hitam, Meranti and Resak. This research is important in order to learn more about the sound absorption coefficient measurement techniques using different methodology and the measurement will walk in with suitable methodology depend on the sample. At the end of the project, a table that shows the sound absorption coefficient among these Asian woods is anticipated.
1.3 Scope
Asian wood. After all procedure and the experiment will be done, the next step is to collect data and make it into a table.
1.4 Problem statement
1.6 Report Structure
Chapter 1 presents the introduction of this project. It discuss about the background, objective of this project, the scope, the problem statement and the Gantt chart for this PSM1.
Chapter 2 explains the theory that applies on this project. Terms that are related to determine the sound absorption coefficient will be discuss in this chapter.
Chapter 4 covers the experimental methodology that has been used to determine the sound absorption coefficient. The method is used in this project is explained in detail.
Chapter 5 discusses the result and show the calculation to determine the sound absorption coefficient (α).
CHAPTER 2
LITERATURE REVIEW
2.0 Introduction
In this chapter, the term that related to the sound absorption coefficient will be discussed. The principle of acoustic theory is elaborated. This chapter will cover the theory of acoustic, the application of sound absorption, sound, and perception of sound, speed of sound, sound pressure, sound pressure level, sound power level, loudness, and sound intensity.
2.1 Terms definitions
2.1.1 Frequency
Frequency (f) is the number of cycles that the periodic signal completes in one second. The unit of the frequency is Hz (Hertz). The pure tone or the sine wave has a single frequency. Sound and noise usually are not pure tones. Depending on Fourier transform (the complex signal can be synthesized from sine signals - or pure tones - of different frequencies, different amplitudes and different time delays or phases) the sound signal represents pure tones with defined amplitudes (or intensities). The upper and the lower limits of the audible frequency range considered 16 Hz to 20,000 Hz; depend on many factors such as the setup of the measurements and the age of the listeners. The human hearing system is more sensitive to frequencies in the range of 1000 Hz-4000 Hz. [1]
2.1.2 Sound Levels and Decibel
2.1.3 Sound Absorption Coefficient
What the sound absorption coefficient is. Sound absorption coefficient describes the efficiency of the material or the surface to absorb the sound. The ratio of the absorbed sound energy to the incident energy is the sound absorption coefficient.
For architectural purposes, sound absorbing materials and constructions can be divided into four types of materials depending on the way the absorption is mainly performed:
1. Turning the sound energy into heat such as fiberglass and carpet.
2. Vibrating with a specific frequency when the sound hits the surface such as lightweight panels and 5/8" gypsum board. (These materials absorb the sound effectively on a narrow band of frequencies).
3. Turning the sound energy into heat in the neck of the cavities (Helmholtz resonator) such as sound blocks. (This construction has a good absorption on low frequencies).
4. Allowing the sound to go through such as some types of grid systems and lay-in ceiling with sound leakage above it.