Low-cost portable heart rate monitoring based on photoplethysmography and decision
tree
Tatiya Padang Tunggal, Abdul Latif, and Iswanto
Citation: AIP Conference Proceedings 1755, 090004 (2016); doi: 10.1063/1.4958522 View online: http://dx.doi.org/10.1063/1.4958522
View Table of Contents: http://scitation.aip.org/content/aip/proceeding/aipcp/1755?ver=pdfcov Published by the AIP Publishing
Articles you may be interested in
Long‐term, low‐cost noise monitoring systems
J. Acoust. Soc. Am. 96, 3335 (1994); 10.1121/1.410691
A low‐cost LN2 monitor
Am. J. Phys. 57, 954 (1989); 10.1119/1.15806
A portable, low‐cost, digital system for room acoustics measurements J. Acoust. Soc. Am. 74, S62 (1983); 10.1121/1.2021067
Low‐cost community‐noise monitoring system
J. Acoust. Soc. Am. 60, S85 (1976); 10.1121/1.2003568
Low-Cost Portable Heart Rate Monitoring Based on
Photoplethysmography and Decision Tree
Tatiya Padang Tunggal
1, 3), Abdul Latif
2, 3), Iswanto
1, 2, a)1Department of Electrical Engineering and Information Technology, Universitas Gadjah Mada, Jl. Grafika
No. 2 Kampus UGM, Yogyakarta, Indonesia
2Department of Electrical Engineering, Universitas Muhammadiyah Yogyakarta, Jl. Grafika
No. 2 Kampus UGM, Yogyakarta, Indonesia
3Department of Electro-Medical Engineering Polytechnics, Universitas Muhammadiyah Yogyakarta, Jl. Pramika
No. 62, Yogyakarta, Indonesia
a)Corresponding author: [email protected]
Abstract. Heart disease is caused by a cardiac function which does not work optimally. This illness can be detected by sensing a pulse that is defined as the rhythm of the heartbeat. Some researchers have conducted a study to determine and monitor heart rate. Researches resulted in very expensive and not portable tools. Therefore, this paper examines portable heart rate monitoring with photoplethysmography method and decision tree algorithm. The photoplethysmography method is an optical technique that is cheap and simple that can be used to detect changes in blood volume in the microvascular network. The method modified on the transmitter and receiver sensors. The decision tree algorithm is used to make decisions for one's pulse form of digital data retrieval heart rate. With the decision tree algorithm obtained a normal heart, Bradycardia, and Tachycardia. The method and algorithm result in a much cheaper tool which can detect heart rate which later is categorized into the normal heart, Bradycardia, or Tachycardia.
INTRODUCTION
The heart is a vital organ of the human body that serves to pump and circulate blood containing nutrients food and oxygen to all parts of the body [1]. When the heart is impaired, it will cause several diseases such as hypertension, stroke, myocardial infarction, cerebrovascular, etc. [1-2]. To detect the diseases caused by the impaired heart, some physicians have conducted some experiments by counting heart pulse.
Heart rate is a heartbeat rhythm that can be sensed on the surface of the skin at certain places [3]. It is the easiest way to determine a person's heart rate and equal to the frequency of the heartbeat. By knowing and calculating the heart rate of a person, some medical experts can determine a person's health. The number of beats that occur within 1 minute can be measured in this way. Some medical professional use a sampling process in counting the heart beat in 15 seconds and subsequently the results of the counting is multiplied by four to get the number of heartbeats in one minute. This method is less effective, requiring high concentration and assistance (timer) as the basis for calculation. Furthermore, errors in calculating the rate would be fatal for the patient.
Therefore, it is necessary to use automated devices that can perform the counting to detect a heartbeat. Several researchers have conducted studies in counting heart rate by using ECG [4-5]. Lagido et al. [3] used a smartphone camera to count it while Guo-cheng and Hong-yang [6] developed the research by using light sensors to detect heart rate and calculate heart rate by using iOS platform. However, these tools are too expensive and cannot be implemented by low-income society.
ultrasound and Wang [8] who used a microphone. The later researcher processed heart rate data by using a smartphone.
Additionally, other researchers used photoplethysmography method which is a method using light sensors [9 -14] to detect heart rate. Infrared and photo sensors are used by Ramlee et al. [9] and Rahman et al. [10] to detect it. Ramlee et al. used a computer to count and display the heart rate while Rahman et al. used a microcontroller to
count and display it. Some other researchers compare the performance of led Red, Green, and Blue to detect heartbeat such as Lee et al. [11]. Photodetector sensors are used by Fukushima et al.[12], Miah et al. [13], and
Izneid et al. [14] who used photoplethysmography theory to detect heart rate.
Cardiac monitoring is very important to diagnose the health condition of a person. This study presented in this paper uses a light sensor to detect heart rate. The sensor used in this study using a photodiode as the receiver and infrared as the transmitter. The method used in this research is the development of the theory of photoplethysmography.
RESEARCH METHODS
The research presented in this paper applies two methods namely hardware and software methods. The researcher uses photoplethysmography [9 - 14] method for the hardware method and decision tree algorithm for the software method. Photoplethysmography method is an optical technique that is cheap and simple that can be used to detect changes in blood volume in the microvascular network. The method modifies the transmitter and receiver sensors. In addition to using the sensor, the researcher uses a method to process very small sensor signals. This method is modified from the method of the previous researchers who did not obtain a good result because the sensor was still impaired. The method is described in Fig. 1.
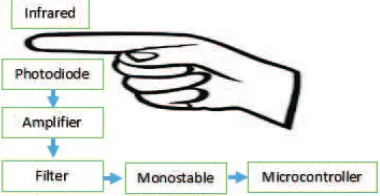
FIGURE 1. Heart rate monitoring diagram block
Figure 1 shows that Infrared light will penetrate the finger and is captured by the photodiode sensor. Blood flow creates a signal in the photodiode output. The output signal is very small and then amplified by the amplifier circuit to obtain a stronger signal. But the signal has noise, requiring a series of filters to remove the noise. Afterward, the signal flows from the filter into the monostable circuit to get flawless and noiseless square wave. The output of the monostable is a square wave which is then inserted into the AVR ATMEGA8 microcontroller counter pin which is later processed and displayed in the LCD Character in the form of BPM value.
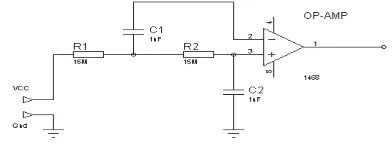
FIGURE 2. Design of Infrared and photodiode circuit
Figure 2 shows that the sensor consists of an infrared LED transmitter and a photodiode. IR (infrared) is an electromagnetic beam with a wavelength of 700nm emitting light that is invisible and can penetrate human skin
tissue. While photodiode is a type of diode that serves to detect the amount of light and convert light into electrical quantities. Transmitter and receiver circuits are given a resistor which the value is calculated by the following equation Infrared Infrared Vcc Infrared
I
V
V
R
(1)Photodiode Photodiode Vcc Photodiode
I
V
V
R
(2)in which
R
Photodiode is a resistance on the photodiode circuit,V
Vccis a voltage source,I
Infrared is current throughthe infrared,
I
Photodiode is the current through the photodiode,R
Infrared is an infrared resistance on the circuit,Infrared
V
is the voltage required by the infrared and
V
Photodiode is the voltage needed by the photodiode.+ -U2A LM324 3 2 1 4 11 VCC J14 Vin 1 Ri Rf J15 Vout 1
FIGURE 3. Design of a non-inverting amplifier circuit
Figure 3 shows that the design of the amplifier circuit that is used to amplify the voltage conversion result of light absorbed by the photodiode into a voltage output from the sensor, thus, the voltage generated can be processed by the microcontroller. The amplifier in this circuit is a non-inverting amplifier using LM324 IC. So that equation to determine the value of Rf and Ri is needed. The following is the calculation formula:
¸¸
¹
·
¨¨
©
§
i fR
R
Acl
1
, (3)where
Acl
is the value of the desired amplification, whereasR
fandR
iare the resistances of the non-invertingamplifier.
FIGURE 4. Design of low pass filter Butterworth circuit
RC
f
cS
2
1
, (4)where
f
c is the cut-off frequency,R
is the value the resistor in the circuit forR
1,2, andC
1,2is the value of thecapacitor in the circuit.
R
D1 LED VCC
J1
CON1 1
C VCC
U1 NE555 2
5
3 7 6
4
TR
CV
Q DIS THR
R J2
Out 1
FIGURE 5. Monostable circuit design
Figure 5 shows a monostable circuit which is used to enable the logic entering the microcontroller to become 5 volts and 0 volts, and also to limit the frequency in case if there are 2 pulses; it will read 1 pulse. From the figure, the resistor and capacitor values can be calculated as shown in the following equation:
RC
T
1
.
1
, (5)where
T
is the period for the monostable circuit,R
andC
are the resistor and capacitor values in themonostable circuit to form a periodical pulse.
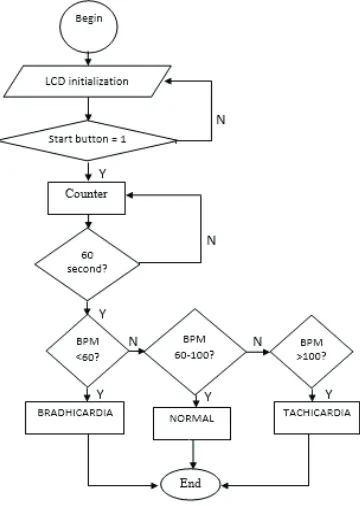
FIGURE 6. Flowchart of decision tree algorithm
The software method to detect heart rate is decision tree algorithm [15] as shown in Fig. 6. It shows a flow diagram of decision tree algorithm. In this flow chart, digital data in the form of heart rate retrieval is taken. It takes
60 second or 1 minute then the data is processed into BPM. With the decision tree algorithm, normal heart, Bradycardia or Tachycardia are obtained. BPM result of less than 60 indicates Bradycardia, between 60 BPM to 100 BPM indicates normal and more than 100 indicates Tachycardia.
RESULTS AND DISCUSSION
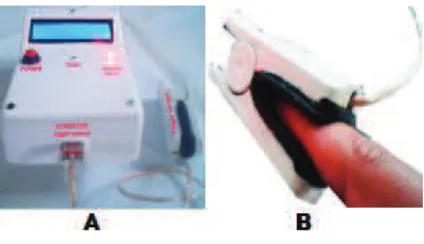
Some samples were taken to prove that the method was applied accordingly in this experiment. Data retrieval was conducted by using Fig. 7. In the figure, it can be seen that the tool consists of a processor master and finger sensor. Heart rate data is obtained by placing a fingertip on the sensor as shown in Fig. 7b, then by pressing the power button to on position, LED indicator light turns on as well as the pulse indicator light in tune with the pulse. Once the loading is completed, the tool starts to count pulses up to 60 seconds. The numbers of BPM then appear on the LCD, and so it can be categorized as Bradycardia, Normal, or Tachycardia.
FIGURE 7. Heart rate specifications
The experiment was conducted by taking samples of children, young people and adults with ages between 1 to 30 years. The experimental data are in Table 1 which shows the relationship between pulses with a person's age. The experiment which was conducted to adults aged over 18 years shows a normal BPM value ranging from 60 - 100.
TABLE 1. Capturing pulse based on person's age
Age BPM
1 – 2 110
2 – 6 105
6 – 10 95
10 – 14 85
14 – 18 82
> 18 60-100
The second data sampling for eight adults conducted during a relaxed state and after running. The experiment is shown in Table 2. In the table, it can be seen that there are some who have abnormal heart pulse. Irregular beats are those that less than 60 or more than 100. From the table, it appears that Pa suffers Tachycardia because when he is in a relaxed state or after he runs, he has a pulse rate above 100. Bu also has a symptom of Tachycardia because when he is in a relaxed state, the pulse is still normal but after he runs the pulse goes above 100.
TABLE 2. Capturing pulse based on person's age
No Name Age Weight Relaxed data Exhausted run data
1 Wi 29 45 78 83
2 Jo 19 64 77 80
3 Di 30 50 79 89
4 Bu 25 90 80 102
5 Li 33 42 75 79
6 Pa 35 100 102 110
7 Hu 45 56 70 89
CONCLUSION
The photodiode and infrared detection sensors can be used as pulse counters. With photoplethysmography method, the output voltage of the photodiode is very small. Thus, it requires an amplifier circuit to strengthen the signal. Also, the signal has noise at low frequencies requiring a low pass filter Butterworth to remove it. To be processed by a microcontroller, a signal is fed into a monostable circuit to obtain noiseless square wave which is then changed into a pulse. By using decision tree algorithm, the rhythm of the heart is divided into three categories, namely Tachycardia means that the heart rate is over 100 beats/min, Bradycardia means that heart rate is less than 60 beats/min and Normal means that heart rate is between 60-100 times/min.
REFERENCES
1. I. Shiue, Int. J. Cardiol181, 403–412 (2015).2. P. K. Jain and A. K. Tiwari, Comput. Biol. Med.54, 1–13 (2014).
3. R. B. Lagido, J. Lobo, S. Leite, C. Sousa, and L. Ferreira, “Using the smartphone camera to monitor heart rate
and rhythm in heart failure patients,” in 2014 IEEE-EMBS International Conference on Biomedical and Health
Informatics (BHI) (IEEE, 2014), pp. 556–559.
4. Y. Wen, R. Yang, and Y. Chen, “Heart rate monitoring in dynamic movements from a wearable system,” in
Proceedings of the 5th International Workshop on Wearable and Implantable Body Sensor Networks (IEEE,
2008), pp. 272–275.
5. M. Engin, E. Z. Engin, S. Bildik, and T. Karipcin, “Portable Heart Rate Monitoring System,” in Biomedical
Engineering Meeting-2009, (IEEE, 2009), pp. 1–4.
6. L. Guo-cheng and Y. Hong-yang, “Design and implementation of a Bluetooth 4.0-based heart rate monitor
system on iOS platform,” in 2013 International Conference on Communications, Circuits and Systems
(ICCCAS) (IEEE, 2013), pp. 112–115.
7. O. C. Coiado, E. B. Buiochi, W. D. O. B. Jr, and L. Fellow, IEEE Trans. Ultrason. Ferroelectr. Freq. Control 62, 329–336 (2015).
8. Z. Wang, K. Yang, W. Wang, H. Jiang, S. Wu, Q. Lin, and W. Jia, “Sound monitoring based wireless
healthcare and a typical implmenation for heart rate monitoring,” in 2013 IEEE International Conference of
Electron Devices and Solid-State Circuits-EDSSC 2013 (IEEE, 2013), pp. 3–4.
9. R. A. Ramlee, M. Azlshah, B. Othman, M. Ikhwan, and B. Abdul, “Low Cost Heart Rate Monitoring Device
Using Bluetooth,” in 2014 2nd International Conference on Information and Communication Technology
(ICoICT) (IEEE, 2014), pp. 42–46.
10. M. A. Rahman, A. Barai, A. Islam, M. M. a Hashem, and a P. Definition, “Development of a Device for
Remote Monitoring of Heart Rate and Body Temperature,” in 2012 15th International Conference on
Computer and Information Technology (ICCIT) (IEEE, 2012), pp. 411–416.
11. J. Lee, K. Matsumura, K. I. Yamakoshi, P. Rolfe, S. Tanaka, and T. Yamakoshi, “Comparison between red,
green and blue light reflection photoplethysmography for heart rate monitoring during motion,” in Proceedings
of the Annual International Conference of the IEEE Engineering in Medicine and Biology Society (IEEE,
2013), pp. 1724–1727.
12. H. Fukushima, H. Kawanaka, M. S. Bhuiyan, and K. Oguri, “Estimating heart rate using wrist-type
Photoplethysmography and acceleration sensor while running,” in Proceedings of the Annual International
Conference of the IEEE Engineering in Medicine and Biology Society, (IEEE, 2012), pp. 2901–2904.
13. M. A. R. Miah, S. Basak, M. R. Huda, and A. Roy, “Low cost computer based heart rate monitoring system
using fingertip and microphone port,” in 2013 International Conference on Informatics, Electronics & Vision (ICIEV) (IEEE,2013), pp. 1–4, 2013.
14. B. A. Izneid, I. Sukar, M. Ali, and C. Author, “Development Of Wireless Bluetooth Heart Rate Remote
Monitoring System,” in IET International Conference on Wireless Communications and Applications (ICWCA 2012) (IEEE, 2012), pp. 1–4.
15. Iswanto, O. Wahyunggoro, and A. I. Cahyadi, Int. J. Electr. Comput. Eng.6, 212–222 (2016).