MASJURI MUSA
JUHARI AB. RAZAK
MD RAZALI AYOB
MOHD AFZANIZAM ROSLI
SAFARUDIN GHAZALI HERAWAN
KAMARUZZAMAN SOPIAN
UNIVERSITI TEKNIKAL MALAYSIA MELAKA
International Conference and Exhibition on Sustainable Energy and Advanced Materials (ICE SEAM 2011) Solo-Indonesia. October 3-4, 2011.
CFD Analysis on Cost-effective Pico-hydro Turbine: A Case Study for Low
Head and Low Flow Rate Condition
Masjuri Musa
t),*,Juhari Ab. Razak
1),Md Razali Ayob
1l,
Mohd Afzanizam Rosli
1>,
Safarudin Ghazali Herawan
1>,
Kamaruzzaman Sopian
2)1
> Faculty of Mechanical Engineering,, Universiti Teknikal Malaysia Melaka,
2
> Solar Energy Research Institute, Universiti Kebangsaan Malaysia, Selangor, Malaysia " Corresponding author. Tel: +606 234 6891, Fax: +606 234 6884,
E-mail: [email protected]
Abstract
Pico-hydro turbine has been widely used for off-grid settlement especially for stand-alone domestic application. Jn most cases there is a trade-off between the flow rate and the available head. The fluctuation of water flow rate between wet and dry seasons obviously affected the performance of the turbine. The problem is compounded when a specific turbine is used in low head and low flow application. This paper discusses the performance of an axial-flow (propeller) turbine in this particular condition. Evaluation is made based on the blade parameters in order to improve its existing performance. Comparisons are made between the current blade and a modified version of it, in term of hub to tip ratio and the number of blades used. The values of hub to tip ratio ranging between 0.4 to 0.7. The numbers of blades used are 3, 4, 5, and 6. Simulation analysis was done using Computational Fluid Dynamics (CFD) software. Analyses were done on each of the turbine blade to find the optimum stream velocity and power output which can be derived for each combination of turbine parameters. The analysis results show that with lowest value of hub to tip ratio which is 0.4 and the lowest number of blades which is 3, contributed the best performance of the axial-flow turbine.
Keywords: CFD analysis, Pico-hydro turbine, Low head, Low flow rate.
1.
Introduction
Pico hydro-turbine is one of the alternative renewable energy which has been developed significantly for off-grid areas. Pico-hydro turbine is chose because of its environmental friendly, cheap installation during first time set-up due to it does not require the involvement of big reservoir or dam as water storage, less maintenance and even the cost of the turbine itself is very cheap. Some parts in Nepal, Vietnam, Thailand, India, and even in Peru has been used this kind of technology as their daily needs to light up their houses or doing other related tasks which energized by electricity. Committee such as in Humla, a part of rural area in India, has been implemented the pico-hydro to replace the usage of fire wood as their main energy. As a result, their life style has been improved and health conditions such as respiratory and eye sight problems because of fire wood smoke have been totally avoided (Alex Zahnd, 2009).
Pico-hydro turbine can be operated under condition oflow head with high flow rate of water stream or vice versa which is high head with low flow rate of water. However, the fluctuations between seasons are the main concern especially during dry season. This is because during dry season, the flow of the river water is very low
and this influenced obviously to the performance of hydro turbine (Sadrul Islam, RPセIM Based from
investigation which has been made by a group of researcher from Solar Energy Research Institute (SERI), Universiti Kebangsaan iv1alaysia (UKM), found that the low performance of the axial-flow turbine might probably due to rotation of turbine's blades and further investigation about this phenomena need to be done (Kamaruzzaman Sopian, 2007). Alexander and Giddens (Alexander K.V., 2008) and Alexander et al. (Alexander K.V, 2008) has been discussed about pelton wheel and axial-flow turbine for the usage under low head application which capable to produce power output up to 20kW. Besides that, Montanari (Montanari R., 2003) has suggested to implement axial-flow turbine or Michell-Benki turbines for rural areas application due to lower costs and power produced.
151
I
1 C E S E A M 2 0 1 1This paper will discuss about the performance of the pico-hydro turbine under condition of low head with low flow rate of water. Axial-flow turbine or also known as propeller turbine is one of the pico-hydro families which will be used as a subject matter. In this case study, it will involve with original and redesign blades of axial-flow turbine. Two parameters which have been selected to redesign the blades are hub to tip ratio and number of blades. Each blade will be analyzed by using Computational Fluid Dynamics (CFD) software to find out the flow velocity in order to estimate the power output produced. In addition, by implementing the CFO software, it can also indicate how the flow pattern looks like between blades from inlet to outlet of the runner section as in the real situation. It also can check the efficacy of the shape of the blades designs (Guoyi, 2005) for the optimization purposes before selection of the best blades designs can be made (Wu J., 2007).
2. Methodology
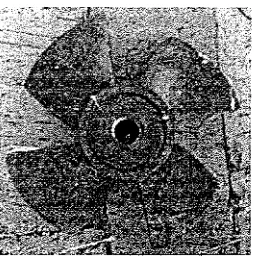
As mentioned earlier, original blades of axial-flow turbine will be used as a case study. Figure I and Figure 2 shows about the original blades of the related hydro-turbine in different views of angle.
[image:3.597.185.312.221.349.2]Figure 1. Front view of blade
Figure 2. Side view of blade
The axial-flow turbine consists with 4 blades where the size of the blades measured from tip to tip is 162mm in diameter while the thickness is 4mm. On the other hand, the diameter of the hub is 66mm with 70mm in height. Since comparison wiil be made between the original blades and redesign blades by using CFO software, therefore at the beginning stage the original together with redesign blades should be drawn·--tn a form of 30 modeling by using any Computer Aided Design (CAD) software before imported to CFO ANSYS and meshed. In this particular case, SolidWorks will be used as design software to transform the original and redesign shapes of the blades into JD CAD data. Hub to tip ratio and number of blades are two parameters that will be emphasized in the redesign blades. The value of hub to tip ratio is ranging from 0.4 to 0.7. The total numbers of blades to be analyzed are 3, 4, 5 and 6. In some cases, the value of hub to tip ratio was restricted to 03 due to it might increase the flow area and reduces the flow velocity. As a result hydraulic losses might be occurred (P. Singh, 2009). According to P. Singh, the numbers of blades are totally depends on the length and pitch of the blade. Therefore, it is preferable to have larger number of short blades rather than smaller number of long blades.
International Conference and Exhibition on Sustainable Energy and Advanced Materials (ICE SEAM 2011) Solo-Indonesia. October 3-4, 2011.
Once all the 3D data arc ready, each combination of the parameters will be analyzed by using CFO (CFX) ANSYS simulation software. The analysis should considered low head which is 2m and low flow rate of water and therefore it has been set to 50kgs- l, 40kgs- l, 30kgs-l, 20kgs- l and !Okgs-1. The analyses were done to find out the flow velocities for combination of each parameter under low flow rate condition. All data which has been collected will then be converted into graphical form to facilitate the understanding of the end results.
In some cases such as Hydro-Quebec has been implemented CFO to determine the performance of the existing turbines by analyzed only on a single runner blade (J Nicolle, 20 I 0). Reverse engineering techniques has been implemented and two different methods were used. The first method involved with a laser FARO ScanArm and the second method was using Atos! photogrammetric scanner from GOM. Both of the methods could obtained a close surface triangulation which containing around 450K elements while NURBS which represented the measured surface can be defined and this make it easily integrate with the CAD data and then analyze it under CFO software.
3. Results and Discussion
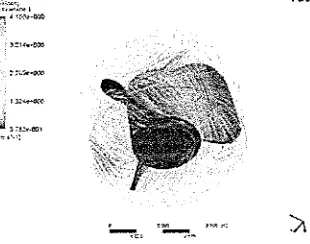
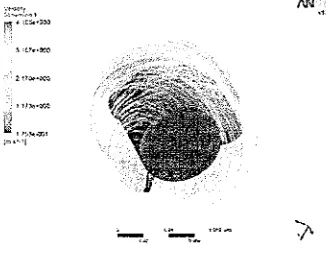
All data which has bec;1 collected after run the analysis are saved under spreadsheets and then converted into graphs. There were 80 data which needs to evaluate. Figure 3 to Figure 6 shows some of the examples of analyses which have been conducted by using CFO (CFX) ANSYS analysis software. Table 1 to Table 4 shows about the data analysis for the flow velocity with the number of blades involved. Figure 7 to Figure I 0 are the graphs which have been converted from these data analysis.
GNセMMN[ZNセN@
;•,...,....,..,
r.'.'! セ@ エZセセᄋooq@
G[ZMUQセ@
; 1:H:io<•OOO
セ@ Z[[ZセセPPMQ@
("'1&•,\j [image:4.595.162.321.291.413.2]'*
-<•"'Figure 3. CFO data analysis for hub to tip ratio 0.4, 3 blades with mass flow rate 1 Okgs·1
Figure 4. CfD data analysis for hub to tip ratio 0.5, 3 blades with mass flow rate
AoォァセM
Q@ [image:4.595.164.319.448.570.2]Figure 5. CFD data analysis for hub to tip ratio 0.6,
,,,,.,..«':i
セャセNANエMGZ・ャ@
:"a"'!
Figure 6. CFO data analysis for hub to tip ratio 0.7, 3 blades with mass flow rate 10kgs·1
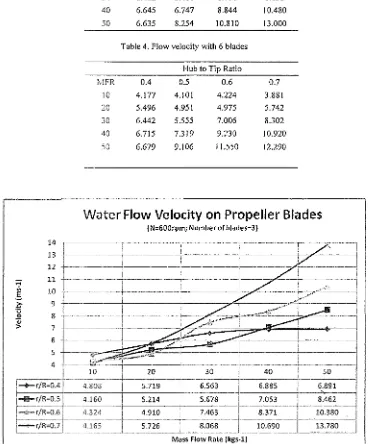
Table 1. Flow velocity with 3 blades
Hub to Tip Ratio
MFR 0.4 0.5 0.6 0.7
10 4.808 4.160 4.324 4.165
20 5.719 5.214 4.910 5.726
30 6.563 5.678 7.463 8.068
40 6.885 7.053 8.371 10.690
[image:5.595.163.327.77.199.2]50 6.891 8.462 10.380 13.780
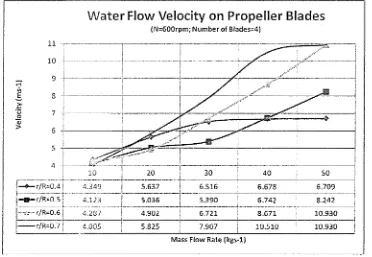
Table 2. Flow velocity with 4 blades
Hub to Tip Ratio
tv!FR 0.4 0.5 0.6 0.7
JO 4.349 4.123 4.287 4.005 '
20 5.637 5.036 4.902 5.825
30 6.516 5.390 6.721 7.907
40 6.678 6.742 8.671 I 0.510
50 6.709 8.242 10.930 10.930
[image:5.595.162.325.231.359.2] [image:5.595.140.353.405.502.2] [image:5.595.146.358.537.632.2]セ@ ·;:;
0
セ@
>
!v!FR
10
20
30
40
50
MFR
10
20
30
40
50
lilternatio11al Co1ifere11ce and Exhibition on Sustainable Energy and Advanced Materials (ICE SEAM 201 I) Solo-Indonesia. October 3-4, 201 I.
Table 3. Flow velocity with 5 blades
Hub to Tip Ratio
0.4 0.5 0.6 0.7
4.319 4.136 4.219 3.917
4.447 5.013 4.949 5.633
6.482 5.401 6.791 8.053
6.645 6.747 8.844 10.480
6.635 8.254 10.810 13.000
Table 4. Flow velocity with 6 blades
Hub to Tip Ratio
0.4 0.5 0.6 0.7
4.177 4.101 4.224 3.881
5.496 4.951 4.975 5.742
6.442 5.555 7.006 8.302
6.715 7.319 9.230 10.920
6.679 9.106 11.550 12.290
Water Flow Velocity on Propeller Blades
(N=GOOrpm; Number of blades=3}
:;
ャ]]]MMイMM]]Mエ]⦅M]MMM]MM]ゥZZ⦅ZMZ⦅ZZ⦅ZZ⦅Zセl]]Mj@
セセ@
J_
MM]AMMMMMセMM
--
MMMMMMセMMMMMMMMMMMMMMMMMゥMM]]ᄋMM]]]エLLLNLLセML]MMMェ@
9 L_____
i
.
MセH@ I.!.---·---·
----·--l--·-
:
セMMLN⦅NN」N⦅Mセ@
...セ@
1I
: j
I
セセ」MM]MセMMZM
-1
: r
;r
セセセ]]]]セ]]]}セ@
-_-j
10I
20 : 30 : 40i
50,---MMセMMMMMMMMMZ@ ---!---·--·----: MMMMMMMセGNMMMMMMMM
1-+-r/R=0.4 4.808
!
5.719 : 6.563I
6.885!
6;891f-m-r/R=0.5 4.160
I
5.214 . 5.678 , 7.053I
8.462I
i][ZZMᄋMMMセMMᄋMMM
---
.
i
;
_____
lr _____
ᄋMMMMMMᄋMMᄋMᄋセヲᄋᄋMMMᄋMMMMMMMMMMBMMMMMMMQ@I -· r/R-0.6 4.324 ; 4.910 : 7.463 1 8.371 ; 10.380 .
I
QMセMMM ---1---·---·---r---·-·-·---·-j·---·!--·----··---1
1---+-r/R=0.7 4.165
i
5.726 : 8.068I
10.690 t' 13.780 JlMMᄋMMᄋMMᄋMGᄋMMMセMMMMMMMMᄋMᄋBᄋMMMlMMM セMMMM .. - - - L - -··-- - -··-· - - - · ' ·-·--·- - - - -···-- - - -.. ᄋMMᄋMMMMセ@ Mass Flow Rate (kgs-1)
figure 7. Schematic graph of flow velocity with 3 blades
[image:6.597.61.444.179.623.2]11
10
9
8
Water
Flow Velocity on Propeller Blades
( N=600rpm; Number of Blades=4li 7
セMMMMMMMMMMMMMャMMMMᄋMᄋMMMMl@
G
: i·
Zセᄋ@ セセQセセ{@
AMKMイOr]ッNTイMMᄋMM[[MNSM[[[MᄋMQMMUセVSW@
--1
6.516 •6.678
6.709
--1--·-·----·-·r--·-·· ·-··- ·---·-MᄋMMᄋMMM[MᄋMMᄋMMMᄋMMMᄋMMMKMMMMMMMMMMMMMMMMセMMMMMMMMMMMMMMMᄋ@ ;
j-1!!>-r/R=O.S 1 4.123 i 5.036 : 5.390 • 6.742 ' 8.242 j
QMMMMMMMᄋMᄋMᄋMMMMMMMMMセᄋMᄋMMMMMMMMᄋMMセMMMMMMMᄋエᄋMMᄋᄋM .. ·-·--·---·---L----·--·---·t·-·---·-·---···-·-·--·--,---·-·--.. -·-·--·---1
ゥᄋᄋエセCイOr]PNVQ@ 4.287 ! TNYPセ@ 6.721
i
8.671 ' 10.930 )イ]]MセQr]PZWヲ@ 4.005 s.825 1
--7.90-J ____
i
_lo:Si0_-;-10.930---1
Mass Flow Rate {kgs-1)
GMMMMMMMMMMMMMMMMMMMMᄋMᄋMMMMMMMMMMMMMMMMMMMMセ@
14
13
12
;:;;-
11"'
E 10?; 9
·;:;
8
0
di
> 7
6
5
'!--,!;·-
r/R=O.G-"'"-r/R=0.7
Figure 8. Schematic graph of flow velocity with 4 blades
Water
Flow Veloity on Propeller Blades
{N=600fpm; Number of blades=S)ᄋMMᄋMMMMMMMtMMMMMMMQMMMMMMMMゥMMMMMMMMQMセMMMMMMᄋMMMᄋᄋMMQ@
! '
I '
QMᄋMMMMMMMᄋMMᄋᄋMᄋMᄋMᄋᄋMMᄋMMMMMMᄋMAMセMᄋᄋMᄋMMMMMMMᄋMMMMᄋMMMᄋᄋMᄋQMMMMMMMMMᄋMMᄋMイMMMMMMMᄋMM[ᄋMᄋMᄋᄋ@
---1---1
·-·--·---·---f---'---'-;---_,.,,.,c;_ _ _.__ _ _
4.136 5.013 5.401
6.747
8.2544.219 4.949 6.791 8.844 1 .810
MMMMMMMMMᄋMMMMMMMMᄋᄋMMセMゥMMMMMMMMZ@
---T----c--セᄋMMMᄋMMMMMMM -
---3.s17 5.633 8.053 10.480
⦅エ⦅MRZNZZ⦅_セセL⦅L@
___
J
Mass Flow Rate (kgs-1)
Figure 9. Schematic graph of flow velocity with 5 blades
[image:7.595.46.418.67.324.2] [image:7.595.46.437.94.601.2]lntemational Conference and Exhibition on Sustainable Energy and Advanced Materials (ICE SEAM 201 I) Solo-Indonesia. October 3-4, 201 I.
Table 7. Summarize of maximum flow velocity for 5 blades
r/R
0.4
0.7 JO
4.319
Hub to tip ratio (kgs"1)
20 30 40
5.633 8.053 I 0.480
50
13.000
Table 8. Summarize of maximum flow velocity for 6 blades
Hub to tip ratio (kgs-1)
r/R 10 20 30 40 50
0.6 4.224
0.7 5.742 8.302 10.920 12.290
Power output calculation generated by the turbine
In order to derive the power output produced by the turbines, a general calculation can be used. The equation that can be used to calculate the power output as stated below.
P = ripg HQ
Where:
P =Power output produced by turbine
TJ =Efficiency = l'\1urbrnc *Y\grncrator
p = Density of water
g= Gravitational constant H=Head
Q= Flow rate
(I) l'lturbine llgcnerator = 75.65% =85% =89%
In this particular case, water flow rate can be determined by using equation as stated below:
Q=AV
Where: A= (ir/4)(D)2 D = pipe diameter
(2)
All summarized results for the flow velocity can be substituted into both of these equations to determine the power output produce by each turbine involved. Information in Table 9 stated the best selected final results which including power output produced by the axial-flow turbine according to the selected parameters.
Table 9. Overall final results of the analysis together with the power output
• For mass flow rate of 1 Okgs-1:
Number of blades= 3 Hub to tip ratio= 0.4
Maximum value of flow rate= 4.808ms·1
Power output= 67 Watts
• For mass flow rate of30kgs-1:
Number of blades = 6
• For mass flow rate of20kgs·1:
Number of blades= 4 Hub to tip ratio= 0.7
Maximum value of flow rate= 5.825ms·1
Power output= 394 Watts
• For mass flow rate of 40kgs·1 :
Number of blades= 6
Hub to tip ratio= 0.7 Hub to tip ratio= 0.7
Maximum value of flow rate= 8.302ms'1 Maximum value of flow rate= I0.920ms·1
Power output= 562 Watts
• For mass flow rate of 50kgs·1:
Number of blades = 3 Hub to tip ratio= 0.7
Power output= 739 Watts
Maximum value of flow rate= 13.780ms·1
Power output= 932 Watts
4. Conclusions
In this case study, the implementation of simulation analysis software such as CFD plays very important role in order to obtain results at an early stage before proceed to the next levels such as fabrication and the actual experiments. The data collections from the CFD analysis results, also allows inference can be done more easily. Furthermore, the most crucial factors which are the manufacturing costs and overall time consuming can be minimized significantly. CFO software can also shows in simulation way how the water flows between each blades of the axial-flow turbine from the inlet to the outlet of the runner. Therefore, in other words, the implementation of CFO simulation is very helpful as a validation and optimization tools in this case study.
From the analysis results, conclusion can be made that there is influence between hub to tip ratio and number of blades on the performance of the runner. As stated in Table 9, the minimum power output which produced by the turbine was 67 Watts and the maximum value was 932 Watts. However, these values of power output are just as guidelines. In order to validate these values, experiments are needed so that the comparison between the experiments results and analysis results can be done and with this the most optimum results can be achieved.
5. Acknowledgement
The authors would like to acknowledge the financial support given by Universiti Teknikal Malaysia Melaka.
References
Alexander, K.V. and Giddens, E.P. (2008) 'Microhydro: Cost-effective, modular systems for low heads',
Renewable Energy, Vol.28, pp.1379-1391.
Alexander, K.V. and Giddens, E.P. (2008) 'Optimum penstocks for low head microhydro schemes', Renewable
Energy, Vol.33, pp.507-519.
Guoyi, P. (2005) J fャオゥ、セ@ Engineering, Vol.27, pp.1183-1190.
Montanari, R. (2003) 'Criteria for the economic planning of a low power hydroelectric plant', Renewable
Energy, Vol.28, pp.2129-2145.
Sadrul Islam, A.K.M., Islam, M.Q., Hossain, M.Z., Khan, M.I. and Uddin, S.A. (2002) 'Appropriate low head micro-hydro systems for Bangladesh', Jn: Proceedings of Second International Conference on Electrical
and Computer Engineering, 2002, Dhaka, Bangladesh.
Singh, P. and Nestmann, F. (2009) Expeimental Thermal and Fluid Sciences, Vol.33, pp.991-1002.
Sopian, K. and Razak, J.A. (2007) 'Pico-hydro: Clean power from small streams', In: Procr!.f!.dings of the 3rd
WSEAS Internalional Conference on Renewable Energy Sources.
Wu, J., Shimmel, K., Tani, K., Niikura, K. and Sato, J. (2007) J Fluids Engineering, Vol.127, pp.159-168. Zahnd, A. and Kimber, H.M. (2009) 'Benefits from a renewable energy village electrification system',
Renewable Energy, Vol.34, pp.362-368.