Building of the Enabled Web-Based GIS Participation System: A Tool to
Enhance Community Participation in City Development Plan
Anusuriya Devaraju, Nanna Suryana Herman, Shahrin Sahib
Faculty of Information and Communication Technology,
Technical University of Malaysia Melaka (UTeM)
{anusuriya,nsuryana,shahrinsahib}@utem.edu.my
Abstract
This research has been conducted under the frame work of GIS interoperability infrastructure financed by the Malaysian Ministry of Science and Technology. In this paper, we discuss the development and analyze the potential application of the Geographical Information System (GIS) and Internet computing to enhance community participation in the decision making processes i.e. in Local Plan of Block 3, Melaka Tengah district as a model. The focus of this paper is on the designing and development of the enabled Web-based GIS Participation System called, GISPSS. It is considered to be similar to a Real Time Resources Discovery Server but it comprises four main complimentary components: the Map Viewer, the Objection Support, the Planning Process Documentation, and the Web Content Management. The functional features of these components are highlighted. The multi-tiered architecture forms the basis of the Enabled Web-based GIS system has been adopted in this research.
Keywords
: Web-based GIS, Draft Local Plan,Public Participation, Multi-tiered architecture
1. Introduction
Town planning is a discipline of land use planning, which involves and determines how community and the environment will be affected by any changes in future land use. The planning process typically involves many stages such as development growth monitoring, plan review and policy appraisal. The task of monitoring and reviewing plan’s progress involves the assembly and the integration of geographic information [1].
Geographic Information System (GIS) is computer software for capturing, storing, checking, integrating, analyzing and displaying data about the earth that is spatially referenced. GIS is regarded as
a vital display and analysis tool in planning process, used extensively in applications such as land-use mapping, transportation mapping, utilities infrastructure mapping, and natural resource assessment.
An important stage in planning process is the decision making among the parties involved, namely governmental bodies, different stake holders and the community. Harris and Wiener (1998) envision a role for GIS in addressing these challenges, a GIS which ‘seek[s] to broaden the use of digital spatial data handling technologies with the objective of increasing the number and diversity of people who are capable of participating in spatial decision-making’. Therefore the community or popular participation in decision making particularly in determining their community needs is a key success to City Planning. Today, World Wide Web (WWW) is a pervasive part of our everyday lives. With the Web, local authorities able to deliver decision-making environments based around GIS to the public across the Internet, enhancing the community-government relationships.
This paper presents the development of an Enabled Web-based GIS Participation System (GISPSS), in order to enhance the public participation in the preparation of Draft Local Plan. The chosen model is referred to Melaka Tengah district of Melaka State. The district includes 6 blocks. However, we decided to focus on Batu Berendam sub-district, located on Block 3 of Melaka Tengah district for the prototype development.
2. The need of community participation
In Malaysia, Town and Country Planning Act 1976 (Act 172), requires public participation must be included in the stage of objection to the Draft Local Plan. A Local Plan includes written statements (policies) and proposal maps in relation to any proposed development and use of the land, including detailed measures for the improvement of the physical living environment, communications, management of traffic, social-economic well-being, promotion of economic growth, and measures for facilitating sustainable development of the local area.
Under the provision in Section 13 - Publicity in connection with Draft Local Plans:
‘When the local planning authority has prepared a Draft Local Plan, it shall make copies of the Draft Local Plan available for inspection at its office and at such other places as it may determine; and each copy made available for inspection shall be accompanied by a statement of the time, as stated in the notice published in three issues of at least two local newspapers, one of which being in the national language, within which objections to or representations in respect of the Draft Local Plan may be made to the local planning authority’.
The location of the Draft Local Plan exhibition has a significant impact upon its communicability; particularly as it is unlikely that many of the public would make a special journey to view it. For a user, to visit exhibition held in local government offices during working hours, would be time and cost consuming. This also applies to people that cannot reach public participation meetings like the blind, deaf, and those with mobility difficulties. Besides, the hardcopies of local plans and objection forms available during public participation meetings disallow public to both query and manipulate spatial information, let alone submit their views to those responsible for implementing it, see the results, and gain feedback easily [3].
Frequently, public participation meetings are dominated by small, disproportionately vocal groups. Many individuals hesitate to express their concerns and opinions, and ‘rarely if ever emerge as definable actors in the development process’ (Healey et al., 1988). As Stated by [4], this situation shows the need of a specific information sharing infrastructure that able to support to view, retrieve information at different time and places.
From the local planning authority perspective, spatial information concerning planning and development in the forms of hardcopies cannot be organized and updated frequently. Further, there is also need for expensive hard copy print production for the exhibition.
Due to aspects of venue, time, cost and the delivery mechanism, the public consultation process whereby was to allow active participation, has become a failure. In order to build an effective participatory, it is necessary to provide citizens with platform so that the participation process runs well with broader public involvement. As such, Draft Local Plans that are made accessible via Web and GIS technologies can offer an effective public participation channel.
With Web-based GIS serving local plans, access of land-use information and policies through the web is less time consuming, not time-limited and reduces the need for manpower, apart from enables smooth management across local authority. It also provides access to groups that can not reach public participation meetings. It enables for broader public involvement by allowing increased potential anonymity between members of the public putting forward their objections/representations to the proposed plan.
The major benefits to the authority would be to utilize existing digital local plan data and make substantial cost savings in hard copy print production. Moreover, the data inputted by the public can be tailored around processing needs, the information is already in electronic format, and it can often be displayed back to the public instantaneously in terms of a developing consensus.
3. Enabled Web GIS Defined
3.1 Forms of Web-based GIS
It is important to define the different forms of Web-based GIS, before selecting a suitable form for an application. There are currently five forms of Web-based GIS applications [10]:
a. Graphic snapshots of pre-generated maps In this type of applications, maps are generated with GIS software. Then, screen shots of the map are placed in a web document via HTML tags. Snapshots are easy to implement, however they do not support map interaction features.
match the need for interactive mapping or other GIS functions.
c. Map generators
Map generators use a web-based browser form for user to enter map specifications (for instance, location, thematic layers and symbols). The form will be sent to the Web Server. Gateway in web server translates the request and hands it to a GIS server. The GIS server generates an image map and then sent it back to the client. The image map will be displayed via Web Browser. The advantage of map generators is creating custom maps on the demand of users. The disadvantages include lack of access to the raw spatial data, typically-slow speed, limited predefined user choices, and involved setup [10].
d. Real time map browsers
Real-time map browsers provide access to very large spatial databases and allow users to browse, display, query, retrieve, and update maps on line. The request from the client will be processed by the CGI scripts reside on the spatial data server. After data processing, the spatial data server will later send image and data to clients by HTML documents.
e. Real time maps and images
Real-time maps and images use online sensors to supply information to the map. Instead of providing real-time browsing of a static map, a real-time map is generated from sensor data. Real-time images are captured by webcams, communicating to a web server. They include terrestrial cameras as well as satellite based imaging. Satellite photos can provide data that is overlaid on a static map [8].
The Real Time Map Browsers technology is chosen to implement the GISPSS prototype because they have better supports for programming GIS functions and fulfill the requirements of the study. Further, the study also uses a sophisticated spatial data server to enable real-time browsing.
3.2 Web-based GIS Architecture
Typically, there are two strategies to implement ‘Real Time Map Browsers’ technology.
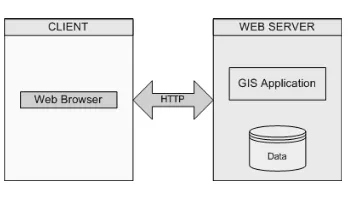
a. Client-side Strategy
In the Client-side Strategy, the client (Web Browser) requires software such as Java applet, ActiveX, or plug-ins and the server supplies the spatial data to carry out complex GIS functions on the client-side. This architecture should not be confused with a similar server-side GIS
architecture that implements a Java applet to create a GUI for the GIS application. In this case, the applet is simply an interface for an image. The complex GIS calculations and data remain on the server.
Figure 1. Client-side Architecture
b. Server-side Strategy
In the server-side strategy, the client indicates the type of map of functions that wishes to execute, and the server passes back the map the client request. Thus, all the complex and proprietary software, in addition to the spatial and tabular data remain on the server. As the application and data are centralized on a server, this allows include simplified development, deployment, and maintenance
Figure 2. Server-side Architecture
In this study, we implement the Server-side Strategy to develop GISPSS because the Draft Local Plan consists of huge volume of spatial layers. To transmit huge data, Client-side Strategy is not preferable because it takes a long of time; also it requires enough disk space and memory at client-side. Further, the Client-side Strategy also has no concern about data security. Another factor that influence on our decision to choose the server-side architecture is the requirement to develop a system ported to various places regardless of the platforms or network capacities.
4. System Requirements
a. Arc Internet Map Server (ArcIMS) - Commercial solution for delivering dynamic maps and GIS data and services via the Web. b. Microsoft Access - Relational Database
Management System used to store external attributes information of geographic features, land use policies, user information, objection information and other planning documentation. c. Internet Information Services (IIS) - Web
Server
d. ArcView GIS – GIS software to edit Shapefile features and update attribute information. e. Macromedia Dreamweaver MX - Web
interface design and development tool.
f. Cold Fusion Server - Interprets ColdFusion Markup Language into a browser-readable format for the client.
5. Major Components of GISPSS
The GISPSS consists of several components as follow:
Figure 3. Components of GISPSS
a. Planning Process Documentation
This component presents text-based information of Written Statement derived from Draft Local Plan on the Web. The aimed of this component is to give a broad understanding of the local plan and its various stages of development. The information includes Introduction (Purpose of the Local Plan, Why Local Plan is needed, Preparation of the Local Plan, Study Area and so on), Development Strategy, and Land-Use Policies.
b. Map Viewer
This component delivers the digital spatial data of the study area via Internet. The map viewer includes basic GIS functions such as pan,
zoom, select, identify and custom search tool. This module also linked to the Objection Support component which allows the users to submit their views or suggestions on the land use activities of proposed development. c. Objection Support
This component is integrated with Map Viewer which enables public to submit their views/suggestions to the municipal, check the status of submission and gain feedback via email notifications.
d. Web Content Management
This is component provides web interface for the implementer to manage the web contents, for example Written Statement of Draft Local Plan. A comprehensive database is constructed to store the written statements of Draft Local Plan. This makes the admin can easily update the documentation. The interface is equipped with several security features to prevent unnecessary exploitation and corruption of data.
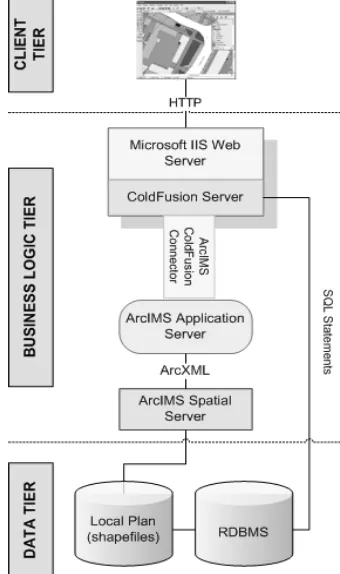
6. GISPSS System Architecture
Figure 4. GISPSS System Architecture
The Client Tier includes Web Browser for accessing, viewing Draft Local Plan. The Business Logic Tier includes IIS Web Server, Cold Fusion Server, ArcIMS Application Server, ArcIMS ColdFusion Server Connector and ArcIMS Spatial Server. The Web Server handles requests from the client using HyperText Transfer Protocol (HTTP).
Once a request is made, the Web Server hands the request to the ColdFusion Server for processing. When the ColdFusion Server spots an ArcIMS custom tag, the information is passed to ArcIMS Cold Fusion Connector. The connector resides on the same machine as the Web Server. Each request establishes a socket connection with the ArcIMS Application Server. Since the Application Server can only process request written in ArcXML (ArcIMS version of XML), the connector translates ColdFusion request into ArcXML before handling the request to the ArcIMS Application Server. The Application Server is the ArcIMS control center that allows the management, maintenance and recovery of map services and the distribution of requests from clients to the ArcIMS Spatial Server.
The Spatial Server are not accessed directly but rather through Virtual Server. The ArcIMS Application Server finds the Virtual Server where the requested service resides and sends the request to one of the Spatial Server instances running on the Virtual Server [5]. The Spatial Server provides the functional capabilities for accessing and bundling maps and data into the appropriate format before sending the data to the Web Browser. The Spatial Server supports component called Data Access Manager which provides a link between the Spatial Server and any data sources.
The Data Tier includes the sources of spatial data (shapefiles) and non-spatial data (external attributes information of geographic features, land-use policies, land-users and their objection information and other web contents). The Spatial Server generates a map and then sends it to client as an image. When the Cold Fusion Application Server receives the response, an HTML page is generated on the fly and sent to the Web Server.
The architecture we have adopted in our study has few advantages. Since all processing is done on the server side, this makes the client much thinner. Besides, the browser compatibility is reduced and the client-side code is not exposed.
7. GISPSS Spatial Data Model
In GISPSS, the data model comprises groups of layers as Figure 5. The digital spatial layers are supplied by the Town Planning and Building
Control Department, Municipal Council of Melaka Bandaraya Bersejarah.
Current Land Use
PHYSICAL PLANNING
Figure 5. Data Model
8. Implementation
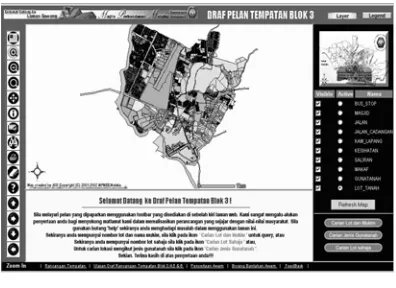
The following section describes implementation of components in GISPSS web system. The Map Viewer (Figure 6) includes map interaction tools such as zoom, pan, identify, and buffer to assist user to explore the local plan. User can toggle between the layer list and a legend in the right-hand portion of the screen which shows the meaning of all the symbols in the map. User may click the Refresh Map button to apply changes to the visible layers. The viewer also includes print function which creates a preformatted map layout in a new window. The browser’s print function can be used to print this window. The users also have option to save preformatted map layout locally, and then submit it via the objection form.
Figure 6. Map Viewer
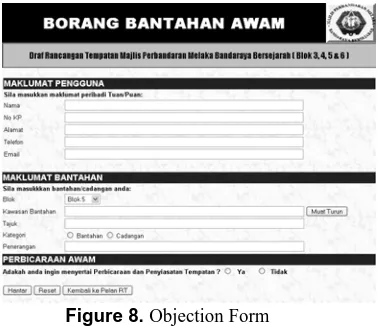
users may view the detailed policies in relation to any proposed development and use of the land (Figure 7). The Results Frame is the area below the map image that is used to display of textual information, such as tabular results, forms for user input (Figure 8) and hyperlinks to policies documents. Each record has a number that can be used to highlight the feature on the map.
Figure 7. Search features by land use.
Figure 8. Objection Form
9. Conclusions and Future Works
The current status of GISPSS development is the integration of Map Viewer component with Planning Process Documentation, Objection
Support components. Our next task will be completing the construction of Web Content Management Component. The future works will centre on completing spatial layers and related database with more parameters. We will also looking into improving the user interface design as most of the targets users are public who require simplified interfaces and user-friendly system. In the long run, we are planning to add a discussion forum concerning Local Plan which is accessible via the Map Viewer. The forum can be extended by allowing participant to illustrate his statements by sketching alternative solutions on the map.
In conclusion, we have presented the potential and benefits of engaging Web-based GIS with district Draft Local Plan implementation and community participation in planning process. With GISPSS, it will be possible to check whether land use development in the district complies with the zoning strategies in the local plan by comparing current land use development with that proposed in the Draft Local Plan. The Objection Support Module helps users to submit their objections with a single click. With Local Plan Written Statements included on the Web, users can gain additional information on the planning process. We believe the stated components are fundamental elements required to opens more opportunity for community participation in the planning process.
10. References
[1] Ahris Yaakup, Susilawati Sulaiman, Ruaidah Idris, “Monitoring the Implementation of State Development Plan Using GIS: The Case of Negeri Sembilan, Malaysia”, Map Malaysia 2006.
[2] Ahris Yaakup, Yazid Abu Bakar, Susilawati
Sulaiman,” Web-based GIS for Collaborative Planning and Public Participation toward Better Governance”, GISDECO, 2004.
[3] Andrew Evans, Richard Kingston, Steve Carver, Ian Turton, “Web-based GIS Used to Enhance Public Democratic Involvement”, Geocomputation 1999, Fredericksburg, USA, 25-28 July 1999.
[4] Suryana, N. and Norayu Abd. Ghani. Role of a Clearing House Server Infrastructure for GIS Interoperability. Business Information Sytems. GI Edition. Lecture Notes in Informatics. Abramowicz and Mayr (eds.) Vol P-85. ISBN3-88579-179-X. ISSN 1617-5468. Klagenfurt Austria. June 2006. [5] ESRI, “ArcIMS 9 - Architecture and Functionality”,
ESRI White Paper, 2004.
www.esri.com/library/whitepapers/pdfs/arcims9arch itecture.pdf [25 July 2007]
[6] Harris, T.M., and D. Weiner. “Empowerment,
Marginalization and Community-Integrated GIS”, Cartography and Geographic Information Systems, vol. 25, April 1998.
[8] Keng-Pin Chang, “The Design of A Web-based Geographic Information System for Community Participation”, Masters Thesis, University of Buffalo, USA, 1997.
[9] Nathan Michaud, Chris Brehme, Robert Snyder, “Towards a living GIS: Enhancing Digital Democracy through Sustained Citizen Participation”, The Annual national conference on Digital Government Research, Boston, MA, 2003. [10] Pima County DOT - Pima County Department of
Transportation, “Developing GIS for the Web”, 1997, Publication medium – Online.
http://www.dot.pima.gov/gis/webdev/