Summary The aerial carbon balance of a 9-year-old hinoki cypress (Chamaecyparis obtusa (Sieb. et Zucc.) Endl.) stand with an aerial biomass of 24.6 MgDW ha−1 was studied over a 1-year period. Various components that constitute gross pro-duction were measured on the basis of the summation method. Respiration of the aerial parts of six sample trees was measured at monthly intervals by an enclosed standing-tree method. The aerial respiration of sample trees was partitioned into growth and maintenance respiration by a two-component model. The growth coefficient varied between 1.2791 and 1.7957 g CO2 gDW−1 giving a mean value of 1.5223 ± 0.0729 (SE) g CO2 gDW−1, whereas the maintenance coefficient ranged between 0.0200 and 0.0373 g CO2 gDW−1 month−1 with a mean value of 0.0299 ± 0.0031 (SE) g CO2 gDW−1 month−1. Growth and maintenance respiration of the stand were estimated to be 8.62 and 10.52 Mg CO2 ha−1 year−1, respectively. An open-top cloth trap method was employed to measure the death of the parts of five sample trees. The death of leaves and total organs in the stand were assessed to be 6.26 and 7.60 MgDW ha−1 year−1, respectively. Tree mortality and biomass increment were 1.47 and 4.64 MgDW ha−1 year−1, respectively. In terms of carbon, respiration, death, grazing and biomass increment were equiva-lent to 5.22, 4.53, 0.04 and 2.32 Mg C ha−1 year−1, respectively. Net production and gross production were estimated to be 6.89 and 12.11 Mg C ha−1 year−1, respectively. Biomass accumula-tion ratio (biomass/net producaccumula-tion) and overall efficiency (net production/gross production) were 1.8 and 0.57, respectively. Keywords: biomass increment, grazing, gross production, growth respiration, maintenance respiration, net production.
Introduction
Forest productivity may be described as the rate of dry matter production, or the carbon balance of a stand, over a specified period. It depends mainly on the rate of carbon fixation relative to the rate of losses due to respiration, tree mortality and the death and shedding of tree parts. Therefore, the significance of net productivity cannot be realized unless it is analyzed from the point of view of the balance between gross production and respiration (Kira and Shidei 1967).
One approach to the analysis of the carbon balance of stands is based on the analysis of the main factors affecting the growth
rate of stands such as leaf photosynthetic properties, radiation interception by canopies, respiration and losses due to the death of tree parts, and tree mortality (e.g., Jarvis and Leverenz 1983, Landsberg 1986). Another approach is the summation method which consists of measuring respiration, biomass in-crement, death and shedding of tree parts, tree mortality, and grazing by herbivorous insects (e.g., Ogawa 1977). Hagihara and Hozumi (1983) compared the two methods on a hinoki cypress (Chamaecyparis obtusa (Sieb. et Zucc.) Endl.) stand and concluded that the two sets of results coincided well with each other. In this study, the summation method was applied to analyze the aerial carbon balance of a 9-year-old hinoki cy-press stand.
In most studies on the dry matter production or the carbon balance of stands, the crucial roles of processes like growth and maintenance respiration were not considered because growth respiration (energy expended in the production of new tissue) was not distinguished from maintenance respiration (energy expended by plants in staying alive). In this study, an attempt was made to partition respiration into growth and maintenance respiration.
Materials and methods
Site description and plant materials
The study was conducted on a 9-year-old (as of 1992) hinoki cypress (C. obtusa) stand in an experimental field of the School of Agricultural Sciences, Nagoya University, Japan, from July 1992 to June 1993. Tree density and aerial stand biomass were 10148 trees ha−1 and 24.60 MgDW ha−1, respectively, at the beginning of the experiment, and 9527 trees ha−1 and 29.24 MgDW ha−1, respectively, at the end of the experiment. The field was established on a flat area at 50 m above sea level. Annual precipitation and mean air temperature during the experimen-tal period were 1442 mm year−1 and 15.1 °C, respectively.
A small census was carried out at monthly intervals on all trees in the stand to measure tree height, stem girth at the crown base and stem girth at 50-cm intervals. From the measure-ments, stem volume was calculated based on Smalian’s for-mula (e.g., Avery and Burkhart 1994). Hagihara et al. (1993) examined an allometric relationship between aerial tree phy-tomass, wT (kgDW tree−1), and stem volume, vs (dm3 tree−1), for
Carbon balance of the aerial parts of a young hinoki cypress
(
Chamaecyparis obtusa
) stand
STEPHEN ADU-BREDU, TAKETO YOKOTA and AKIO HAGIHARA
Forest Ecophysiology Laboratory, Forest Sciences Division, School of Agricultural Sciences, Nagoya University, Nagoya 464-01, Japan
Received March 2, 1995
55 destructively sampled hinoki cypress trees at four different sites and found the strong relationship, wT = 0.626vs0.954 (R2 = 0.991). This relationship was used to estimate the aerial phy-tomass of individual trees. Stand biomass, y (MgDW ha−1), was estimated from the summation of the phytomass of individual trees in the stand as:
y =
∑
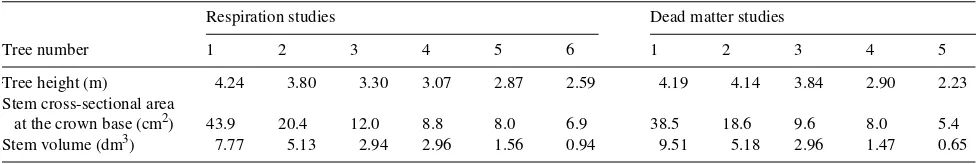
Six and five representative sample trees were chosen for respiration and dead matter studies, respectively. The general features of the sample trees are given in Table 1.
Respiration measurement
Nighttime respiration of the aerial parts of the sample trees was measured at monthly intervals by an enclosed standing-tree method (Ninomiya and Hozumi 1983, Yokota et al. 1994). The aerial parts of a sample tree were enclosed in a transparent assimilation chamber made of 0.2-mm thick polyvinyl chlo-ride film (Takafuji Chem. Co., Kanagawa, Japan). To ensure that the chamber was gas tight, potter’s clay was applied to the base of the stem before the skirt of the chamber was tied to the base. Air temperature inside the chamber was monitored with a thermometric sensor installed at 1.0 m above the ground. A fan was also installed to mix air inside the chamber to mini-mize fluctuations in CO2 concentration. To facilitate gas sam-pling, the air was circulated by a pump through vinyl pipes among three different intakes (top, middle and bottom of the chamber) and a gas sampling nozzle outside the chamber at a rate of 8 dm3 min−1. From dusk to dawn, 20-cm3 micro syr-inges were used to collect five gas samples at a time from each sample tree at 2-h intervals. The gas samples were immediately analyzed with an infrared gas analyzer (URA-2S, Shimadzu Seisakusho Ltd., Kyoto, Japan).
Nighttime respiration rate, r (mg CO2 tree−1 h−1), was calcu-lated from mean CO2 increment rate in the chamber, dC/dt (ppm tree−1 h−1), mean air temperature in the chamber, θ (°C),
Taking the nighttime respiration rate, Q10 for dark respiration
(Paembonan et al. 1991), and monthly mean air temperature into consideration, monthly dark respiration rate was esti-mated (Yokota et al. 1994).
Dead matter measurement
A cloth-trap method proposed by Miyaura and Hozumi (1985) was employed in this study. Each sample tree was partly enclosed by an open-top litter trap, and the skirt of the trap tied to the stem below the base of the crown to trap all falling dead organs. At monthly intervals, the traps were emptied of all accumulated dead organs, and in addition, all currently at-tached dead organs were clipped from the sample trees. Dead branches were defined as branches bearing nonliving leaves. The collected materials were sorted into leaves, branches, reproductive organs, bark and insect feces, oven-dried at 85 °C for 48 h, and then weighed after 24-h desiccation.
Carbon analysis
For the analysis of carbon content in living trees, one tree was harvested and subjected to the stratified clipping method, in which strata were 0--0.3 m, 0.3--1.3 m and at intervals of 1.0 m upward. Stem, branch and leaf samples from each stratum were collected for the analysis. Samples of dead leaves and branches, and insect feces were also used for the analysis. The samples were oven-dried at 85 °C for 48 h and then ground. Subsamples were taken and used for analysis of carbon content with a C-N analyzer (MT 500, Yanagimoto MFG. Co., Kyoto, Japan).
Results Carbon content
There was no significant difference in carbon content between living and dead organs. The carbon concentration of organs ranged between 45.9 and 54.7% with a mean value of 50.0 ± 0.43% (SE), though it decreased slightly from leaves to branches to stems. Therefore, biomass and dead matter were converted to carbon amount using the mean carbon concentra-tion. The carbon concentration of insect feces was 39.0%.
Partitioning of respiration into growth and maintenance respiration
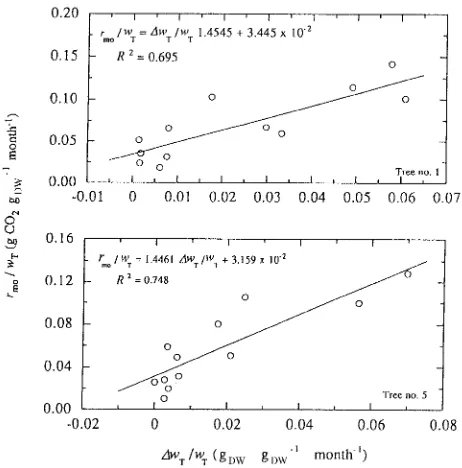
Monthly respiration rates were partitioned into growth and maintenance respiration rates based on a two-component model. The specific respiration rate, rmo /wT (g CO2 gDW−1 month−1), was correlated to the relative growth rate, ∆w/wT
Table 1. General features of the sample trees in June 1992.
Respiration studies Dead matter studies
Tree number 1 2 3 4 5 6 1 2 3 4 5
Tree height (m) 4.24 3.80 3.30 3.07 2.87 2.59 4.19 4.14 3.84 2.90 2.23 Stem cross-sectional area
(gDW gDW−1 month−1) (Figure 1). This correlation was approxi-mated by the following linear equation (Hesketh et al. 1971):
rmo wT
= g ∆wT wT
+ m, (3)
where the slope of the regression, g, is the growth coefficient, signifying the energy expended in the synthesis of a unit phytomass, and the intercept, m, is the maintenance coeffi-cient, signifying the energy expended to maintain the integrity and function of a unit phytomass.
The growth coefficient of six sample trees ranged between 1.2791 and 1.7957 g CO2 gDW−1 with a mean value of 1.5223 ± 0.0729 (SE) g CO2 gDW−1. These values are similar to the value of 1.60 g CO2 gDW−1 calculated by Havranek (1985) for the direct cost of wood production by Larix decidua Mill.
The maintenance coefficient ranged between 0.0200 and 0.0373 g CO2 gDW−1 month−1 with a mean value of 0.0299 ± 0.0031 (SE) CO2 gDW−1 month−1. However, these values are low compared with the values of 0.1522 to 2.1306 g CO2 gDW−1 month−1 summarized by Jarvis and Leverenz (1983) for herba-ceous plants. Hole and Barnes (1980) found that, in bulky tissues, m decreases with increasing age. Such a decline in m may result from progressive increase in the proportion of woody tissues with very low maintenance costs, which is a characteristic of woody plants.
Equation 3 can be rewritten as:
rmo= g∆wT + mwT, (4)
where the first term on the right-hand side (g∆wT) denotes the monthly growth respiration rate, and the second term (mwT) denotes the monthly maintenance respiration rate. Annual growth and maintenance respiration rates were calculated by the summation of the respective monthly rates over the year (Yokota and Hagihara 1995).
Dead matter
The death of organs occurred mainly in October and Novem-ber. The composition of the annual dead organs of sample trees is presented in Table 2, together with the fall of insect feces. Of the total dead organs, dead leaves constituted between 70 and 90%, dead branches between 7 and 23%, reproductive organs between 0.1 and 7%, and bark only between 0.1 and 0.6% of the total.
Insect grazing
The fall of insect feces varied between 2.6 and 12.6 gDW tree−1 year−1 (Table 2). Considering the correction factor of the weight loss of feces in traps (Furuno 1972) and the ratio of leaves eaten by insects to their feces (Furuno and Yamada 1974), Hagihara et al. (1978) concluded that grazing by her-bivorous insects amounts to 1.6 times insect feces. Grazing by insects was therefore estimated to be between 4.2 and 20.2 gDW tree−1 year−1, giving a mean value of 10.14 ± 2.68 (SE) gDW tree−1 year−1.
Figure 1. Examples of the correlation between specific respiration rate, rmo /∆wT, and relative growth rate, ∆wT/wT.
Table 2. Composition of the dead organs (in gDW tree−1 year−1) from July 1992 to June 1993.
Components Tree number
1 2 3 4 5
Leaves 1123.9 607.4 214.2 202.0 89.0
(76.7%) (86.5%) (88.0%) (79.7%) (70.9%)
Branches 330.2 92.6 16.5 50.0 27.5
(22.6%) (13.2%) (6.8%) (19.7%) (21.9%)
Reproductive organs 1.3 0.9 12.0 0.7 8.9
(0.1%) (0.1%) (4.9%) (0.3%) (7.1%)
Pealed bark 9.0 1.6 0.6 0.7 0.2
(0.6%) (0.2%) (0.3%) (0.3%) (0.1%)
Total 1464.4 702.5 243.3 253.4 125.6
(100%) (100%) (100%) (100%) (100%)
Discussion
Respiration of the stand
Stand respiration is the total amount of respiration by individ-ual trees composing a forest stand. Therefore, the respiratory consumption at the stand level can be assessed by clarifying the functional relationship between the respiration rate of a tree and tree size.
To estimate the annual growth respiration of the stand, the annual growth respiration of sample trees, rg (kg CO2 tree−1 year−1), was related to their aerial phytomass increment, ∆wT (kgDW tree−1 year−1), as depicted in Figure 2. The relationship was well approximated by the power function rg = 1.395∆wT0.935 . From this relationship and the annual phy-tomass increment of individual trees in the stand, the stand growth respiration, ∆Rg (Mg CO2 ha−1 year−1), was estimated as:
∆Rg=
∑
i = 1 n1.395∆wT(i)0.935 1 A 10
−3 , (5)
where ∆wT(i) denotes the annual phytomass increment (kgDW tree−1 year−1) of the i-th tree, n is the total number of trees, and A is the area (ha) of the stand. The annual growth respiration of the stand was therefore calculated to be 8.62 Mg CO2 ha−1 year−1, which is equivalent to 2.35 Mg C ha−1 year−1 in terms of carbon.
For the estimation of the annual maintenance respiration of the stand, the annual maintenance respiration of sample trees, rm (CO2 tree−1 year−1), was related to their phytomass, wT (kgDW tree−1), as shown in Figure 3. The relationship could also be well fitted by the power function rm = 0.295wT1.243 . Consid-ering this relationship and the phytomass of individual trees in the stand, the maintenance respiration at the stand level, ∆Rm (Mg CO2 ha−1 year−1), was calculated as:
∆Rm=
∑
i = 1 n0.295wT(i)1.243 1 A 10
−3 , (6)
where wT(i) denotes the phytomass (kgDW tree−1) of the i-th tree in the stand, and the other terms are the same as in Equation 5. The maintenance respiration of the stand was therefore given as 10.52 Mg CO2 ha−1 year−1, which is equivalent to 2.87 Mg C ha−1 year−1 in terms of carbon.
Adding the maintenance respiration to the growth respira-tion gives an annual respiratory consumprespira-tion, ∆R, of 5.22 Mg C ha−1 year−1 (Table 3). The proportions of growth and main-tenance respiration were 45.0 and 55.0%, respectively, giving a ratio of growth respiration to maintenance respiration of 0.82.
Components of net production
The death of organs of a stand can be assessed by combining the tree size distribution of individual trees in the stand with the tree size dependence of the death rate of organs. According to Shinozaki et al. (1964), the amount of leaves per tree should
Figure 2. Dependence of growth respiration, rg, on phytomass
incre-ment, ∆wT.
Figure 3. Dependence of maintenance respiration, rm, on phytomass, wT. The phytomass was calculated as a mean value from the equation
(wT2−wT1)/(lnwT2− lnwT1), where wT1 and wT2 are the estimated
aerial phytomasses at the beginning and end of the experiment, respec-tively.
Table 3. Annual aerial carbon balance of the stand (Mg C ha−1 year−1).
Biomass increment (∆y) 2.32
Death (∆L) 4.53
Leaves 3.13
Others 0.67
Tree mortality 0.73 Grazing (∆G) 0.04 Net production (∆Pn) 6.89
be most closely related to the sum of the cross-sectional areas of living pipes supporting the leaves. The sum in turn could be related to the stem cross-sectional area at the crown base. Because a strong relationship is expected between dead leaves and the amount of leaves present on a tree, and moreover, the amount of dead leaves forms a greater proportion of the total dead materials (Table 2), the annual amounts of dead leaves and total dead organs of sample trees were related to the stem cross-sectional area (cm2 tree−1) at the crown base, as depicted in Figures 4 and 5, respectively. The relationships could be well approximated by the power function wD = kABh, where wD denotes either dead leaves or total dead organs (kgDW tree−1 year−1) per sample tree. The coefficient k was 1.417 × 10⁻² and 1.931 × 10⁻² kgDW cm−2h year−1 in leaves and total organs, respectively, whereas the exponent h in leaves and total organs was 1.247 and 1.211, respectively.
Considering these relationships and stem cross-sectional area at the crown base of individual trees in the stand, the death rate of leaves and the total death rate of organs in the stand were calculated as:
∆L′=
∑
i = 1 nkAB(i)h 1 A 10
−3 , (7)
where ∆L′ denotes either the death rate (MgDW ha−1 year−1) of leaves or total organs in the stand, n is the total number of trees, AB(i) is the stem cross-sectional area (cm2 tree−1) at the crown base of the i-th tree, and A is the area (ha) of the stand. The death rate of leaves in the stand was calculated to be 6.26 MgDW ha−1 year−1, and that for total organs was 7.60 MgDW ha−1 year−1. In terms of carbon equivalent, the dead leaves and total dead organs were 3.13 and 3.80 Mg C ha−1 year−1, respectively. The dead leaves comprised about 82% of the total dead organs. Tree density in June 1992 and June 1993 was 10,148 and 9527 trees ha−1, respectively. The difference, which was 621 trees ha−1 year−1, represents tree mortality and was equivalent to 1.47 MgDW ha−1 year−1, which in terms of carbon is equiva-lent to 0.73 Mg C ha−1 year−1. Adding this to the estimated total dead organs gives a total loss due to death, ∆L, of 4.53 Mg C ha−1 year−1 (Table 3).
From the monthly census of the stand and Equation 1, the aerial biomass of the stand in June 1992 and June 1993 was estimated as 24.60 and 29.24 MgDW ha−1 year−1, respectively. The difference therefore gives an annual biomass increment, ∆y, of 4.64 MgDW ha−1 year−1, which is equivalent to 2.32 Mg C ha−1 year−1 (Table 3). The accumulation of biomass by living trees in the stand was reduced by as much as 24% by tree mortality (tree mortality/(tree mortality + biomass incre-ment)).
Because insect grazing per tree did not depend on tree size but rather on the activity of insects on a tree (Table 2), insect grazing at the stand level was estimated by multiplying the mean grazing per tree, 10.13 gDW tree−1 year−1, by the stand density. The annual grazing by the heterotrophic insects in the stand, ∆G, in carbon equivalent was therefore estimated to be 0.04 Mg C ha−1 year−1 (Table 3).
Net production
Annual net production, ∆Pn, which was estimated by the sum-mation method as:
∆Pn=∆y+∆L +∆G, (8)
was 13.78 MgDW ha−1 year−1, being equivalent to 6.89 Mg C ha−1 year−1 (Table 3). Biomass accumulation ratio (bio-mass/net production) has been used to characterize production conditions in forests communities by Whittaker (1966). It expresses the quantum of biomass retained per unit of net production and roughly represents the mean residence time of biomass. The value in this study was 1.8 years.
On the basis of data from earlier studies (Morikawa 1971, Ogata et al. 1972, Kabaya et al. 1973, Takeuchi et al. 1975, Iwatsubo 1976, Saito 1977, 1982, Sakurai and Ohno 1977, Kawahara et al. 1979, Miyamoto et al. 1979, Saito et al. 1979, Hagihara and Hozumi 1983, Ogawa et al. 1986) and the results of this study, the biomass accumulation ratio was plotted against aerial stand biomass as shown in Figure 6. The biomass
Figure 4. Relationship between the mass of dead leaves, wDL , and
stem cross-sectional area at the crown base, AB.
Figure 5. Relationship between the mass of total dead organs, wDT ,
accumulation ratio was related by a power function to the stand biomass. The exponent of 0.953 suggests that the ratio is approximately directly proportional to the stand biomass. Thus we conclude that mean residence time of biomass in hinoki cypress stands tends to increase with increasing stand age or biomass.
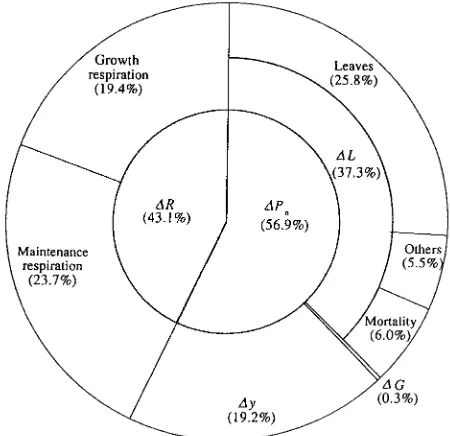
Gross production
Gross production, which was estimated from the summation of the respiratory consumption and net production, was 12.11 Mg C ha−1 year−1 (Table 3). Figure 7 gives a diagrammatic repre-sentation of the allocation of the gross production to produc-tion components. Losses due to respiraproduc-tion, death and grazing were 43.1, 37.3 and 0.3%, respectively, totaling 80.7% of the gross production. Of the loss due to respiration, 19.4% was from growth respiration and 23.7% was from maintenance respiration. The biomass increment was therefore only 19.2%. Overall efficiency, defined as the efficiency with which assimilate is used in the production of new plant material and expressed as the ratio of net production to gross production (Jarvis and Leverenz 1983), was 0.57 in this stand. This value is high compared to the values of 0.33 in an 18-year-old hinoki cypress stand (Hagihara and Hozumi 1983) and 0.38 in a 45-year-old hinoki cypress stand (Tadaki et al. 1966), and supports the finding of Kira (1977) that overall efficiency tends to decrease with increasing stand age or biomass.
Acknowledgments
We are grateful to our colleagues for their valuable field assistance and to Dr. K. Ogawa and Mr. S. Kutsuna for their technical assistance. This study was supported in part by a Grant-in-Aid for Scientific Research (Nos. 03454073 and 05556023) from the Ministry of Education, Science and Culture.
References
Avery, T.E. and H.E. Burkhart. 1994. Forest measurement. 4th Edn. McGraw-Hill, New York, 408 p.
Furuno, T. 1972. Primary consumption by leaf-eating insects in lob-lolly pine canopies. Bull. Kyoto Univ. For. 44:20--37.
Furuno, T. and K. Yamada. 1974. Investigation on the productivity of Japanese fir (Abies firma Sieb. et Zucc.) and hemlock (Tsuga sieboldii Carr.) stands in Kyoto University forest in Wakayama. III. Seasonal variation of litter fall and primary consumption by her-bivorous insects in the mixed fir and hemlock stand. Bull. Kyoto Univ. For. 46:7--22.
Hagihara, A. and K. Hozumi. 1983. Studies on the primary production in a Chamaecyparis obtusa plantation. J. Jpn. For. Soc. 65:357--365.
Hagihara, A., M. Suzuki and K. Hozumi. 1978. Seasonal fluctuations of litter fall in a Chamaecyparis obtusa plantation. J. Jpn. For. Soc. 60:397--404.
Hagihara, A., T. Yokota and K. Ogawa. 1993. Allometric relations in hinoki (Chamaecyparis obtusa (Sieb. et Zucc.) Endl.) trees. Bull. Nagoya Univ. For. 12:11--29.
Havranek, W.M. 1985. Gas exchange and dry matter allocation in larch at the alpine timberline on Mount Patscherkofel. Anst. forst. Ver-suchswes., Bericht 270:135--142.
Hesketh, J.D., D.N. Baker and W.G. Duncan. 1971. Simulation of growth and yield in cotton: respiration and carbon balance. Crop Sci. 11:394--398.
Hole, C.C. and A. Barnes. 1980. Maintenance and growth components of carbon dioxide efflux from growing pea fruits. Ann. Bot. 45:295--307.
Iwatsubo, G. 1976. Plant nutrient cycles in forest ecosystems. On the role of rainfall. In Mountains, Forests and Ecology. Eds. R. Kato, S. Nakao and T. Umezao. Chuokoronsha, Tokyo, pp 313--360. Jarvis, P.J. and J.W. Leverenz. 1983. Productivity of temperate,
de-ciduous and evergreen forests. In Physiological Plant Ecology IV. Eds. O.L. Lange, P.S. Nobel, C.B. Osmond and H. Ziegler. Sprin-ger-Verlag, Berlin, pp 232--280.
Figure 6. Relationship between biomass accumulation ratio, B, and stand biomass, y, of the aerial parts of hinoki cypress stands. Data sources: Morikawa 1971, Ogata et al. 1972, Kabaya et al. 1973, Takeuchi et al. 1975, Iwatsubo 1976, Saito 1977, 1982, Sakurai and Ohno 1977, Kawahara et al. 1979, Miyamoto et al. 1979, Saito et al. 1979, Hagihara and Hozumi 1983, and Ogawa et al. 1986. The result
of this study is shown as d. Figure 7. Graphical representation of the allocation of aerial gross
Kabaya, H., O. Oikawa, T. Satoo, K. Negisi and M. Senda. 1973. Dry matter production and litterfall in a 63-year-old hinoki plantation.
In Ecophysiological Studies on the Establishment of Hinoki Plan-tations. Ed. M. Senda. Grant-in-Aid Sci. Res. Rep., Min. Educ. Sci. Culture, pp 1--16.
Kawahara, T., Y. Tadaki, I. Takeuchi, A. Sato, K. Higuchi and K. Kamo. 1979. Productivity and cycling of organic matter in natural
Fagus crenata and two planted Chamaecyparis obtusa forests. Jpn. J. Ecol. 29:387--395.
Kira, T. 1977. Production rates. In Primary Productivity of Japanese Forests. Eds. T. Shidei and T. Kira. Univ. of Tokyo Press, Tokyo, pp 101--114.
Kira, T. and T. Shidei. 1967. Primary production and turnover of organic matter in different forest ecosystems of the Western Pacific. Jpn. J. Ecol. 17:70--87.
Landsberg, J.J. 1986. Physiological ecology of forest production. Academic Press, London, 198 p.
Miyamoto, M., T. Tanimoto and T. Ando. 1979. Analysis of growth of hinoki (Chamaecyparis obtusa) artificial forests in Shikoku Dis-trict. Bull. Gov. For. Exp. Stn. 309:89--105.
Miyaura, T. and K. Hozumi. 1985. Measurement of litterfall in a hinoki (Chamaecyparis obtusa S. et Z.) plantation by the clothing-trap method. J. Jpn. For. Soc. 67:271--277.
Morikawa, Y. 1971. Daily transpiration of a 14-year-old Chamaecy-paris obtusa stand. J. Jpn. For. Soc. 53:337--339.
Ninomiya, I. and K. Hozumi. 1983. Respiration of forest trees (II). Measurement of nighttime respiration in a Chamaecyparis obtusa
plantation. J. Jpn. For. Soc. 65:193--200.
Ogata, N., Y. Nagatomo, S. Kaminaka and K. Takeshita. 1972. Effects of fertilizer and site quality to dry matter production in hinoki and sugi stands. Ann. Rep. Kyushu Br., Gov. For. Exp. Stn. 15:21. Ogawa, H. 1977. Principles and methods of estimating primary
pro-duction in forests. In Primary Productivity of Japanese Forests. Eds. T. Shidei and T. Kira. Univ. of Tokyo Press, Tokyo, pp 29--37. Ogawa, K., A. Hagihara and K. Hozumi. 1986. Growth analysis of a
seedling community of Chamaecyparis obtusa (II). Primary pro-duction. J. Jpn. For. Soc. 68:135--142.
Paembonan, S.A., A. Hagihara and K. Hozumi. 1991. Long-term measurement of CO2 release from the aboveground parts of a hinoki
forest tree in relation to air temperature. Tree Physiol. 8:399--405. Saito, H. 1977. Chamaecyparis plantations. In Primary Productivity of
Japanese Forests. Eds. T. Shidei and T. Kira. Univ. of Tokyo Press, Tokyo, pp 252--268 and 286--288.
Saito, H. 1982. Primary production over 10 years in evergreen conif-erous (Chamaecyparis obtusa Sieb. et Zucc.) plantation in Mt. Watamukiyama, Shiga. Jpn. J. Ecol. 32:87--98.
Saito, H., H. Matsushita and M. Takeoka. 1979. Net production rates in natural forest of Chamaecyparis obtusa S. et Z. on poor site near Kyoto City. Sci. Rep. Kyoto Pref. Univ., Agric. 31:59--69. Sakurai, S. and K. Ohno. 1977. Regeneration process and primary
production of natural regenerated Chamaecyparis obtusa stands in Nishinokawayama National Forest, Kochi. Trans. Jpn. For. Soc. 88:251--252.
Shinozaki, K., K. Yoda, K. Hozumi and T. Kira. 1964. A quantitative analysis of plant form----the pipe model theory. II. Further evidence of the theory and its application in forest ecology. Jpn. J. Ecol. 14:133--139.
Tadaki, Y., N. Ogata and Y. Nagatomo. 1966. Studies on the production structure of forest. X. Primary productivity of an unthinned 45-year-old stand of Chamaecyparis obtusa. J. Jpn. For. Soc. 44:387--393.
Takeuchi, I., Y. Tadaki, K. Hatiya, T. Kawahara and A. Sato. 1975. Thinning experiment of 30-year-old plantation of Chamaecyparis obtusa. In reference in line-thinning. Bull. Gov. For. Exp. Stn. 272:141--155.
Whittaker, R.H. 1966. Forest dimensions and production in the Great Smoky Mountains. Ecology 47:103--121.
Yokota, T., K. Ogawa and A. Hagihara. 1994. Dependence of the aboveground respiration of hinoki cypress (Chamaecyparis obtusa) on tree size. Tree Physiol. 14:467--479.