Quality incentives in a regulated market with
imperfect information and switching costs:
capitation in general practice
Hugh Gravelle
a,), Giuliano Masiero
ba
National Primary Care Research and DeÕelopment Centre, Centre for Health Economics,
UniÕersity of York, Heslington YO10 5DD, UK b
Department of Economics, UniÕersity of Milan, Milan, Italy
Received 7 August 1999; received in revised form 11 May 2000; accepted 1 June 2000
Abstract
Ž .
We model a system akin to the British National Health Service NHS , in which general
Ž .
practictioners GPs are paid by capitation from general taxation. GPs are horizontally and vertically differentiated and compete for patients via their imperfect observed quality. We show that for any given capitation fee quality is lower and the incentive effects of the fee on quality are smaller when there is imperfect information. There are diminishing welfare gains from improving patient information but increasing welfare gains from reducing switching costs. GPs do not act efficiently to improve patient information via advertising or to reduce the costs of switching.q2000 Elsevier Science B.V. All rights reserved.
JEL classification: I1; L13
Keywords: Switching costs; Imperfect information; Quality; Product differentiation; Capitation;
Gen-eral practice
1. Introduction
Ž .
In the British National Health Service NHS patients join the list of a general
Ž .
practictioner GP , who is paid a tax financed capitation fee for each registered patient. Care is provided free of charge to the patient. In addition to providing
)Corresponding author. Tel.:q44-1904-433663; fax:q44-1904-432700.
Ž . Ž .
E-mail addresses: [email protected] H. Gravelle , [email protected] G. Masiero .
0167-6296r00r$ - see front matterq2000 Elsevier Science B.V. All rights reserved. Ž .
primary care, GPs are the gatekeepers for hospital care. As part of the reforms of the NHS in 1990, capitation fees were increased and it was made easier for
Ž
patients to switch from one GP to another previously a patient’s current GP had
.
to consent formally to the transfer .
The intention of the reforms was to provide greater incentives for GPs to improve the service offered to patients. GPs can vary the quality of their service, for example, increasing their surgery opening hours, employing more practice nurses to provide additional services, being more willing to make home visits, or keeping their medical knowledge up-to-date. Higher capitation fees make it more profitable to attract additional patients by raising the quality of the service provided.
There are three reasons why the reforms might not have the desired effect of improving quality. First, it has been suggested that a patient’s choice among practices is determined mainly by their distance from the patient’s home and that differences in quality will have a very minor impact. This objection does not appear to be valid either theoretically or empirically. Simple product differentia-tion models show that even when all patients choose the nearest practice, practices compete via quality for the marginal patients at the boundary between practices
ŽGravelle, 1999 . Further, most patients do not in fact choose the practice nearest.
Ž .
their home Dixon et al., 1997 : their choice of practice appears to be influenced by other practice characteristics including the number of clinics and opening hours which are attributes of practice quality.
Second, patients are unlikely to be very good judges of quality. The extensive literature on doctor–patient agency problems attests to the prevalence of the belief that patients are imperfectly informed about the quality of their doctors. However, it can be argued that patients can judge many aspects of quality in primary care, which may not be obvious when choosing a practice, when they have experience in them. Examples range from the interpersonal aspects of consultations to the ease of getting appointments or out of hour visits. Thus, at least some aspects of the practice are experience goods. Since on average patients consult their GPs
Ž .
around six times a year General Household Survey, 1998 , patients may learn about such aspects over time.
Third, even if patients become better informed about their practice, they face costs in switching to another GP. Their new GP will be initially less well informed about them than their current doctor will. Medical records are an imperfect substitute for personal contact and are transferred with a significant delay. Thus, in addition to the time and trouble involved in changing registrations, switching to another GP imposes costs in the form of a lower initial level of care ceteris paribus.1
1 Ž .
We investigate these arguments with a simple model which enables us to consider the extent to which switching costs and imperfect patient information about quality interact to blunt incentives for quality. We examine the implications for the level of quality at a given level of the capitation fee, for the incentive to improve quality when capitation is increased and for the welfare maximising quality.
Patient information and switching costs are to some extent endogenous in that GPs can advertise their services and can reduce switching costs by greater effort in acquiring information about new patients when they register. We are also inter-ested in whether competition between GPs leads to appropriate levels of informa-tion and switching costs or whether addiinforma-tional regulainforma-tion is required.
The implications of switching costs and imperfect information for incentives for quality in a regulated market have not been analysed to our knowledge, though there are related studies in the industrial and health economic literature. In a
Ž .
variation of the Salop 1979 circular horizontal differentiation model, Economides
Ž1993 shows when there are fixed costs of quality, the market equilibrium has.
Ž .
inefficient quality. In Gravelle 1999 , there are no fixed quality costs but it is shown that quality is efficient only if the consumers’ preferences are weakly separable in distance costs, consumers have zero income elasticity of demand for quality, and firms’ costs are linear in quantity.
Imperfect consumer information about product quality under horizontal
differ-Ž . Ž .
entiation is considered in Wolinsky 1984 ,Wolinksky 1986 , but consumers have imperfect information about the horizontal characteristics of firms, rather than
Ž .
their vertical quality. Riorden 1986 has variable and imperfectly perceived quality but does not consider switching costs. He shows that when prices act as signals, the equilibrium quality tends to be the full information solution as the
Ž .
number of firm increases. Bester 1998 uses the Hotelling model, keeping the number of firms fixed, and examines the implications of imperfectly observed quality for the location rather than their number.
We apply the standard Hotelling horizontal product differentiation model to the market for primary care by incorporating switching costs and imperfect
informa-Ž .
tion about practice quality. Of the many switching cost models Klemperer, 1995 ,
Ž .
ours is perhaps closest to the two period model of Klemperer 1987 . We introduce
Ž .
additional features endogenous product quality, experience goods . Since we are
Ž .
examining a regulated market, in which prices capitation fees received by GPs are fixed by a regulator and quality is an investment good, we can avoid the analytical complications which arise when producers can vary their price from period to period to exploit locked in consumers. We also do not need to consider the implications of prices signalling quality since prices are regulated.
financed capitation system with regulated capitation and consider how quality is affected by patients’ errors and switching costs. We then consider the implications for the incentive effects of capitation on quality. Section 4 discusses the welfare properties of the regulated market. In Section 5, the implications of GPs being able to change patient information and switching costs are examined. Section 6 summarises our conclusions.
2. The model
GPs receive a capitation payment for each patient who joins their list. The fee is financed from taxation rather than paid directly by patients, and so patients care only about the quality of the practice they join and about its location. Quality is endogenous and determined by an initial investment at the start of the first period and is constant over the two periods.
At the beginning of the first period, n patients are located uniformly along a o Ž o w x.
street of unit length. At the end of the periodg n g g 0, 1 old patients leave y Ž y w x.
the market and a new generation of young patientsg n g g 0, 1 enters. At the end of the second period, all patients leave and none enter.
We assume that preferences, costs, and technology are time invariant and such that the market is covered. Full coverage is ensured by assuming that there is a utility r from joining either practice, which is independent of the quality of the practice chosen and the patient’s location. We assume that r is sufficiently large so that all patients prefer to join some practice rather than none. The full coÕerage
assumption is standard in the switching cost literature. We adopt it here to make our results comparable and also because we are interested in the efficiency of GPs’ choice of quality. When the market is not fully covered, reductions in quality could drive some patients from the market rather than to the other GP. It is well
Ž .
known Spence, 1975; Economides, 1993; Gravelle, 1999 that quality and price are inefficient in such circumstances. We wish to separate the effects of switching costs on the quality of the experience good from other sources of inefficiency.
A practice is located at each end of the street and a patient’s location between them determines his preference for the service characteristics. Patient distance
Ž .
dg 0, 1 can be interpreted as geographical distance or as the difference between the level of some horizontally differentiated service characteristic of the practice and the level which would maximise the utility of that particular patient. td is the patient’s disutility of being located at a distance d from GP A if he joins that
Ž .
practice. t 1yd is the distance cost if he joins GP B. Patients are ex ante
Ž .
identical except for location and age see Table 1 .
2.1. Patient information
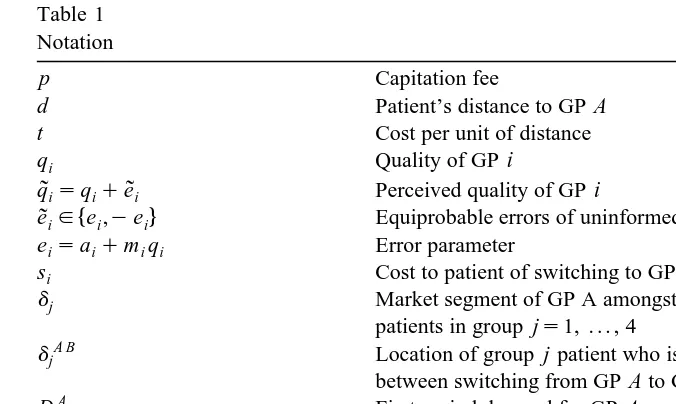
Table 1 Notation
p Capitation fee
d Patient’s distance to GP A
t Cost per unit of distance
qi Quality of GP i
q˜isqiqe˜i Perceived quality of GP i
4
e˜ige ,iyei Equiprobable errors of uninformed patients
eisaiqm qi i Error parameter
si Cost to patient of switching to GP i
dj Market segment of GP A amongst young
patients in group js1, . . . , 4
A B
dj Location of group j patient who is indifferent
between switching from GP A to GP B
A
D1 First period demand for GP A
A A y A o
D2sD2 qD2 Second period demand for GP A
i
V Expected discounted profit of GP A
hi Advertising effort of GP i
eisa0yhhi Effect of advertising on patient errors
l Marginal deadweight loss from taxation
2
bqi Cost of quality
Before joining a list, a young patient has imperfect information about the quality of both practices and observes the quality provided by GP i with an error e :
˜
iq
˜
isqiqe .˜
iŽ .
1An old patient has a perfect knowledge of the quality provided by the list he decided to join in the first period. He does not acquire any information about the quality of the other practice: he makes the same error about it as he did when young.
The errors which young patients make while observing practice quality are identically and independently symmetrically distributed and have zero mean. To keep the analysis tractable, we adopt a simple error structure
1
4
e
˜
ig e ,iye ,i Pr e˜
isei sPr e˜
is yei s , 2w
eisaiqm q ,i i aiG0, mig
Ž
0,1 ,.
isA, B.Ž .
2Ž .
The formulation allows for both purely additive ai)0, mis0 and
multi-Ž .
plicative ais0, mi)0 errors as well as mixed types. Purely additive errors may be somewhat implausible since they imply that the range of perceived qualities does not vary with actual quality. The assumption is sometimes useful for generating unambiguous results.
For the moment, we assume that the parameters in the error distributions are
Ž .
exogenous and the same for both GPs aisa, mism . We relax the assumption
Young patients do not realise that their initial observations are subject to error and never expect to revise their beliefs about quality. This assumption simplifies the derivation of the results and is perhaps not unrealistic in the context of health care.
2.2. Demand from young patients
In the first period when all patients are young, a patient is located at a distance
Ž .
d from GP A and perceives benefits rqq
˜
Aytd and rqq˜
Byt 1yd from joining the list of GPs A and B, compared with joining no list. Care is financed from taxation and practices do not charge prices to their patients.Since young patients do not realise that their perceptions of quality may be in
Ž
error, a patient will choose GP A rather than B if and only if q
˜
AytdGq˜
Byt 1. Ž .
yd . Hence, of the patients whose realised errors are e , e , GP A will get
˜
A˜
B those whose distance from her is not more thanq
˜
Ayq˜
Bqt wqe˜
Aye˜
Bd
Ž
q , q , e , eA B˜
A˜
B.
s sŽ .
32 t 2 t
Ž Ž . .
where wsqAyqBqt. GP B gets the remainder with dg d q , q , e e ,1 .A B
˜ ˜
A B From the distribution assumptions on patients’ errors, the realised values of theŽ .
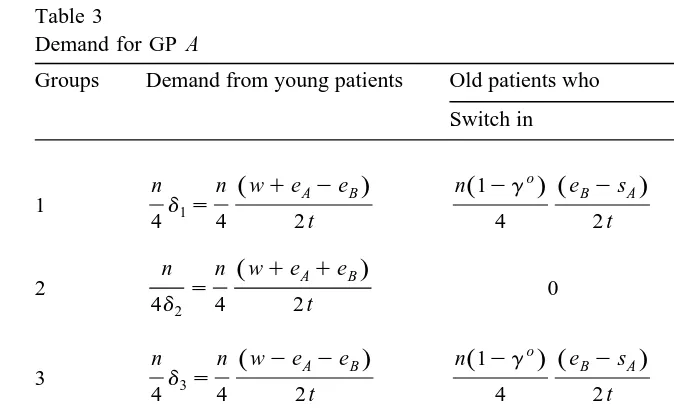
errors define four groups of young patients each of size nr4 Table 3 . For example, patients in group 1 are those who overestimate the quality of both GPs. Demand from patients in the first period in group 1 for GP A is nd1r4 where2
wqeAyeB d
Ž
q , q , e , eA B A B.
s 'd1.2 t
In contrast, the errors made by patients in group 2, who overestimate the quality of GP A and underestimate the quality of GP B, are not offsetting and GP A gets young patients in group 2 whose distance is less than
wqeAqeB
d
Ž
q , q , e ,A B A yeB.
s 'd2. 2 tŽ .
GP A gets a larger proportion of group 2 d1)d2 than GP B because patients
Ž .
overestimate her quality and underestimate the quality of GP B see Table 2 .
Ž .
Using Eq. 3 and making the appropriate substitutions for the error terms for all the patients’ groups, the first period demand for GP A is
4 n w
A
D1s
Ý
djsn .Ž .
44 2 t
js1
GP B gets the remainder of the patients: DB1snyDA1.
2
Strictly, we should say that the demand for GP A from any group of young patients is 0 if
Ž . Ž .
Table 2 Distances
Groups Errors Critical distance for Critical distance for old patients who young patients Switch to GP A Switch to GP B
wqeAyeB B A wqeAysA A B wyeBqsB
Ž .
1 e , eA B d1s d1 s d1 s
2 t 2 t 2 t
wqeAqeB B A wqeAysA A B wqeBqsB
Ž .
2 e ,A yeB d2s d2 s d2 s
2 t 2 t 2 t
wyeAyeB B AwyeAysA A B wyeBqsB
Ž .
3 ye , eA B d3s d3 d3 s
2 t 2 t 2 t
wyeAqeB B A wyeAysA A B wqeBqsB
Ž .
4 ye ,A yeB d4s d4 s d4 s
2 t 2 t 2 t
Provided that the error distribution is symmetrical and unbiased for each GP, the errors made by young patients will be offsetting in total. The size of the error parameters has no effect on the total demand for either GP. However, notice that some of the patients in groups 2 and 3 whose errors are not offsetting make the wrong choice of GP even when observations of the quality of both GPs are subject to the same error distribution.
2.3. Second period demand
Ž o.
In the second period, a proportion g of the first period cohort leaves the market and gyn new patients enter. Old patients have experienced, the service actually provided by the practices they joined in the first period. They now evaluate the quality of that GP correctly. They do not acquire any further information about the quality of the GP they did not choose.3 Old patients who decide to change to GP i incur a switching cost of s . Initially, we assume thati switching costs are the same for both practices and relax this assumption in Section 5.3.
In period 2, old patients must decide whether to switch GPs. If an old patient originally underestimated the quality of his current GP, he will not switch when old. He has now revised the estimate of the quality of the practice chosen upward and has not changed his estimate of the quality of the other GP. Only those patients who overestimated the quality of their GP when young will consider
3
switching to another GP. Patients in groups 2 and 4, who chose GP B when young never switch to GP A when old because they revise their estimate of the quality of GP B upward. Similarly, patients in groups 3 and 4 who chose GP A when young never switch to GP B.
For a patient who overestimated the quality of his chosen GP i the perceived gain from practice i compared with practice j falls by eiys . He has revised hisj
estimate of the quality of practice i downward by e but if he moves to j, hei incurs a switching cost s . A patient who was just indifferent between the twoj practices will switch, provided that eiysj)0. We assume that switching costs are less than the error parameter so that some old patients who overestimated the quality of their chosen GP will switch in the second period. Other patients who overestimated the quality of their GP may switch but will have had a positive preference for the GP chosen because they are closer to the practice. They will switch if they are not too far from the other GP.
Consider, for example, old group 1 patients of GP A. They now know that they will have a utility from GP A of rqqAytd and perceive the utility from GP B,
Ž .
net of the cost of switching, as rqqBqeBysByt 1yd . Only those group 1
patients of GP A, whose distance is greater than
wyeBqsB A B
d1 s -d1
Ž .
52 t
will switch to GP B. Since GP A had all of group 1 whose distance was not more
Ž o.Ž A B.
than d1, she loses nr4 1yg d1yd1 of her group 1 old patients to GP B. GP B will also lose some of her old group 1 patients who overestimated her quality and believe that the increase in quality, net of any change in distance cost,
w Ž
from switching to GP A outweighs the cost of switching: q
˜
Aytdy qByt 1y.x
d )s . GP B will lose those group 1 patients for whomA
wqeAysA B A
d-d1 s )d1
Ž .
62 t
so that they are close enough to GP A to make a switch worth while. Since GP B had all group 1 patients for whom d)d1, the number of old group 1 patients who
Ž o.Ž B A .
switch to GP A is nr4 1yg d1 yd1 .
Proceeding similarly for the patients in group 2 who chose GP A and the patients in group 3 who chose GP B, we get Table 3 which shows the number of old patients who switch in and out in each group.4 Of the group 2 patients, only those patients who chose GP A consider switching when old. Those with dg
ŽdA B,d . will switch, where dA B Ž .
s wqe qs r2 t. Of the group 3 patients,
2 2 2 B B
only those who chose GP B consider switching and those who do switch have
Ž B A. B A Ž .
dg d3,d3 whered3 s wyeAys 2 t.A
4We are restricting attention to situations in which the critical distancesdA B,dB A Žjs1, . . . , 4.
j j
Table 3
Demand for GP A
Groups Demand from young patients Old patients who
Switch in Switch out
o o
n n ŽwqeAyeB. n 1Ž yg . ŽeBysA. n 1Ž yg . ŽeAysB.
1 d1s
4 4 2 t 4 2 t 4 2 t
o
n n ŽwqeAqeB. n 1Ž yg . ŽeAysB.
2 s 0
4d2 4 2 t 4 2 t
o
n n ŽwyeAyeB. n 1Ž yg . ŽeBysA.
3 d3s 0
4 4 2 t 4 2 t
n n ŽwyeAqeB.
4 d4s 0 0
4 4 2 t
w ŽeBysA. ŽeAysB.
A Ž o. Ž o.
All D1sn n 1yg n 1yg
2 t 4 t 4 t
Ž B A.
Adding the proportion of old patients who switch in S and deducting the
Ž A B. ŽŽ o. A.
proportion of those who switch out S to the installed base 1yg D1 gives the demand for GP A from old patients as
A o o A B A A B
D2 s
Ž
1yg.
D1 qS ySn e
Ž
BysA.
n eŽ
AysB.
o A
s
Ž
1yg.
D1q y .Ž .
74 t 4 t
Note the effects of errors and switching costs on the demand for GP A. from old patients:
1. increases in the error parameter e increase the number switching into the listA of GP B;
2. increases in the cost of switching to GP A reduce demand from old patients.
Thus, as we will see in Section 5, each GP has an incentive to reduce the costs of patients switching in and to provide information to reduce patient errors about her practice.
y A Ž .
young patients for GP A in period 2 is given byg D . Adding Eq. 7 gives the1
total second period demand for GP A
DA
sDA y
qDA o
s 1qgy
ygo DA
q 1ygo SB A
ySA B 8
Ž
.
Ž
. Ž
.
Ž .
2 2 2 1
B Ž y o. A
The demand for GP B is D2sn 1qg yg yD .2
3. Regulated market
3.1. Equilibrium quality
Ž .
The NHS is a regulated market where the tax financed capitation fee p per
patient on the GP’s list is set by the government and patients face a zero price for joining a practice list. Quality is the only way in which GPs can compete for patients. The regulator cannot control quality directly and we are interested in the extent to which he can influence it indirectly via the regulated capitation fee.
GPs have identical cost functions and incur a constant unit cost per patient in each period of c. Practices make an investment in quality at a cost of bq2 before
the young patients in period 1 decide which practice to join. Practice quality is constant over the two periods and is an excludable public good in that its cost is independent of the number of practice patients. Examples are investment by the GP in a computer system for patient records or good practice facilities or in
Ž .
undergoing training for example in minor surgery . The discounted expected profit of GP i is
Vis
Ž
pyc.
Ž
Di1qkD2i.
ybqi2qfŽ .
9Ž .
where, kg 0, 1 is the discount factor on future earnings and f is remuneration which does not vary with the number of patients.5 We assume that f is always
large enough to ensure non-negative Vi so that the GPs are always willing to participate.
Doctors take their competitor’s choices as given and non-cooperatively max-imise expected discounted profit by their investment in quality at the beginning of period 1. We consider only pure strategy Nash equilibria, and since the GPs have identical preferences, cost and demand functions, look for a symmetric solution.
iŽ . The obvious way to proceed is to set the partial derivative of V q , qi j with respect to q equal to 0, impose qi Asq and solve for the equilibrium quality q.B
ˆ
AŽ . AŽ .
Provided that V q, q
ˆ ˆ
)V q , q for all qAˆ
A/q, and analogously for GP B, theˆ
procedure would yield the unique symmetric Nash equilibrium q. Unfortunately,
ˆ
AŽ . AŽ .
establishing that V q, q
ˆ ˆ
)V q , q for all qAˆ
A/q, and analogously for GP B,ˆ
is not straightforward despite the apparent simplicity of the demand functions and
5
the convexity of cost in quality. The demand functions are piecewise linear in quality so that the marginal revenue from quality is a step function. Worse, marginal revenue could be stepwise increasing and then stepwise decreasing, so that the objective function is not concave in quality.
Suppose that when qBsq and GP A sets q
ˆ
As0, she gets no young patients, even from group 2 patients who overestimate her quality and underestimate the quality of GP B. Hence, a-qˆ
yeˆ
yt where eˆ
saqmq, so that even group 2ˆ
patients for whom ds0 prefer GP B. As GP A raises her quality above zero with
qBsq she at first has no patients but further increases in q enable her to capture
ˆ
A some of the young group 2 patients who overestimate her quality and underesti-mate the quality of GP B. Her marginal revenue increases discontinuously at this point. Increases in quality enable her to start capturing young patients from groups 1 and 4 who make offsetting errors. Her marginal revenue steps up again. As quality increases further, she is able to serve some of the group 3 patients who underestimate her quality and overestimate q . Marginal revenue is now at itsB maximum since she gains patients in all four groups as qA increases. Eventually, she will have all the patients in group 2 and marginal revenue will drop discontinuously. As her quality increases further she will gain all the consumers in groups 1 and 4, leading to a further drop in marginal revenue. Finally, she captures all the group 3 and her marginal revenue drops to zero. Thus, the marginal revenue from young consumers is stepwise increasing and then decreasing and their demand function has a piecewise linear ‘S’ shape. Allowing for the effect of quality on the numbers of old patients complicates the story, but yields the same conclusion.To avoid the complications resulting from the non-concavity of the GP objective functions, we place a weak restriction on the parameters of the model. It
iŽ ensures that the marginal revenue function has only downward steps so that V q ,i
.
q is concave in q and there is only one symmetric Nash equilibrium.
ˆ
iProposition 1. There is a unique symmetric Nash equilibrium in qualities
n p
Ž
yc.
vq p,
ˆ
Ž
P.
s , pGc4bt
Ž .
10s0, p-c
[( o)( ) y)]
where vs1qk 1yg 1ymr2 qg , proÕided that the existence
condi-( )
tion tyq 1
ˆ
qm y2a)0 is satisfied.Ž . iŽ .
Proof. Sketch The quality q defined by V
ˆ
q i q, qˆ ˆ
s0, isA, B is the onlyiŽ .
symmetric Nash equilibrium if V q , q is strictly concave in q . If the existencei
ˆ
iŽ .
condition t)q 1
ˆ
qm q2 asqˆ
qeˆ
qa holds then GP A has young patients ingroup 3 who underestimate her quality and overestimate the quality of GP B even when qAs0, qBsq. Hence, she has young patients in all groups at q
ˆ
As0,the first to be monopolised by GP B are those in group 1 who chose her practice when young. At qAs0, qBsq GP A will retain some of this group, who now
ˆ
correctly perceive her quality but still overestimate q , provided that 0B )q
ˆ
qeˆ
yt ysB which is implied by the existence condition. Hence, if the existence condition is satisfied, GP A will have patients from all groups, young and old when qAs0, qBsq, and her marginal revenue from quality increases is constantˆ
until she starts to monopolise the groups, at which points marginal revenue is discontinuous downward. The same argument applies to GP B. Thus, if the existence condition holds, both GPs have identical objective functions, which are
Ž .
strictly concave in their own quality at q, q . The condition can be written as the
ˆ ˆ
Ž . Ž .
requirement that a quadratic function H t is positive. It is easy to show that H t is convex so that there exists a t such that H1 )0 for t)t and the existence1
condition is satisfied. I
3.2. ComparatiÕe statics
The comparative static properties of the regulated equilibrium are
straightfor-Ž .
wardly derived from Eq. 10 .
Proposition 2. The regulated equilibrium quality is increasing in the proportion of
( y) ( )
patients who enter the market in the second period g , the discount factor k , and decreasing in the proportion of patients who leaÕe the market after the first
( o) ( ) ( )
period g , the cost of quality b , distance costs t , and the multiplicatiÕe error
( )m . AdditiÕe errors a and switching costs s ha( ) ( ) Õe no effect on quality.
Ž . Ž .
Switching costs s and additive errors a have no effect on equilibrium
quality. They enter additively into GPs’ demand functions and are equal for the two GPs and therefore offsetting. They do not interact with quality and do not affect the marginal revenue from quality changes and so have no effect on the profit maximising quality.
If the errors which patients make in judging quality are multiplicative, the equilibrium is affected by patient misperceptions: multiplicative errors reduce the equilibrium quality for any given capitation fee. Quality is lower even though, on average, patients estimate quality correctly before they have joined a practice and can observe quality perfectly after experiencing it. The greater the error, the more
Ž Ž ..
likely are old patients to switch to the other GP see Eq. 7 . Since higher quality leads to greater errors, the gain to a GP from increasing quality is reduced.
Ž o.
quality. Increasing the proportion of old patients 1yg reduces quality because demand from young patients is independent of quality.
Quality is also lower the more consumers care about their distance from the practice, i.e. the larger is their distance cost parameter t. A higher t means that patients place more weight on location relative to quality when comparing practices, thereby reducing practices’ incentives to compete via quality.
3.3. IncentiÕe effects of capitation
Ž .
We can also use Eq. 10 to investigate the arguments about the implications of imperfect information and switching costs on the ability of a regulator to influence quality by raising the capitation fee.
Proposition 3. Increases in the capitation fee increase quality. The marginal
effect of the capitation fee on equilibrium quality decreases with multiplicatiÕe
( ) ( ) ( )
error m , distance cost t , the marginal cost of quality b , and the proportion of ( o)
patients leaÕing the market after the first period g , increases with the size of
( ) ( )
the population n , the proÕider discount factor k and the proportion of new
( y)
patients entering the market g , and is unaffected by additiÕe errors and
switching costs.
Increasing capitation fees to make patients more valuable for practices does indeed lead to higher quality even when patients also care about distance, are imperfect judges of quality and face costs in switching when they become better informed. However, the positive impact of the fee on quality is affected by distance costs and multiplicative errors so that a higher capitation fee is necessary for any required level of quality.
One might expect that increases in the capitation fee would increase practice
ˆ
profit and thus ease the participation constraint ViG0. In fact, substituting the
Ž . i
equilibrium quality q p,
ˆ
P into V shows that discounted practice profit is quadratic in p and is decreasing for sufficiently high capitation fee. The apparent exception to the envelope theorem arises because although the capitation fee increases Vi for given q , it also induces the other practice to increase its qualityi and increases in q reduce Vi.
j
4. Welfare
The welfare function is
o y
Wsn q
Ž
yc.
1qk 1Ž
yg qg.
2 o y
ynTy2bq yl
2 fqn 1qk 1Ž
yg qg.
p4
Ž .
payments to GPs. Welfare is the sum of patients’ surpluses and GPs’ profits less the cost of taxes levied to finance payments to GPs. Equivalently, since any payments to doctors are exactly offset by payments by taxpayers, welfare is the sum of patients’ willingness to pay for the quality of service received less their distance and switching costs, the costs of providing the service and of tax financing the payments to providers.
The welfare function is paternalistic in that welfare is assumed to be depending on actual realised patient benefits, not their perceived benefits. It also implies that individuals are not considered to be the best judges of their own welfare because of their mistaken beliefs.
Since the equilibrium is symmetric with GPs taking the same decisions and we are interested in regulation of those decisions, we evaluate the welfare function at
qAsqBsq. Since the market is always covered so that every patient joins a list,
w Ž o y.x 6
the total gross benefit to young and old generations is n 1qk 1yg qg q,
where k is the social discount factor.
4.1. Distance, error, and switching costs
Patients incur distance costs and some of them also incur switching costs. These costs differ with the errors made by patients and with their generation. Patients in group 1 overestimate the quality of both GPs. There are two subgroups defined by the GP chosen. When they are old and have acquired better information about the quality of their current GP some of them switch to the other GP in period 2. There are four subgroups of old group 1 patients defined by the GP chosen when young and whether the patient stays or switches to the other GP.
Patients in group 2 overestimate the quality of GP A and underestimate the quality of GP B when they are young. Their choice of practice defines two young subgroups. When they are old and have acquired information about the quality of the practice chosen those who chose GP A and overestimated her quality may decide to switch to GP B. Those who chose GP B never switch because they revise upward their beliefs about her quality. There are three old subgroups: those who stay with practice A, those who move to practice B, and those who stay with practice 2. Similarly, there are five subsets of young and old group 3 patients.
Group 4 patients underestimate the qualities of both GPs when young. Since they revise their beliefs about the quality of the chosen practice upward and do not change their beliefs about the quality of the other practice, none of them switch when old. There are two subgroups of young and old patients defined by their choice of practice.
6 Ž .
Patients get utility of rqq from their practice gross of distance costs but since r is constant and
The costs incurred by patients who are young in the first and second period are
nTy and ngy
Ty, respectively, where Ty the average cost per young patient is7
2
t t e
y
T
Ž
e; t.
s qž /
.Ž .
114 2 t
Ž o. o
The total costs for old patients are n 1yg T , where
t 1 1
o 2 2
T
Ž
e, s; t.
s qŽ
e qs.
qŽ
eys s ..
Ž .
124 4 t 2 t
The first term inside the square brackets in each equation is the distance cost which would be incurred if there was perfect information: patients of each generation would choose correctly and would on average be located 1r4 units of distance away from their chosen practice and incur average distance costs of tr4. The second terms are the welfare losses arising from poor information. Some patients choose the wrong GP and incur too great a distance cost. These mismatch costs increases with the errors made by patients. They also increase with the switching costs of old patients, which prevent some old patients from switching to a GP with smaller distance costs. The third term in To is the cost of switching: the proportion of old patients switching multiplied by the cost per switch.
Adding up the costs of young and old patients gives the total discounted distance, error, and switching costs as
y y y o o
nTsn T
qk g T qŽ
1yg.
T4
.Ž .
134.2. Costly switching and welfare
The ability of patients to switch GPs has different effects on the welfare of different patient groups. Group 1 patients who overestimate the quality of both GPs are made worse by the ability to switch. Since their initial errors were offsetting, they chose the correct practice when young. Acquiring perfect informa-tion about their chosen practice leads them to revise their quality estimate downward and some of them incur switching costs to switch to the other practice. Given that they have overestimated the quality of the GP they switch to, they choose the wrong GP and incur unnecessary distance and switching costs.
Groups 2 and 3 patients have reinforcing rather than offsetting errors: they overestimate one GP’s quality and underestimate the other GP’s. Those who chose the practice whose quality they overestimated consider switching when old and better informed. Those who do switch will in fact be better off since the actual quality at the new doctor is better than their expectations. Indeed, not enough of
7
them switch because of their underestimation of the quality of the alternative practice. Thus, groups 2 and 3 patients are better off if switching is feasible and not too costly.
Group 4 patients make offsetting underestimates and make the correct choice of GP. Since their experience reinforces their choice, they never switch and hence, do not gain from the ability to switch.
If patients were not allowed to switch, old patients would not incur switching oŽ costs but would have mismatch costs equal to those for young patients: T e, `;
. yŽ . Ž . Ž . yŽ . oŽ .
t sT e; t . Comparison of Eqs. 11 and 12 shows that T e; t )T e, s; t
provided that e)s. Hence, we have
Proposition 4. Switching is welfare increasing eÕen though imperfect patient
information leads some patients to switch to a practice which is worse for them.
4.3. Optimal quality
The regulator cannot observe quality directly but knows the equilibrium quality
Ž .
function q p,
ˆ
P and chooses the capitation fee p and the lump sum payment f toˆ
i iŽ .maximise W subject to the GP participation constraint V sV q, q
ˆ ˆ
G0, isA, B.ˆ
iSetting up the Lagrangean WqfV and solving the first order conditions gives
) ) Ž ) .
the optimal p and f . From q p ,
ˆ
P we have optimal qualityo y o
2 tn 1qk 1
Ž
yg qg.
ynm azqsk 1Ž
yg.
)q
ˆ
sŽ
1ql.
8btqnm2z .Ž .
14Ž o y.
wherezs2qk 1yg q2g .
Ž .
Optimal quality is smaller the more costly it is to produce the greater is b and the greater the marginal deadweight loss from the taxation required to finance
Ž .
its production. If errors are purely additive ms0 optimal quality is unaffected by the patient errors, distance costs or switching costs. However, in the more plausible case in which errors vary with the level of quality, the optimal quality is affected by imperfect information and switching costs.
Proposition 5. Optimal quality is reduced by multiplicatiÕe error. If there is
multiplicatiÕe error quality is smaller the higher is switching cost and the smaller
is distance cost.
Switching costs also reduce optimal quality when errors are multiplicative because the greater the error the more patients who will make costly switches. The positive effect of distance cost on optimal quality arises because quality becomes relatively less important to consumers in their choice of practice when distance cost is greater. Practices’ incentives to increase quality are reduced and so is the amount of error made by patients.
5. Endogenous error and switching costs
5.1. Welfare, error, and switching costs
There are welfare gains to reducing patient errors and switching costs. Practices have an incentive to reduce the errors made by patients and the costs they incur in switching to them. This raises the question of whether practices will choose the socially optimal level of a costly activity which reduces errors or switching costs when the capitation fee is set at the level which induces optimal quality.
Ž .
To simplify the analysis, we assume that errors are additive ms0 and that
ˆ
iŽ . Ž .
there is no marginal deadweight loss from taxations ls0 . Since V q, q is not
ˆ ˆ
affected by the additive error a or switching costs, the participation constraint is neither relaxed nor tightened by changes in a or s and their marginal social value arises solely from their effects on the per capita costs of error and switching
Ž .
incurred by patients T, as given in Eq. 13 . We have
azqsk 1
Ž
ygo.
Tas )0,
Ž .
152 t
k 1
Ž
ygo. Ž
ays.
Tss )0,
Ž .
162 t
Ž o y.
where, zs2qk 1yg q2g )0, and Ts s-0, Ts a)0. Ta a)0. Not only are the marginal values of reductions in error and switching costs positive but the marginal value of reductions in errors increases with the level of switching costs and vice versa. Welfare is concave in the error parameter: the marginal value of error reductions declines with the error. However, W is convex in switching costs: the marginal value of a reduction in the cost of a switch is greater the smaller is s. The explanation is that the amount of switching is larger when s is smaller so that total switching costs fall more with a given reduction in the cost per switch.
5.2. Information proÕision
We first consider the incentives of GPs to improve patient information by
Ž .
advertising say, by providing practice leaflets . The marginal value to a GP of a reduction in error parameter a isi
EDi
EDi nk
1 2 o
y
Ž
pyc.
ž
qk/
sŽ
1yg. Ž
pyc ..
Ž .
17Errors by young patients are symmetric: they have no effect on demand in the first period when all patients are young. However, reducing the error made by the old patients when young, makes them less likely to switch out when old. Thus, the gain from providing better information depends on the number of old patients
Ž o.
n 1yg .
Suppose that the error parameter for GP i is aisa0yhh where h is effort ini i
advertising which is chosen by GPs at the beginning of the first period at a cost of
h2. We assume that advertising can be regarded as a public good: the costs of
i
informing potential patients do not vary with the number informed.
Because the expected profit function is separable in advertising and quality, the first order conditions on quality and advertising can be solved independently of each other and the equilibrium level of advertising is8
nhk o
ˆ
hs
Ž
pyc. Ž
1yg.
.Ž .
188t
The welfare function is, remembering that we assume ls0,
o y 2 2
Wsn q
Ž
yc.
1qk 1Ž
yg qg.
ynTy2bq y2 h .Ž .
19Ž . 9
Using Eq. 15 , the socially optimal level of advertising is
nh
a zq
Ž
1ygo.
sk4
0
)
h s 2 .
Ž .
208tqnh z
The optimal level of advertising is increasing in the switching cost since higher switching costs mean that errors are more costly.
With purely additive error and no deadweight taxation costs, the regulator could achieve a first best level of quality by setting p)scqt, but substitution in Eq.
Ž18 and in comparison to Eq. 20 shows that. Ž .
Proposition 6. It is impossible to achieÕe optimal information proÕision and
quality solely by regulating the fee.
The regulator can raise both the quality and the amount of information provided by practices by increasing the capitation fee but she will require additional instruments to achieve optimal information and quality. At the fee inducing the socially optimal quality, practices have inappropriate incentives for information
Ž . Ž .
provision. Comparison of Eqs. 18 and 20 shows for example that GPs will take no account of switching costs or of the error costs of young patients in choosing the amount of effort to put into informing patients.
8ViŽq , h , q, h is strictly concave in q and h and Vˆ. i s0.
ˆ
i i q h
9W q, h is concave in q and h: WŽ . sy4b Ž Ž 2 . .
-0, W sy4qnh r2 tz -0 and W W y
q q h h q q h h
Ž Ž 2 ..
A first best can only be achieved if the regulator has an additional instrument to influence the level of information provision. For example, in the NHS, GPs are required to provide information about their practices to prospective patients and health authorities also provide information directly to patients about the character-istics of practices in their areas.
5.3. Endogenous switching costs
Suppose now that GPs can reduce the costs of patients who switch to them by
Ž Ž ..
additional effort. From the demand functions for young Eq. 4 and old patients
ŽEq. 7 , the marginal benefit of a reduction in the cost of switching to GP i isŽ ..
EDi1 ED2i nk o
y
Ž
pyc.
ž
qk/
sŽ
1yg. Ž
pyc.
)0Ž .
21Esi Esi 4 t
which is increasing in the capitation fee, so that the regulator can control s , viai the capitation fee.
When the planner controls both GPs’ switching costs s, the social value of a reduction in switching costs is
nk 1
Ž
ygo. Ž
ays.
yWss )0
Ž .
222 t
At the capitation fee p)scqt, which induces socially optimal quality, it is
apparent that
Proposition 7. It is impossible to achieÕe socially optimal quality and effort to
reduce switching costs solely by regulating the fee.
One possible means to reduce patient switching cost is to reimburse some of the costs of those who switch. Let s be the subsidy paid to patients who switch in
Ž
either direction as we will see, it does not matter whether the subsidy is a
.
reimbursement by the GP or by the regulator . The total distance costs of young patients are unaffected by the level of switching costs. The average social cost of an old patient is
t 1 2 1
o 2
T s q e q
Ž
sys.
qŽ
eysqs.
sŽ .
234 4 t 2 t
Ž .
instead of Eq. 12 .s reduces the distance costs of the additional old patients who
Ž .
are induced to switch the second term . There is no change in the social cost per switch s. The increase in the number of switchers therefore raises the social cost
Ž .
of switching the last term . On balance, the marginal increase in the social cost of switching outweighs the reduction in distance costs:
1 s s
o
Tss y
Ž
sys.
q s )0.2 t 2 t 2 t
Proposition 8. It is always socially sub-optimal to reimburse patient’s switching
costs.
There are no externalities in a patient’s decision to switch GPs since the patient bears the switching cost and receives the perceived benefit from switching. On average patients perceptions of the benefit are correct, though some over-estimate and some underestimate it. Unless a regulator can improve the information available to patients or reduce the social cost per switch, the privately optimal switching decisions are also socially optimal.
6. Conclusions
In the market for primary care, patients improve their knowledge about the characteristic of the practice they join after experiencing its services. Patients make initial errors in judging quality and switching costs lock some of the mistaken patients into the wrong GP.
Ž .
In any year, only a relatively small proportion 1.5% of patients change their
Ž .
practice without a change of address Dixon et al., 1997 . It has been suggested in
Ž .
the health services research literature Salisbury, 1989; Thomas et al., 1995 that this means that GPs do not need to compete for patients. We have shown that patient errors and switching costs do not eliminate the incentives for GPs to increase the quality to compete for patients when the regulated fee increases. Moreover, this conclusion does not depend on the proportion of the population switching, which in our model could be arbitrarily small.10
Regulation of the capitation fee received per patient can yield a welfare maximising level of quality, despite the fact that patients are imperfect judges of quality and incur switching costs. In a system like the NHS where the price of care received by GPs is paid from taxation, errors and switching costs do however have a real effect because they increase the cost to taxpayers of inducing a required level of quality and hence, if there is a deadweight loss from taxation, the socially optimal regulated quality is reduced.
Errors and switching costs also have direct welfare consequences. Errors lead some patients to choose the wrong practice. A reduction in the dispersion of the error distribution will make some patients better off and none worse off. Switching costs reduce the number of patients who switch when they revise their estimate of the quality of the GP they have chosen downward. Some of these patients would be better off as a result of switching because the other GP really does have higher quality. However, some of them will be worse off because they overestimate the
10The proportion of the second period population who switch is 1Ž ygo.Žeys.r2 t 1Ž ygoqgy.
quality of the other GP. Thus, although, on average, patients gain from a reduction in switching costs, some of them are made worse off.
The regulated market in which the regulator’s sole instrument is the capitation fee will not lead GPs to choose simultaneously the socially optimal levels of effort to reduce patient errors and quality or switching costs and quality. If the regulated fee is utilised to achieve the socially optimal level of quality, GPs have incentives to reduce patient errors about their own service and to reduce the costs of patients switching to them but these do not reflect the marginal welfare effects. GPs may choose to advertise too much or too little for optimality. Similarly, GPs have incentives to reduce the costs of consumers switching to them but these do not reflect the marginal welfare effects. When information and switching costs are endogenous, the optimal capitation fee will be a second best compromise balanc-ing its effects on quality, information, and effort to reduce switchbalanc-ing costs. There will also be the scope for additional policy instruments to influence quality, information provision, and switching costs.
Acknowledgements
Support from the Department of Health to the NPCRDC is acknowledged. The views expressed are those of the authors and not necessarily those of the Department of Health. We are grateful for comments from referees and partici-pants in seminars in Edinburgh, Surrey, and York and at the 19th Arne Ryde Symposium in Lund.
Appendix A. Patients’ distance and switching costs
The average distance and switching costs of young and old patients in group 1 are
1 d1 1
y
T1s
H
tdddqH
Ž
1yd.
tdd4 0 d1
1 dA B d
1 1
o
T1s
½
H
tdddqH
A BŽ
1yd.
tqs dd4 0 d1
B A 1
d1
q
H
Ž
tdqs d.
dqH
Ž
1yd.
tdd5
.B A
d1 d1
Ty is the distance costs of the two young subgroups of patients. To defines the
1 1
The average costs of group 2 patients in each period are
1 d2 1
y
T2s
H
tdddqH
Ž
1yd.
tdd4 0 d2
1 dA B d2 1
2 o
T2s
½
H
tdddqH
A BŽ
1yd.
tqs ddqH
Ž
1yd.
tdd5
.4 0 d2 d2
Ž
Old patients either stay with the GP chosen when old the first and third terms
o. Ž o.
in T2 or switch from GP A to GP B the second term in T2 . Given the symmetry assumptions, the costs for group 3 patients who underestimate the quality of GP A and overestimate the quality of GP B is equal to the costs of group 2.
Total distance costs of young and old group 4 patients in each period who remain with the GP chosen when young are
1 d4 1
y o
T4 sT4 s
H
tdddqH
Ž
1yd.
tdd .4 0 d4
Using Table 2, we evaluate the integrals to give the expressions for Ty and To given in the text.
References
Bester, H., 1998. Quality uncertainty mitigates product differentiation. RAND J. Econ. 29, 828–844. Dixon, P., Gravelle, H., Carr-Hill, R., Posnett, J., 1997. Patient movements and patient choice. Report
for National Health Service Executive, York Health Economics Consortium.
Economides, N., 1993. Quality variations in the circular model of variety-differentiated products. Regional Sci. Urban Econ. 23, 235–257.
General Household Survey, 1998. Living in Britain 1995, HMSO.
Gravelle, H., 1999. Capitation contracts: access and quality. J. Health Econ. 18, 315–340.
Klemperer, P., 1987. The competitiveness of markets with switching costs. RAND J. Econ. 18, 138–150.
Klemperer, P., 1995. Competition when consumers have switching costs: an overview with applications to industrial organization, macroeconomics and international trade. Rev. Econ. Studies 62, 515–539. Nilssen, 1992. Two kinds of consumer switching costs. RAND J. Econ. 23, 579–589.
Riorden, M.H., 1986. Monopolistic competition with experience goods. Q. J. Econ. 101, 265–279. Salisbury, C., 1989. How do people choose their doctor? Br. Med. J. 299, 608–610.
Salop, S.C., 1979. Monopolistic competition with outside goods. Bell J. Econ. 10, 141–156. Thomas, K., Nicholl, J., Coleman, P., 1995. Assessing the outcome of making it easier for patients to
change general practictioner: practice characteristics associated with patient movements. Br. J. Gen. Practice 45, 581–586.
Wolinksky, A., 1986. True monopolistic competition as a result of imperfect information. Q. J. Econ. 101, 493–511.