Atypical Resting Synchrony in Autism Spectrum Disorder
Annette X. Ye,
1,2,3*
Rachel C. Leung,
1,3,4Carmen B. Sch
€
afer,
1,5Margot J. Taylor,
1,2,3,4,6,7and Sam M. Doesburg
1,2,3,4,61
Diagnostic Imaging, Hospital for Sick Children, Toronto, Ontario
2Institute of Medical Science, University of Toronto, Toronto, Ontario
3
Neurosciences and Mental Health, Hospital for Sick Children Research Institute, Toronto, Ontario
4Department of Psychology, University of Toronto, Toronto, Ontario
5
Institute of Anatomy and Cell Biology, University of Heidelberg, Germany
6Department of Medical Imaging, University of Toronto, Toronto, Ontario
7
Department of Paediatrics, University of Toronto, Toronto, Ontario
r r
Abstract: Autism spectrum disorder (ASD) is increasingly understood to be associated with aberrant functional brain connectivity. Few studies, however, have described such atypical neural synchrony among specific brain regions. Here, we used magnetoencephalography (MEG) to characterize alterations in functional connectivity in adolescents with ASD through source space analysis of phase synchrony. Resting-state MEG data were collected from 16 adolescents with ASD and 15 age- and sex-matched typi-cally developing (TD) adolescents. Atlas-guided reconstruction of neural activity at various cortical and subcortical regions was performed and inter-regional phase synchrony was calculated in physiologically relevant frequency bands. Using a multilevel approach, we characterized atypical resting-state synchrony within specific anatomically defined networks as well as altered network topologies at both regional and whole-network scales. Adolescents with ASD demonstrated frequency-dependent alterations in inter-regional functional connectivity. Hyperconnectivity was observed among the frontal, temporal, and sub-cortical regions in beta and gamma frequency ranges. In contrast, parietal and occipital regions were hypoconnected to widespread brain regions in theta and alpha bands in ASD. Furthermore, we isolated a hyperconnected network in the gamma band in adolescents with ASD which encompassed orbitofrontal, subcortical, and temporal regions implicated in social cognition. Results from graph analyses confirmed that frequency-dependent alterations of network topologies exist at both global and local levels. We pres-ent the first source-space investigation of oscillatory phase synchrony in resting-state MEG in ASD. This work provides evidence of atypical connectivity at physiologically relevant time scales and indicates that alterations of functional connectivity in adolescents with ASD are frequency dependent and region
dependent.Hum Brain Mapp 00:000–000, 2014. VC2014WileyPeriodicals,Inc.
Key words:autism spectrum disorder; resting-state; neural oscillations; functional connectivity; magnetoen-cephalography; graph theory; developmental cognitive neuroscience; phase synchrony; social cognition.
r r
Additional Supporting Information may be found in the online version of this article.
Contract grant sponsor: Canadian Institutes of Health Research (to MJT); Contract grant number: MOP-119541
*Correspondence to: Annette X. Ye; Diagnostic Imaging, Hospital for Sick Children, 555 University Avenue, Toronto, ON Canada M5G 1X8, E-mail: [email protected]
Disclosure: All authors reported no competing financial interests or potential conflicts of interest.
Received for publication 23 September 2013; Revised 3 July 2014; Accepted 28 July 2014.
DOI: 10.1002/hbm.22604
INTRODUCTION
Autism spectrum disorder (ASD) is a complex neurodeve-lopmental disorder characterized by impairments in social communication and social interaction, in addition to restricted, repetitive and stereotyped patterns of behaviors, interests, and activities [APA, 2013]. Increasingly, ASD is understood to be associated with aberrant functional brain connectivity, indicating abnormal coordination of activity among brain regions [Belmonte et al. 2004; Just et al. 2004; Minshew and Keller, 2010; Muller et al. 2011; Schipul et al. 2011; Uhlhaas and Singer, 2007]. Prevailing hypotheses pur-port that ASD is characterized by reduced long-range func-tional connectivity and increased local funcfunc-tional connectivity [Belmonte et al. 2004; Courchesne and Pierce, 2005; Minshew and Williams, 2007; Rubenstein and Merzenich, 2003].
Synchronous oscillations represent a core mechanism for sculpting temporal coordination of neural activity across brain-wide networks [Wang, 2010]. Neural synchrony is responsible for coordination and communication between neural populations that are simultaneously engaged in cogni-tive processes [Fries, 2005; Uhlhaas et al. 2009; Wang, 2010]. Electroencephalography (EEG) and magnetoencephalography (MEG) allow the measurement of electrophysiological signals on a millisecond timescale, which is critical for measuring activity in numerous neurophysiologically relevant frequency ranges [Havenith et al. 2011]. Moreover, as magnetic fields are undisturbed by tissue inhomogeneities, MEG offers the conferred advantage of enhanced localization accuracy and improved oscillatory detectability compared with EEG [Kai-ser and Lutzenberger, 2005], providing an ideal modality for imaging oscillatory coherence in distributed brain networks [Palva and Palva, 2012].
Despite numerous empirical studies indicating altered func-tional brain connectivity in ASD using resting-state funcfunc-tional magnetic resonance imaging [fMRI; see Dichter, 2012; Min-shew and Keller, 2010; Vissers et al. 2012 for reviews], only a handful have used resting-state MEG to study connectivity in ASD populations [Cornew et al. 2012; Ghanbari et al. 2013;
Perez Velazquez et al. 2013; Pollonini et al. 2010; Tsiaras et al.
2011]. Findings have largely supported the idea of long-range underconnectivity in the ASD population, although discrepan-cies in frequency-dependence exist. To date, no study has examined source-space phase synchrony during resting-state MEG in ASD. Accordingly, knowledge remains scant regard-ing the involvement of specific brain regions and networks in atypical oscillatory synchrony in ASD. Here, we used atlas-guided source reconstruction of MEG data, together with the weighted phase lag index [wPLI; Vinck et al. 2011] and graph theoretical approaches [Rubinov and Sporns, 2010; Zalesky et al. 2010] to investigate resting-state neurophysiological inter-actions among brain regions in adolescents with ASD.
METHODS AND MATERIALS
Participants
Data were recorded from a total of 20 adolescents with ASD and 15 typically developing (TD) controls. Four ASD
participants were removed from the analysis due to exces-sive movement during recording, resulting in a final
sam-ple size of 16 ASD participants (14 males, range512–15
years, 14.461.1 years, all right-handed) and 15 TD
partici-pants (13 males, range512–15 years, 14.960.9 years, all
right-handed). Participants were recruited through the Hospital for Sick Children’s Research4kids database and flyers posted in the Greater Toronto Area. Individuals with metal implants, a history of neurological or neurode-velopmental disorders (other than ASD for participants in
the clinical group), or IQ65 were excluded. All ASD
par-ticipants had a prior clinical diagnosis, which was con-firmed using expert clinical judgment and/or the Autism Diagnostic Observation Schedule-General [Lord et al. 2000]. Full scale IQ was estimated for all participants using the Wechsler Abbreviated Scale of Intelligence, consisting of the Vocabulary and Matrix Reasoning subtests [Wechs-ler, 1999]. All participants and their legal guardians pro-vided written consent for the protocol approved by the Hospital for Sick Children Research Ethics Board and the Declaration of Helsinki.
Data Acquisition
Participants were instructed to maintain visual fixation on a centrally presented gray cross inside a white circle on the screen while remaining still, relaxed and awake in supine position inside a magnetically shielded room. Five minutes of MEG activity was acquired at 600 Hz sampling rate with a band-pass filter of 1–150 Hz and third-order spatial gradient noise cancellation, using a CTF Omega 151 channel whole head system (CTF Systems Inc., Port Coquitlam, Canada). Throughout data acquisition, head position was recorded continuously by measuring the position of the three fiducial coils, located at the nasion and left and right preauricular points. Fiduciary head coils were energized at 1,470 Hz, 1,530 Hz, and 1,590 Hz. Partic-ipants with head movement less than 10 mm for 90% of the recording time were considered acceptable for further analysis. This standard of movement tolerance is typical in MEG studies of pediatric populations, allowing collection of MEG data from a clinical child population without cre-ating a biased sample [Taylor et al. 2011]. Median head displacement during the 5-minute recording did not differ
between groups (P>0.05).
Following the MEG recording, anatomical MRI scans were acquired for each participant using a 3T MR scanner (MAGNETOM Tim Trio, Siemens AG, Erlangen, Ger-many). T1-weighted magnetic resonance images were obtained using a high resolution 3D MPRAGE sequence
(TR/TE/flip angle52,300/2.96 ms/9
, FOV528.8 3
19.2 cm, 256 3 256 matrix, 192 slices, slice thickness5
1.0 mm3 isotropic voxels) with a 12-channel head coil. To
Data Analysis
A flowchart presenting an overview of data processing and analysis pipeline is depicted in Supporting Informa-tion Figure S1.
Atlas-guided source reconstruction
We used a scalar beamformer [Cheyne et al. 2006] to reconstruct broadband time series for sources in the brain for 300 seconds of recorded data from each subject. Beamformer analysis affords protection against ocular and nonocular artifacts in MEG imaging [Cheyne et al. 2007]. A time series was computed for each of the 90 cortical and subcortical regions represented in the Auto-mated Anatomical Labeling (AAL) atlas [Tzourio-Mazoyer et al. 2002] (Fig. 1, Supporting Information Table S1). The AAL atlas provides coverage of the whole cortex as well as subcortical areas and has been employed effectively in investigation of brain networks using fMRI [He et al. 2009; Liao et al. 2010; Supekar et al. 2008; Wang et al. 2009] as well as in MEG studies [Diaconescu et al. 2011; Papanicolaou et al. 2006; Tewarie et al. 2013; van Dellen et al. 2013].
Next, broadband time series representing each of the 90 analyzed brain regions were filtered into six band-widths for further analysis, concordant with classic
elec-trophysiological divisions: d (1–4 Hz), h (4–7 Hz), a(8–14
Hz), b (15–30 Hz), low c (30–80 Hz), and high c (80–150
Hz). The stop and pass bands of the high-pass filters, and the pass and stop bands of the low-pass filters,
respectively, were as follows (in Hz) : d(0.1, 1; 4, 5),h(3,
4; 7, 8), a (7, 8; 14, 15), b (14, 15; 30, 31), low c (29, 30;
80, 81), and high c (79, 80; 150, 151). The choice of these
frequency bands was based on considerable evidence supporting the view that neural oscillations in these
bandwidths—and their synchronization—emerge from
different neurophysiological mechanisms and play dis-tinct roles in cortical computation and cognition [see Wang, 2010 for review].
Multilevel network characterization
To investigate whether functional connectivity was altered in adolescents with ASD, and to describe group differences in dynamic relations between spatial and func-tional organization of regional clusters in the brain, we used a multilevel approach which aimed to characterize atypical connectivity using bivariate statistics and graph theory. First, we estimated inter-regional functional con-nectivity by measuring phase synchrony between the time series of each possible pair of sources. Then, we character-ized large-scale lobar differences in functional connectivity by sorting each source into an anatomical subgroup (lobe) and contrasting the two groups of adolescents. Next, non-parametric testing was applied to investigate network-level connectivity as a function of the number of
contigu-ously interconnected nodes between which the extent of connectivity was different between groups [network-based statistic (NBS); Zalesky et al. 2010]. Finally, we quantified graph measures in each frequency at the “whole network” level in addition to performing multivariate analysis of these network measures at the level of each node/region. Taken together, these analysis approaches provide comple-mentary accounts of alterations in resting network syn-chrony in adolescents with ASD.
Estimating functional connectivity using the weighted
phase lag index
Functional interactions between sources of oscillatory activity can be captured by quantifying the phase relation-ship between their time series [see Pereda et al. 2005 for a
review]. Although beamformer source reconstruction
implements a spatial filter which aims to estimate the activity at the target location while attenuating contribu-tions from other sources, beamformer reconstructed sour-ces may still contain artificial and spurious interactions due to field spread and volume conduction. Artificial syn-chrony is directly caused by the instantaneous linear mix-ing of activity from nearby cortical areas and is removed using interaction metrics that detect exclusively lagged
Figure 1.
interactions and suppress zero-lag synchrony. Spurious synchrony is detected in the area’s neighboring sources [Palva and Palva, 2012] and can be suppressed by efficient cortical parcellation approaches [Palva et al. 2010]. In this study, we estimated functional connectivity using the recently introduced wPLI, which is an example of a mixing-insensitive interaction metric that attenuates artifi-cial interactions [Vinck et al. 2011].
Briefly, the instantaneous phase at each time point of the filtered waveform was calculated for the 300-second recording using the Hilbert transform. WPLI was used to estimate phase synchrony between each source pair over 300 seconds of data, for each analyzed frequency range. For the mathematical definition of wPLI, see Vinck et al. [2011]. WPLI values range between zero (no phase lock-ing) and one (total phase locking/synchronization), and are based on the magnitude of the imaginary component of the spectrum. This limits the influence of cross-spectrum elements about the real axes, which are at risk of changing their “true” sign with small noise perturbations
[Ortiz et al. 2012].1Similar to the PLI, the wPLI estimates
to what extent the phase leads and lags between signals from two sources are nonequiprobable. In contrast to the
PLI, however, wPLI gives maximal weighting to690
phase differences, and hence omits all signals associated with artificial synchrony [Lau et al. 2012]. Only phase lag-ging interactions, like those from a complex coupled
oscil-lator system (i.e., synchronously oscillating neural
assemblies), are detected. It has been shown that wPLI outperforms PLI, coherence, and imaginary coherence in attenuating volume conduction using real local field potential data [Vinck et al. 2011]. Moreover, wPLI has been demonstrated for measurement of inter-regional MEG synchrony in children [Dimitriadis et al. 2013], including graph analysis of resting-state connectivity [Ortiz et al. 2012].
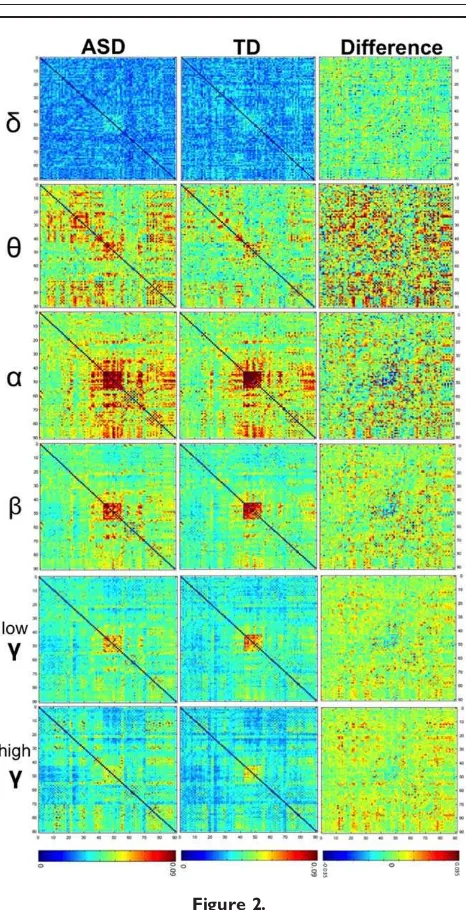
Functional connectivity matrix construction
To describe brain networks a 90-by-90 connectivity matrix was computed for each subject for each frequency band. Group averages and group differences for each ana-lyzed frequency range are presented in Figure 2. Connec-tivity matrices quantified the intensity of inter-regional functional connectivity between every pair of sources and were represented by the wPLI as described above. These connectivity matrices were used in subsequent lobar func-tional connectivity and NBS analyses described below.
Lobar functional connectivity and network-based
statistic
We used two complementary approaches to describe pair-wise alterations in functional connectivity in ASD: (1) large-scale functional connectivity through lobar categori-zation of brain regions, which investigated resting syn-chrony within and between the lobes of the brain; (2) network-level functional connectivity analyzed using the NBS [Zalesky et al. 2010].
(1) To characterize neural synchrony within and between the lobes of the brain and to investigate altera-tions in connectivity expressed at the level of large-scale anatomical subdivisions of the brain, we sorted each source (region) based on lobar classification. There were five subgroups (subcortical structures and the four lobes) in accordance with the AAL atlas: frontal, temporal, sub-cortical, parietal, and occipital (Fig. 1), and similar to pre-vious studies [Fornito et al. 2011; Hong et al. 2013]. Note that, hereafter, for the sake of brevity, we have generalized the term “lobe” to encompass the subgroup containing subcortical structures. Each subgroup contained between 8 and 32 nodes. Four regions [33, 34, 69, and 70] (Supporting
Information Table S1) from the [90390] connectivity
mat-rices were removed due to ambiguity in anatomical place-ment into a lobe, and hence 86 of the 90 nodes were sorted. Connectivity within or between each lobar group-ing was derived by averaggroup-ing wPLI values across all edges (each pair of regions) relevant for that comparison. For example, theta band frontoparietal connectivity was obtained by averaging the wPLI values for each connec-tion between a frontal source and a parietal source. We repeated this for each subject at each bandwidth, resulting
in six [535] connectivity matrices per subject. To evaluate
group differences in lobe-level functional connectivity,
two-tailed t statistics were performed for each element of
the [53 5] connectivity matrix in each frequency band. A
false discovery rate (FDR) using a q-value of 0.05 was
used to control for multiple comparisons [Benjamini and Hochberg, 1995].
(2) To describe in more detail which groups of regions were differentially connected in ASD adolescents, we employed the NBS [Zalesky et al. 2010]. This approach identifies networks—defined as contiguously connected sets of nodes—that are differentially connected between groups. An advantage of this approach over complex net-work analysis is that functional connectivity data can be readily related to anatomy; that is to say, clusters of regions that are functionally interconnected can be visual-ized in anatomical brain space.
In the NBS analysis, a primary threshold (P50.0025)
was applied in a two-sample, one-tailed t-test for each
edge in the [903 90] connectivity matrices to define a set
of suprathreshold edges. This yielded a collection of con-tiguously connected components (groups of nodes) and their extent (number of significant connections/edges) was recorded. Then, to index the significance of each identified
1Various other methods have been employed for estimating
component, a null distribution was empirically derived using nonparametric permutations (5,000 permutations). For each permutation, each subject was randomly reallo-cated into one of two groups, and differentially connected components in this surrogated data were identified using the same initial threshold that was applied to the
unshuffled data (P50.0025). For a connected component
of size M found for the real (nonshuffled) grouping of ASD participants and TD controls, a family-wise error
cor-rected P-value was determined by calculating the
propor-tion of the 5,000 permutapropor-tions for which the maximal connected component was larger than M. Two alternative
hypotheses (ASD adolescents>TD adolescents and TD
adolescents>ASD adolescents) were evaluated
independ-ently for the six frequency bands. As the component extent of each value in the null distribution is obtained consider-ing all pair-wise comparisons in the analyzed connectivity matrices, NBS controls for false positives due to multiple comparisons [Zalesky et al. 2010].
Global and local graph theory analyses
The wPLI results were used to construct a 90-by-90 weighted, undirected graph for each subject and analyzed frequency band, from which measures describing network topology were derived [see Bullmore and Sporns, 2009]. Detailed accounts of basic principles underlying graph analysis and its application to neuroimaging data have been published previously [Bullmore and Sporns, 2009; Rubinov and Sporns, 2010]. Given the past literature describing long-range hypoconnectivity and local hyper-connectivity in ASD, we were interested in measures perti-nent to functional integration and segregation. To quantify this, we measured strength (overall connectivity), cluster-ing coefficient (functional segregation) and path length (functional integration) of each subject’s graph at each fre-quency band using the Brain Connectivity Toolbox [Rubi-nov and Sporns, 2010].
Specifically, path length is a measure of the shortest route (in terms of edges traversed) between two nodes [Rubinov and Sporns, 2010]. It is commonly referred to as a measure of functional integration [Rubinov and Sporns, 2010]. Average shortest path length, or characteristic path length, is the average shortest path length between all pairs of nodes in the network [Rubinov and Sporns, 2010]. Clustering coefficient, on the other hand, is a measure of functional segregation. The clustering coefficient is the likelihood that neighbours of a node are connected to each other, and indicates the extent of local interconnectivity or cliquishness in a network. For more details on graph theo-retical measures see Bullmore and Bassett [2011] and Rubinov and Sporns [2010].
We quantified each graph measure for each individual node, as well as for the whole graph (obtained by averag-ing across all 90 analyzed nodes). For both the global and
local graph analyses, a nonparametric permutation
method with an alpha value set to 0.05 was adopted to evaluate statistical significance of group differences at each measure, for each frequency band. To provide surro-gate data distributions, 2048 permutations were
per-formed at an a-level of 0.05. This alpha level of 0.05 was
then corrected via the t-max test [see Blair and Karniski, 1993] to account for multiple comparisons across all Figure 2.
network pairs and frequency bands. For local graph theory measures, to correct for the 90 independent tests (90 nodes in the graph), an alpha value of 1/90
(P<0.011) was used as a threshold for statistical
signifi-cance [Lynall et al. 2010].
RESULTS
Frequency- and Region-Dependent Alterations of
Resting Synchrony in ASD
To facilitate characterization and interpretation of func-tional connectivity data from a large number of regions in the brain, we sorted connections represented in Figure 2 into regional clusters based on anatomical location (Fig. 1). This analysis approach enables the identification of altera-tions in resting synchrony which are expressed at levels of anatomical organization previously identified in the ASD literature (e.g. frontoparietal, frontofrontal, anterior–poste-rior). Group differences in within- and cross-lobar func-tional connections were statistically significant in five out
of the six frequency bands (P<0.05, FDR-corrected, Fig.
3). One of the primary observations from this large-scale,
lobar analysis was a frequency- and region-specific pattern of overconnectivity and underconnectivity in the ASD group. In slower theta and alpha bands, occipital and pari-etal lobes expressed functional disconnection from wide-spread brain areas (including connections within these grouping themselves), with the most prominent effects observed in the alpha band. Conversely, faster gamma oscillations exhibited hyperconnectivity among frontal, temporal, and subcortical lobes in ASD adolescents. A more complex pattern of atypical intra- and interlobar con-nectivity was observed in the beta band, in which ele-ments of the posterior disconnection were observed in concert with fronto-tempo-subcortical overconnection in the ASD group. Lastly, intralobar and interlobar connectiv-ity in the delta band were similar between groups; how-ever statistical differences between the two groups supported an anterior–posterior disconnection in the fron-tal cortex in ASD. No statistical differences in intralobe or interlobar functional connectivity were observed in the high gamma band.
For slow brain oscillations in the delta band, the parietal and subcortical lobes displayed significant decreases in
functional connectivity with the frontal cortex (P<0.05,
uncorrected for frontoparietal, FDR-corrected for
Figure 3. Contrast of ASD and TD adolescents in group-averaged connec-tivity matrices for the six analyzed frequency bands. WPLI values depicted on the colour scale represent group differences (ASD minus TD) and were averaged by lobe grouping across both hemispheres. Uncorrected significant differences resulting from two-tailedtstatistics are marked with one star (*P<0.05
frontosubcortical). Furthermore, intratemporal, intrasub-cortical and intraparietal connections appeared hypocon-nected in ASD. In the theta band, intralobar functional connectivity was lower in both parietal and occipital lobes and between these two lobes and the rest of the brain for
the ASD group (P<0.05, uncorrected for parietotemporal
and parietosubcortical, FDR-corrected for all other connec-tions). A more striking trend of functional disconnection in the same direction was found in the alpha band
(P<0.05, FDR-corrected). In the beta band, the ASD group
had significantly higher functional temporotemporal,
tem-porosubcortical, and subcorticosubcortical connectivity
(P<0.05, FDR-corrected). In contrast, frontooccipital,
pari-etooccipital, and occipitooccipital beta band connections were lower in ASD adolescents compared to TD
adoles-cents (P<0.05, FDR-corrected). In the low gamma band,
all intra- and interlobar connections between the frontal, temporal, and subcortical lobes were significantly higher
in the ASD group (P<0.05, uncorrected for frontofrontal
connections, FDR-corrected for all other connections). Finally, despite lack of statistical differences between groups in the high gamma band, the temporal lobes appeared overconnected to the frontal cortex, to subcorti-cal regions and to themselves.
Increased Gamma-Band Network
Synchrony in ASD
NBS is a method to detect functionally interconnected (functionally integrated) nodes in a graph that cluster into a single component, and which are significantly different between two groups. In our study, NBS analysis revealed
a single significant network (P50.012, see Fig. 4 for
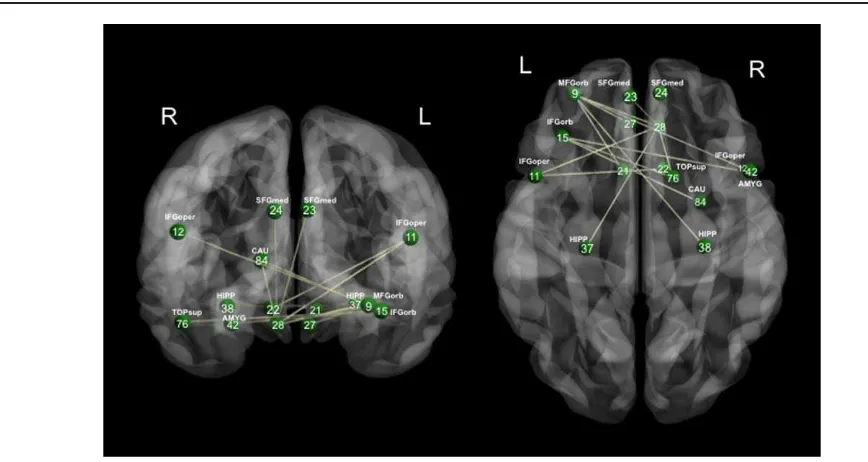
details). This network consisted of 15 nodes that were overconnected in the ASD group, in the low gamma band, consisting of frontal, temporal, and subcortical regions. Each region has been indexed by its region number, corre-sponding to Table S1 in the Supporting Information. Of note, the region with the greatest number of significantly different connections was the orbital part of the left mid-dle frontal gyrus (MFGorb). Specifically, the left MFGorb was hyperconnected to the left and right rectal gyri, the opercular part of the right inferior frontal gyrus (IFG), the right hippocampus, and the left olfactory cortex. These NBS results are congruent with the large-scale lobar con-nectivity findings noted above for the low gamma band, and indicate a specific network of hyperconnected nodes anchored in prefrontal cortex. No significantly connected components in the other five frequency bands were observed using the NBS approach.
Figure 4. Network consisting of 15 brain regions that were hypercon-nected in ASD adolescents in the low gamma band. The connec-tions (edges) between pairs of regions represent statistically significant differences in functional connectivity between the two groups. Network Based Statistic toolbox was used to compute statistics between strength of connections as indexed by wPLI
Frequency-Dependent Alterations in Global
Network Topology in ASD
To investigate the hypothesis that network topology of spontaneous MEG activity is altered in adolescents with ASD, graph analyses were applied at the global (whole graph) and local (each node) levels to each subject’s graph of resting phase synchrony for each of the six analyzed frequency bands. At the global level, we compared aver-age strength, averaver-age clustering coefficient, and character-istic path length of the two groups. Figure 5 depicts group averages for each global measure for each frequency band. Significant differences between the groups were observed for low-frequency oscillations (delta and theta) but not in
the higher-frequency bands (P<0.05, FDR-corrected).
Similar to our results from investigation of large-scale anatomical organization within and between the lobes of the brain, alterations in network topology in ASD were also expressed in a frequency-dependent manner. Overall, we found a general trend for increased “local
con-nectedness”—increased global clustering coefficient
coupled with decreased path length—of the functional net-work (theta, beta, low, and high gamma bands). By con-trast, networks in the alpha frequency range were similar between groups, while delta band alterations in network topology showed effects in the opposite direction. Taken together, results at the ‘whole network’ level suggest alter-ations in functional integration and segregation of regional clusters in adolescents with ASD. Of note, average cluster-ing coefficient in delta and theta bands were significantly
different between the groups (P<0.05, FDR-corrected),
whereas characteristic path length was only significantly
different in theta band (P<0.05, FDR-corrected). Average
strength differences between groups were significant in the delta frequency range, where higher resting synchrony
was observed in the TD adolescents (P<0.05,
FDR-corrected).
Atypical Regional Topologies in
Adolescents with ASD
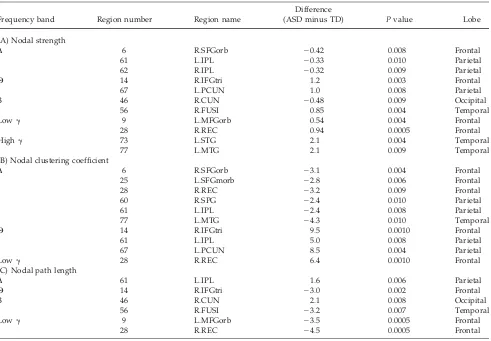
Network topology was also investigated at each of the 90 nodes in order to capture alterations in brain network organization pertaining to the connectedness of particular brain regions in ASD. This analysis revealed significant between-group differences in nodal strength, nodal clus-tering coefficient, and nodal path length in five of the six
analyzed frequency ranges (P<0.011 corrected, Table I).
Congruent with our findings using global network meas-ures, nodal-level measures “local connectedness” (cluster-ing coefficient and path length) were higher in theta, beta, low, and high gamma band in ASD, but were decreased in the delta band, with no differences present in the alpha band. Overall, adolescents with ASD exhibited disrupted local segregation and integration of functional networks compared to TD adolescents. There were 13 nodes (regions) which were significantly different in local graph properties between the two groups; close to half of the regions belonged to the frontal lobes, including orbital and medial orbital parts of the superior frontal gyrus, the gyrus rectus, the orbital part of the middle frontal gyrus, and the pars triangularis of the inferior frontal gyrus
(P<0.011 corrected, Table I).
DISCUSSION
This study provides the first source-resolved investiga-tion of resting-state oscillatory synchrony in ASD. We pro-vide new insights into the role of specific networks and Figure 5.
Differences in measures of global topological attributes of brain connectivity between ASD and TD adolescents derived from global graph theoretical analysis. Significant differences (marked with one star) were found between the two groups for delta and theta frequency bands (P<0.05, FDR-corrected). A, Aver-age strength of the whole network comprising 90 nodes for
brain regions which exhibit altered neurophysiological interactions in this population. Our findings indicate that adolescents with ASD demonstrate atypical neural oscilla-tory synchrony in a region- and frequency band-dependent manner. Specifically, occipital and parietal brain regions were found to express low frequency func-tional disconnection from widespread brain regions in adolescents with ASD, whereas overconnectivity at higher frequencies was observed among frontal, temporal, and subcortical areas. We also found a hyperconnected subnet-work in the low gamma frequency range, which included many regions of frontal cortex, as well as left and right hippocampi, right amygdala, right caudate nucleus, and right superior temporal gyrus (STG). Moreover, ASD ado-lescents expressed atypical network topologies at both
global and local levels, indicating abnormal functional integration and segregation in large-scale brain networks. Together, our study provides empirical evidence for the disruption of topological organization of functional net-works in ASD.
Altered EEG and MEG Resting
Connectivity in ASD
Functional disconnection of the parietal and occipital cortices from other cortical regions at lower frequencies (delta, theta, and alpha) was observed in ASD adolescents, in which the alpha band was the most striking. Decreased alpha coherence has been previously reported at the TABLE I. Group comparisons (ASD adolescents minus TD adolescents) of complex network measures
characteriz-ing functional segregation and integration uscharacteriz-ing local graph theory analysis
Frequency band Region number Region name
Difference
(ASD minus TD) Pvalue Lobe
(A) Nodal strength
D 6 R.SFGorb 20.42 0.008 Frontal
61 L.IPL 20.33 0.010 Parietal
62 R.IPL 20.32 0.009 Parietal
H 14 R.IFGtri 1.2 0.003 Frontal
67 L.PCUN 1.0 0.008 Parietal
B 46 R.CUN 20.48 0.009 Occipital
56 R.FUSI 0.85 0.004 Temporal
Lowg 9 L.MFGorb 0.54 0.004 Frontal
28 R.REC 0.94 0.0005 Frontal
Highg 73 L.STG 2.1 0.004 Temporal
77 L.MTG 2.1 0.009 Temporal
(B) Nodal clustering coefficient
D 6 R.SFGorb 23.1 0.004 Frontal
25 L.SFGmorb 22.8 0.006 Frontal
28 R.REC 23.2 0.009 Frontal
60 R.SPG 22.4 0.010 Parietal
61 L.IPL 22.4 0.008 Parietal
77 L.MTG 24.3 0.010 Temporal
H 14 R.IFGtri 9.5 0.0010 Frontal
61 L.IPL 5.0 0.008 Parietal
67 L.PCUN 8.5 0.004 Parietal
Lowg 28 R.REC 6.4 0.0010 Frontal
(C) Nodal path length
D 61 L.IPL 1.6 0.006 Parietal
H 14 R.IFGtri 23.0 0.002 Frontal
B 46 R.CUN 2.1 0.008 Occipital
56 R.FUSI 23.2 0.007 Temporal
Lowg 9 L.MFGorb 23.5 0.0005 Frontal
28 R.REC 24.5 0.0005 Frontal
sensor/electrode level in resting-state EEG studies in chil-dren [Coben et al. 2008] as well as adults with ASD [Murias et al. 2007]. We did not, however, observe a sig-nificant frontal [Murias et al. 2007] or temporal [Coben et al. 2008] disconnection from the rest of the cortex in theta or alpha bands albeit nonsignificant decreases in interlobar connectivity of frontal and temporal lobes in ASD in comparison to TD were noted. Although frontal and temporal connections to the occipital and parietal lobes were significantly hypoconnected in the present study, effects appeared to be driven by the low-frequency disengagement of posterior regions from widespread brain areas. In delta and theta bands, lower coherence in ASD has been reported previously in parietal and occipital regions [Coben et al. 2008], in addition to temporal and central regions which we did not observe.
Interestingly, our results contrast those from a recent resting-state MEG study that reported increased long-range connectivity in the temporal, parietal, and occipital lobes in alpha band [Ghanbari et al. 2013]. The differences between this study and ours could be attributed to factors such as differences in age groups (children and adults ver-sus adolescents), eye state (closed verver-sus open), analysis
level (sensor-space versus source-space), parcellation
scheme (sensor-groups versus atlas-based seeds) and func-tional connectivity metric (synchronization likelihood ver-sus wPLI). Moreover, the results presented here are likely to be more accurate with respect to specific brain regions and networks involved in altered oscillatory synchrony in ASD, as analysis of EEG/MEG connectivity among recon-structed sources is substantially more accurate than sensor-based approaches in this regard [Schoffelen and Gross, 2009].
ASD Adolescents Express Decreased
Anterior-Posterior Connections at Slow Frequencies
Deficient long-range connections along anterior–poste-rior brain pathways could disrupt experience-dependent processes during development that are important for creat-ing and maintaincreat-ing neural connections [see Geschwind and Levitt, 2007 for review]. Atypical maturation of con-nectivity could hinder the development of social cognitive abilities such as joint attention and social responsiveness, which reliably discriminate young children with ASD from their TD peers [Baranek, 1999; Werner et al. 2000; Wetherby et al. 2004]. Evidence of reduced coherence between anterior and posterior brain regions on the basis of resting EEG data [Coben et al. 2008; Murias et al. 2007] supports this hypothesis. The view that frontoposterior connectivity is reduced in ASD is also supported by sev-eral lines of evidence from structural and functional MRI studies [see Just et al. 2012 for review]. Our findings using source-space analysis of resting neurophysiological syn-chrony in adolescents with ASD are congruent with the above hypothesis at low frequency oscillations below 30
Hz. However, our results also suggest an extension to the disconnection theory: (1) that aberrant features of brain organization are expressed in a frequency-dependent man-ner; and (2) both cortical and subcortical systems are affected.
The Hyperconnected Gamma Subnetwork May
Reflect Socioemotional Deficits in ASD
Gamma oscillations are regarded as important as they are believed to coordinate precise synchronization in local circuits, and accordingly, play a vital role in information processing supporting cognition [Fries, 2009]. Converging evidence suggests that properties of gamma oscillations are altered in ASD during task performance [Orekhova et al. 2007; Rojas et al. 2011; Stroganova et al. 2012; Wilson et al. 2007]. Our finding of increased connectivity in the ASD group in a subnetwork of medial frontal, temporal and subcortical regions is of twofold interest; it lends sup-port to the view that altered gamma-oscillatory processes play a role in the pathophysiology of ASD, and demon-strates that, in particular, affected regions in this subnet-work include regions understood to be critical for social cognition.
The theory that excess high frequency oscillations reflect an imbalance in the excitation-inhibition homeostasis in the cortex [Orekhova et al. 2007] may be relevant to find-ings of gamma-band hyperconnectivity in ASD. Mutations in genes involved in the expression of excitatory and inhibitory neurotransmitters have been identified in ASD populations [Collins et al. 2006; Ramoz et al. 2004] as well as animal models of ASD [DeLorey et al. 2008]. This may provide the basis for a link between atypical oscillations and genetic mechanisms underlying ASD, as individual differences in the expression of gamma oscillations have been demonstrated to be under tight genetic control [van Pelt et al. 2012].
With respect to social cognition, there are several regions within the significantly different, hyperconnected gamma band subnetwork in ASD (identified using NBS) that are of particular interest. Such hyperconnected regions include the IFG and regions encompassing the “social brain”: the orbitofrontal areas, the amygdalae, the STG [Brothers, 1990], and the medial frontal cortex [Amodio and Frith, 2006]. Hyperconnectivity amongst regions criti-cal for social cognition, in concert with hyperconnectivity to other regions of a different functional network may dis-rupt task-relevant communication among brain regions underlying social cognitive abilities [Lynch et al. 2013]. Alternatively stated, atypical connectivity among these regions may limit dynamic interactions amongst the rest of the cortex [Uddin et al. 2013].
of linguistic inputs, in addition to the motor production of speech [Bookheimer, 2002]. The mirror neuron system, located in the IFG, is a neural mechanism by which others’ actions and intentions can be understood [see Rizzolatti and Craighero, 2004 for review], and its dysfunction was proposed to give rise to the cascade of impairments that are characteristic of ASD [see Williams et al. 2001 for review]. In addition, atypical activation in fMRI has been demonstrated in the IFG during emotion processing tasks [Fusar-Poli et al. 2009; Kesler-West et al. 1999], suggesting aberrant connectivity of this region in ASD populations.
Another key observation from the NBS analysis relates to the functional role of two limbic regions: the right amygdala and the hippocampi. Converging evidence from studies in human and animals suggests that emotion per-ception and regulation is mediated by a brain circuit in which the amygdalae and hippocampi are central compo-nents. The amygdalae play a key role in the recognition and evaluation of emotionally salient stimuli and subse-quent production of affective states [Phillips et al. 2003]. The right amygdala in particular, is linked to implicit emo-tional processing [Adolphs et al. 2005; Costafreda et al. 2008; Hung et al. 2012; Noesselt et al. 2005]. The hippo-campi, apart from their general role in memory, modulate the production of contextually appropriate affective behav-ior that is elicited by emotionally salient stimuli. The hip-pocampi do this through inhibitory connections with the amygdalae and other structures involved in emotion per-ception [Phillips et al. 2003]. Interestingly, in childhood, several studies have supported the idea of enlarged amyg-dalae and hippocampi in ASD [Groen et al. 2010; Howard et al. 2000; Rojas et al. 2006; Schumann et al. 2004; Sparks et al. 2002], with volume losses that emerge in adulthood [Duerden et al. 2012; Nickl-Jockschat et al. 2012; Yu et al. 2011]. Our findings of hyperconnectivity in the left and right hippocampi along with the right amygdala support the idea of a developmental abnormality in these regions in ASD, which persists into adolescence.
The last region of particular interest to highlight from the hyperconnected low gamma subnetwork revealed by NBS is the caudate nucleus. This nucleus thought to be part of an intricate system integrating multimodal infor-mation and regulating complex behavior [Alexander and Crutcher, 1990; Haber, 2003]. The caudate is also increas-ingly recognized to be implicated in affect processing [Arsalidou et al., 2013]. Given these associations, hyper-connectivity of the caudate nucleus in the current study could be associated with corticostriatal feedback and may therefore be related to behavioral problems in ASD. In line with this, stereotypic, repetitive behavior patterns related to the diagnostic criteria for ASD have been com-pared to those seen in obsessive-compulsive disorders, which are known to be associated with structural and functional abnormalities in the basal ganglia [Langen et al. 2009]. Furthermore, in a voxel-based morphometry longitudinal study characterizing the developmental tra-jectories of striatum in ASD, an increase was detected in
caudate volumes in ASD, while it decreased in control subjects [Langen et al. 2009]. Taken together, our findings regarding the overconnected subnetwork in the low gamma frequency band can be interpreted considering the postulate that daily life, with its social demands and constantly changing situations, imposes additional social cognitive demands in adolescents with ASD resulting in abnormal information processing in regions related to social cognition, behavior, and emotion perception and regulation.
Differences in Global Network Topology
Indicated Disrupted Functional Integration and
Segregation in ASD
At the ‘whole network’ level, our results indicated ASD adolescents exhibited disrupted functional integration and segregation of brain networks. In particular, we demon-strated differences in average strength, clustering coeffi-cient and characteristic path length at both low and high frequencies, suggesting a less optimized topological orga-nization in functional networks of adolescents with ASD. Furthermore, increased average clustering coefficient and shorter characteristic path length in theta, beta, low and high gamma bands indicate increased “cliquishness” prop-erties of functional networks within these frequency ranges, supporting the idea of disrupted balance between global integration and local specialization. On the network level, this suggests a pattern of global overconnectivity and altered network topology favouring increased clusters of local connections in ASD. Moreover, stronger local con-nectivity has been previously reported in structural studies of autism using diffusion tensor imaging [Herbert et al., 2004; Li et al 2014].
There are some interesting nuances to this trend in glob-ally altered network topologies that deserve mention. First, delta band measures of global network topology exhibit the opposite pattern of effects in ASD: networks have decreased average strength, decreased clustering coeffi-cient and increased characteristic path length. This sug-gests a loss of functional segregation of networks in ASD. In the model of autism as a developmental disconnection syndrome, decreased functional segregation could be anticipated as it suggests that specific functional systems are less distinct or functionally segregated from one another. Second, although there is a general trend for global overconnectivity in ASD, alpha band functional net-works appear to be relatively the same between the two groups. As average strength is a direct reflection of mean coherence (functional connectivity) within the network, our results suggest that there is no significant overall dif-ference in phase synchrony at rest in alpha bands in ado-lescents with ASD compared to controls. This result is not surprising as it has been previously reported in resting EEG studies in ASD [Mathewson et al. 2012; Peters et al. 2013].
Focal Disruptions in ASD Involve the Default
Mode Network, Frontal Cortex and the
Temporoparietal Junction
When we looked at local graph measures to describe focal alterations in specific regions of the brain, we found three observations of interest in the ASD literature. First, several regions that displayed significant alterations in focal topology were implicated in the default mode net-work (DMN), such as the precuneus and the inferior parie-tal lobule. Second, five of the thirteen nodes that were significantly different in local graph properties in ASD belonged to the frontal cortex. Lastly, in the high gamma band, focal alterations were detected in theory of mind (ToM)-relevant regions in the ASD group. One of the pri-mary observations from the regional graph analysis relates to alterations in regions encompassing the DMN. The delta band group differences provide a particularly salient example of these alterations involving DMN regions. Decreased nodal strength, decreased clustering coefficient and increased path length in nodes of the DMN in delta band suggest loss of functional segregation within this net-work. In contrast, theta and high gamma bands reveal the opposite direction of effects in DMN regions; such regions appeared to be hyperconnected and demonstrate increased local functional connectedness. We propose that these findings—though seemingly opposite in effect—both sug-gest that regions involved in the DMN are functionally disrupted. In other words, adolescents with ASD may exhibit a less optimized topological organization in the DMN, leading to frequency-dependent functional altera-tions in DMN regions. Accordingly, decreased clustering coefficient may relate to decreased functional segregation
(i.e., delta band findings) of the DMN to the rest of the brain, while increased clustering coefficient may suggest lack functional specialization (i.e., theta, beta, low gamma band findings) due to an abundance of functional connec-tions. Interestingly, evidence from structural and fMRI in ASD have reported both underconnectivity [Assaf et al. 2010; Stigler et al. 2011] and overconnectivity [Lynch et al. 2013; Uddin et al. 2013; Redcay et al. 2013] between DMN nodes.
The frontal lobes are responsible for numerous higher-order cognitive functions, including planning, decision making and abstraction, and thus are a primary candidate for dysfunction in many neurodevelopmental and neuro-psychiatric disorders. We report 5 out of 13 altered focal topologies in the frontal cortex, suggesting a less organ-ized or more random distribution of functional networks involving frontal areas. Although our findings revealed altered local functional connectivity in the frontal lobes, we are limited in terms of the conclusions we can make regarding the anatomical proximity of these functional hyperconnections. In light of our large-scale lobar connec-tivity results, it is plausible that short-range connections involving the frontal cortex are underconnected at lower frequencies (e.g., delta band) and overconnected at higher frequencies (e.g., low gamma band). Even though current theory purports that there is local overconnectivity in the frontal cortex in ASD [Courchesne and Pierce, 2005], litera-ture from multiple modalities involving task-based and task-free paradigms have been inconclusive in supporting this hypothesis [see Vissers et al. 2012, for review]. None-theless, the abnormal functional properties of frontal regions are interesting in light of both the association between ASD and the current frontal hyperconnectivity theory and evidence of frontal involvement in the DMN.
Another inference that may be drawn from observations from local graph theory results relates to regions impli-cated in ToM. The impairment of ToM (processing of men-tal states of others) in ASD has been linked to difficulties with the communications and interactions in everyday life [Kana et al. 2009]. The temporoparietal junction (TPJ), in particular, is thought to be central to the integration of social information and empathy, in addition to selective attention to salient stimuli (Decety and Lamm, 2007]. In the high gamma band, two regions surrounding the TPJ demonstrated altered focal topology in our study: the left superior and medial temporal gyri. In children, adoles-cents and adults with ASD, thinning of several regions in the TPJ region, particularly on the left side, has been reported [Greimel et al. 2013; McAlonan et al. 2005; Razna-han et al. 2010; Wallace et al. 2010]. Although our findings of increased local strength in TPJ regions are not immedi-ately intuitive when considering neurological reports of volume reductions, it is suggestive of altered function within these regions that could interfere with ToM-related information processing.
in functional brain networks in ASD. We propose that increased local connectedness could imply decreased func-tional specialization of brain regions in ASD. Connections in the brain are formed at a high physical cost [Bullmore and Sporns, 2009; Sporns and Zwi, 2004] and the brain constantly negotiates the trade off between wiring costs and topological efficiency [Bullmore and Sporns, 2012]. Our findings of increased average strength in ASD and increased local connectedness suggest impaired network refinement in this population, particularly at a critical time of development in adolescence.
Limitations and Future Work
Some important caveats should be considered with regard to the present study. First, the limits of MEG in localizing and estimating the activity of deep brain sources remain an area of on ongoing research. Multiple studies have shown MEG to be effective at detecting weak signals emanating from deep brain structures such as the hippo-campi during a variety of tasks [Cornwell et al. 2008a; Ioan-nides et al. 1995; Kirsch et al 2003; Nishitani et al. 1998], as well as the amygdala [Cornwell et al. 2007, 2008b, 2010; Hung et al. 2010; Ioannides et al. 1995; Liu et al. 1999; Luo et al. 2007; Moses et al. 2007; Streit et al. 1999] and thama-lus [Bardouille and Ross, 2008; Bish et al. 2004; Tesche, 1996]. Moreover, there have been several realistic simula-tions that have shed light on parameters affecting our abil-ity to detect such sources of activabil-ity [Balderston et al. 2014; Mills et al. 2012; Quraan et al. 2011]. Despite this empirical evidence, the debate over the ability of MEG to accurately detect and localize deep sources has persisted [for in-depth discussion see Riggs et al. 2009; Stephen et al. 2005]. With this in mind, our findings regarding connectivity altera-tions involving deep brain sources in this study should be interpreted with a degree of caution.
Another issue is the effect of sorting brain regions into their anatomical, lobar subdivisions. Since each lobe is dif-ferent in size, numbers of regions/nodes sorted into each were accordingly different. This results in an uneven num-ber of regions for each lobe, so it is plausible that a small number of connections within a lobe may have exerted a disproportionate influence on the resulting depiction of lobar connectivity. To address this issue, we describe regional differences between the two groups using bivari-ate statistics (NBS) in addition to both global and nodal graph theory measures, which do not suffer from this limi-tation. We feel this level of description is nonetheless informative given prior theory and experimental reports describing altered connectivity in ASD at the level of large-scale anatomical systems.
Third, while the atlas-based whole brain reconstruction of MEG source activity has been shown to be a valuable approach for investigating connectivity in large-scale brain networks, there are some limitations when using this method. For instance, the selection of sources is sparse
and may not yield an accurate or adequate selection of brain structures that contribute to a more complete under-standing of the brain in ASD. Such limitations might be
ameliorated by adopting a whole-brain parcellation
scheme that is based on source sensor geometry to obtain a set of maximally independent patches [Palva et al 2010]. While such advances are excellent in addressing some experimental questions in normative studies, however, they introduce additional complications for our experi-mental question related to ASD. Specifically, it has been established that there are reliable structural brain differen-ces in ASD, and as such, parcellation approaches which use structural information to define cortical “patches” for analyses may introduce potential confounds to the study (i.e., systematic group differences in brain morphology may introduce systematic differences in patch location, complicating interpretation of the results). Nonetheless, we feel the disadvantages of using a standard brain-atlas are outweighed by the important advantage that it enables a more direct comparison between data from different modalities, especially in the context of heterogeneity in ASD findings.
Recently, there has been an emergence of evidence indicating brain overconnectivity in children with autism, contrasting multiple prior reports of underconnectivity in ASD [Di Martino et al. 2014; Keown et al. 2013; Supekar et al. 2013; Uddin et al. 2013]. These studies in resting-state fMRI report hyperconnectivity in both long- and short-range intrinsic connections across multiple brain regions in young children with ASD. Such findings add weight to the argument that hyperconnectivity outweighs hypoconnectivity in ASD, while also painting a more complicated picture regarding where disrupted brain connectivity in ASD may be dependent on altered age-related trajectories. In view of these recent findings, a limitation to our study is the lack of longitudinal data in our cohort of ASD participants to comprehensively address this question. Furthermore, as adolescence is a period of heavy grey matter development within the brain, it will be interesting to characterize whether the functional alterations reported are directly related to structural alterations due to a difference in developmen-tal trajectory in this population. Future research should elucidate the developmental trajectory of altered MEG connectivity in ASD, as well at the relations between atypical neurophysiological interactions and underlying brain structure.
CONCLUSIONS
overconnectivity is expressed in the gamma band, whereas posterior brain regions exhibit a disconnection to wide-spread brain areas in slower delta, theta and alpha bands. Frequency-dependent alterations in network topology were also detected at both global and local levels of func-tional networks, suggesting an imbalance in cortical segre-gation and integration in functional brain networks.
Moreover, we uniquely demonstrate atypical
high-frequency network topologies involving frontal regions that are critical for social cognition, affording new insights into relations between neural oscillations, brain connectiv-ity and social cognitive deficits in ASD.
ACKNOWLEDGMENTS
The authors thank the children and families who partici-pated; Marc Lalancette, Tammy Rayner, and Ruth Weiss for their help in data collection; Tamara Powell and Vanessa Vogan for their help with recruitment and assess-ment of participants; Ryan Anderson and Simeon Wong for their technical help in construction of the data analysis pipeline; and George Ibrahim, Wayne Lee, and Benjamin R. Morgan for many stimulating discussions.
REFERENCES
Adolphs R, Gosselin F, Buchanan TW, Tranel D, Schyns P, Damasio AR (2005): A mechanism for impaired fear recogni-tion after amygdala damage. Nature 433:68–72.
Alexander GE, Crutcher MD (1990): Functional architecture of basal ganglia circuits: Neural substrates of parallel processing. Trends Neurosci 13:266–271.
American Psychiatric Association. (2013): Diagnostic and statistical manual of mental disorders, 5th ed. Arlington, VA: American Psychiatric Publishing.
Amodio DM, Frith CD (2006): Meeting of minds: The medial fron-tal cortex and social cognition. Nat Rev Neurosci 7:268–277. Arsalidou M, Duerden EG, Taylor MJ (2013): The centre of the
brain: Topographical model of motor, cognitive, affective, and somatosensory functions of the basal ganglia. Hum Brain Mapp 34:3031–3054.
Assaf M, Jagannathan K, Calhoun VD, Miller L, Stevens MC, Sahl R, O’Boyle JG, Schultz RT, Pearlson GD (2010): Abnormal functional connectivity of default mode sub-networks in autism spectrum disorder patients. Neuroimage 53:247–256. Balderston NL, Schultz DH, Baillet S, Helmstetter FJ (2014): Rapid
amygdala responses during trace fear conditioning without awareness. PLoS One 9:e96803.
Baranek GT (1999): Autism during infancy: A retrospective video analysis of sensory-motor and social behaviors at 9–12 months of age. J Autism Dev Disord 29:213–224.
Bardouille T, Ross B (2008): MEG imaging of sensorimotor areas using inter-trial coherence in vibrotactile steady-state responses. Neuroimage 42:323–331.
Belmonte MK, Allen G, Beckel-Mitchener A, Boulanger LM, Carper RA, Webb SJ (2004): Autism and abnormal develop-ment of brain connectivity. J Neurosci 24:9228–9231.
Benjamini Y, Hochberg Y (1995): Controlling the false discovery rate—A practical and powerful approach to multiple testing. J R Statist Soc Series B 57:289–300.
Bish JP, Martin T, Houck J, Ilmoniemi RJ, Tesche C (2004): Phase shift detection in thalamocortical oscillations using magnetoen-cephalography in humans. Neurosci Lett 362:48–52.
Blair RC, Karniski W (1993): An alternative method for signifi-cance testing of waveform difference potentials. Psychophysi-ology 30:518–524.
Bookheimer S (2002): Functional MRI of language: New approaches to understanding the cortical organization of semantic processing. Annu Rev Neurosci 25:151–188.
Brothers L (1990). The social brain: A project for integrating pri-mate behavior and neurophysiology in a new domain. Con-cepts Neurosci. 1:27–51.
Bullmore E, Sporns O (2009): Complex brain networks: Graph the-oretical analysis of structural and functional systems. Nat Rev Neurosci 10:186–198.
Bullmore ET, Bassett DS (2011): Brain graphs: Graphical models of the human brain connectome. Annu Rev Clin Psychol 7:113– 140.
Bullmore E, Sporns O (2012): The economy of brain network orga-nization. Nat Rev Neurosci 13:336–349.
Cheyne D, Bakhtazad L, Gaetz W (2006): Spatiotemporal mapping of cortical activity accompanying voluntary movements using an event-related beamforming approach. Hum Brain Mapp 27: 213–229.
Cheyne D, Bostan AC, Gaetz W, Pang EW (2007): Event-related beamforming: A robust method for presurgical functional mapping using MEG. Clin Neurophysiol 118:1691–1704. Coben R, Clarke AR, Hudspeth W, Barry RJ (2008): EEG power
and coherence in autistic spectrum disorder. Clin Neurophy-siol 119:1002–1009.
Cornwell BR, Baas JM, Johnson L, Holroyd T, Carver FW, Lissek S, Grillon C (2007): Neural responses to auditory stimulus deviance under threat of electric shock revealed by spatially-filtered magnetoencephalography. Neuroimage 37:282–289. Cornwell BR, Johnson LL, Holroyd T, Carver FW, Grillon C
(2008a): Human hippocampal and parahippocampal theta dur-ing goal-directed spatial navigation predicts performance on a virtual Morris water maze. J Neurosci 28:5983–5990.
Cornwell BR, Carver FW, Coppola R, Johnson L, Alvarez R, Grillon C (2008b): Evoked amygdala responses to negative faces revealed by adaptive MEG beamformers. Brain Res 1244: 103–112.
Cornwell BR, Salvadore G, Colon-Rosario V, Latov DR, Holroyd T, Carver FW, Coppola R, Manji HK, Zarate CA, Jr., Grillon C (2010): Abnormal hippocampal functioning and impaired spa-tial navigation in depressed individuals: evidence from whole-head magnetoencephalography. Am J Psychiatry 167:836–844. Cornew L, Roberts TPL, Blaskey L, Edgar JC (2012): Resting-state
oscillatory activity in autism spectrum disorders. J Autism Dev Disord 42:1884–1894.
Costafreda SG, Brammer MJ, David AS, Fu CH (2008): Predictors of amygdala activation during the processing of emotional stimuli: A meta-analysis of 385 PET and fMRI studies. Brain Res Rev 58:57–70.
Courchesne E, Pierce K (2005): Brain overgrowth in autism during a critical time in development: Implications for frontal pyrami-dal neuron and interneuron development and connectivity. Int J Dev Neurosci 23:153–170.
DeLorey TM, Sahbaie P, Hashemi E, Homanics GE, Clark JD (2008): Gabrb3 gene deficient mice exhibit impaired social and exploratory behaviors, deficits in non-selective attention and hypoplasia of cerebellar vermal lobules: A potential model of autism spectrum disorder. Behav Brain Res 187:207–220. Diaconescu AO, Alain C, McIntosh AR (2011): The co-occurrence
of multisensory facilitation and cross-modal conflict in the human brain. J Neurophysiol 106:2896–2909.
Dichter GS (2012): Functional magnetic resonance imaging of autism spectrum disorders. Dialogues clin neurosci 14:319–351. Di Martino A, Yan CG, Li Q, Denio E, Castellanos FX, Alaerts K, Anderson JS, Assaf M, Bookheimer SY, Dapretto M and others (2014): The autism brain imaging data exchange: towards a large-scale evaluation of the intrinsic brain architecture in autism. Mol Psychiatry 19:659–667.
Dimitriadis S, Laskaris N, Simos P, Micheloyannis S, Fletcher J, Rezaie R, Papanicolaou A (2013): Altered temporal correlations in resting-state connectivity fluctuations in children with read-ing difficulties detected via MEG. Neuroimage.83:307–317. Dosenbach NU, Nardos B, Cohen AL, Fair DA, Power JD, Church
JA, Nelson SM, Wig GS, Vogel AC, Lessov-Schlaggar CN, Barnes KA, Dubis JW, Feczko E, Coalson RS, Pruett JR Jr, Barch DM, Petersen SE, Schlaggar BL (2010): Prediction of individual brain maturity using fMRI. Science 329:1358–1361. Duerden EG, Mak-Fan KM, Taylor MJ, Roberts SW (2012):
Regional differences in grey and white matter in children and adults with autism spectrum disorders: An activation likeli-hood estimate (ALE) meta-analysis. Autism Res 5:49–66. Fornito A, Yoon J, Zalesky A, Bullmore ET, Carter CS (2011):
Gen-eral and specific functional connectivity disturbances in first-episode schizophrenia during cognitive control performance. Biol Psychiatry 70:64–72.
Fries P (2005): A mechanism for cognitive dynamics: Neuronal communication through neuronal coherence. Trends Cogn Sci 9:474–480.
Fries P (2009): Neuronal gamma-band synchronization as a funda-mental process in cortical computation. Annu Rev Neurosci 32:209–224.
Fusar-Poli P, Placentino A, Carletti F, Landi P, Allen P, Surguladze S, Benedetti F, Abbamonte M, Gasparotti R, Barale F, Perez J, McGuire P, Politi P (2009): Functional atlas of emo-tional faces processing: A voxel-based meta-analysis of 105 functional magnetic resonance imaging studies. J Psychiatry Neurosci 34:418–432.
Geschwind DH, Levitt P (2007): Autism spectrum disorders: Developmental disconnection syndromes. Curr Opin Neuro-biol 17:103–111.
Ghanbari Y, Bloy L, Christopher Edgar J, Blaskey L, Verma R, Roberts TL (2013): Joint Analysis of Band-Specific Functional Connectivity and Signal Complexity in Autism. Journal of Autism and Developmental Disorders:1–17.
Greimel E, Nehrkorn B, Schulte-Ruther M, Fink GR, Nickl-Jockschat T, Herpertz-Dahlmann B, Konrad K, Eickhoff SB (2013): Changes in grey matter development in autism spec-trum disorder. Brain Struct Funct 218:929–942.
Groen W, Teluij M, Buitelaar J, Tendolkar I (2010): Amygdala and hippocampus enlargement during adolescence in autism. J Am Acad Child Adolesc Psychiatry 49:552–560.
Haber SN (2003): The primate basal ganglia: Parallel and integra-tive networks. J Chem Neuroanat 26:317–330.
Hagmann P, Sporns O, Madan N, Cammoun L, Pienaar R, Wedeen VJ, Meuli R, Thiran JP, Grant PE (2010): White matter
maturation reshapes structural connectivity in the late devel-oping human brain. Proc Natl Acad Sci USA 107:19067–19072. Havenith MN, Yu S, Biederlack J, Chen N-H, Singer W, Nikolic D
(2011): Synchrony makes neurons fire in sequence, and stimu-lus properties determine who is ahead. J Neurosci 31:8570– 8584.
He Y, Wang J, Wang L, Chen ZJ, Yan C, Yang H, Tang H, Zhu C, Gong Q, Zang Y, Evans AC (2009): Uncovering intrinsic modu-lar organization of spontaneous brain activity in humans. PLoS One 4:e5226.
Herbert MR, Ziegler DA, Makris N, Filipek PA, Kemper TL, Normandin JJ, Sanders HA, Kennedy DN, Caviness VS, Jr (2004): Localization of white matter volume increase in autism and developmental language disorder. Ann Neurol 55:530–540. Hong SB, Zalesky A, Cocchi L, Fornito A, Choi EJ, Kim HH, Suh JE, Kim CD, Kim JW, Yi SH (2013): Decreased functional brain connectivity in adolescents with internet addiction. PLoS One 8:e57831.
Howard MA, Cowell PE, Boucher J, Broks P, Mayes A, Farrant A, Roberts N (2000): Convergent neuroanatomical and behaviou-ral evidence of an amygdala hypothesis of autism. Neurore-port 11:2931–2935.
Hung Y, Smith ML, Bayle DJ, Mills T, Cheyne D, Taylor MJ (2010): Unattended emotional faces elicit early lateralized amygdala-frontal and fusiform activations. Neuroimage 50: 727–733.
Hung Y, Smith ML, Taylor MJ (2012): Development of ACC-amygdala activations in processing unattended fear. Neuro-image 60:545–552.
Ioannides AA, Liu MJ, Liu LC, Bamidis PD, Hellstrand E, Stephan KM (1995): Magnetic field tomography of cortical and deep processes: examples of “real-time mapping” of averaged and single trial MEG signals. Int J Psychophysiol 20:161–175. Just MA, Cherkassky VL, Keller TA, Minshew NJ (2004): Cortical
activation and synchronization during sentence comprehension in high-functioning autism: Evidence of underconnectivity. Brain 127:1811–1821.
Just MA, Keller TA, Malave VL, Kana RK, Varma S (2012): Autism as a neural systems disorder: A theory of frontal-posterior underconnectivity. Neurosci Biobehav Rev 36:1292– 1313.
Kaiser J, Lutzenberger W (2005): Human gamma-band activity: A window to cognitive processing. Neuroreport 16:207–211. Kana RK, Keller TA, Cherkassky VL, Minshew NJ, Just MA
(2009): Atypical frontal-posterior synchronization of theory of mind regions in autism during mental state attribution. Soc Neurosci 4:135–52.
Keown CL, Shih P, Nair A, Peterson N, Mulvey ME, Muller RA (2013): Local functional overconnectivity in posterior brain regions is associated with symptom severity in autism spec-trum disorders. Cell Rep 5:567–572.
Kesler-West ML, Anderson AH, Smith CD, Avison MJ, Davis CE, Avison RG, Blonder LX (1999): A functional magnetic reso-nance imaging (FMRI) study of the perception of emotional facial expressions. J Cognitive Neurosci:82.
Kirsch P, Achenbach C, Kirsch M, Heinzmann M, Schienle A, Vaitl D (2003): Cerebellar and hippocampal activation during eyeblink conditioning depends on the experimental paradigm: a MEG study. Neural Plast 10:291–301.
Langen M, Schnack HG, Nederveen H, Bos D, Lahuis BE, de Jonge MV, van Engeland H, Durston S (2009): Changes in the developmental trajectories of striatum in autism. Biol Psychia-try 66:327–333.
Lau TM, Gwin JT, McDowell KG, Ferris DP (2012): Weighted phase lag index stability as an artifact resistant measure to detect cognitive EEG activity during locomotion. J Neuroeng Rehabil 9:47.
Li H, Xue Z, Ellmore TM, Frye RE, Wong ST (2014): Network-based analysis reveals stronger local diffusion-Network-based connectiv-ity and different correlations with oral language skills in brains of children with high functioning autism spectrum disorders. Hum Brain Mapp 35:396–413.
Liao W, Qiu C, Gentili C, Walter M, Pan Z, Ding J, Zhang W, Gong Q, Chen H (2010): Altered effective connectivity network of the amygdala in social anxiety disorder: A resting-state fMRI study. Plos One 5:e15238.
Liu L, Ioannides AA, Streit M (1999): Single trial analysis of neu-rophysiological correlates of the recognition of complex objects and facial expressions of emotion. Brain Topogr 11:291–303. Lord C, Risi S, Lambrecht L, Cook EH, Leventhal BL, DiLavore
PC, Pickles A, Rutter M (2000): The autism diagnostic observa-tion schedule-generic: A standard measure of social and com-munication deficits associated with the spectrum of autism. J Autism Dev Disord 30:205–223.
Luo Q, Holroyd T, Jones M, Hendler T, Blair J (2007): Neural dynamics for facial threat processing as revealed by gamma band synchronization using MEG. Neuroimage 34:839–847. Lynall ME, Bassett DS, Kerwin R, McKenna PJ, Kitzbichler M,
Muller U, Bullmore E (2010): Functional connectivity and brain networks in schizophrenia. J Neurosci 30:9477–9487.
Lynch CJ, Uddin LQ, Supekar K, Khouzam A, Phillips J, Menon V (2013): Default mode network in childhood autism: Postero-medial cortex heterogeneity and relationship with social defi-cits. Biol Psychiatry 74:212–219.
Mathewson KJ, Jetha MK, Drmic IE, Bryson SE, Goldberg JO, Schmidt LA (2012): Regional EEG alpha power, coherence, and behavioral symptomatology in autism spectrum disorder. Clin Neurophysiol 123:1798–1809.
McAlonan GM, Cheung V, Cheung C, Suckling J, Lam GY, Tai KS, Yip L, Murphy DG, Chua SE (2005): Mapping the brain in autism. A voxel-based MRI study of volumetric differences and intercorrelations in autism. Brain 128:268–276.
Mills T, Lalancette M, Moses SN, Taylor MJ, Quraan MA (2012): Techniques for detection and localization of weak hippocam-pal and medial frontal sources using beamformers in MEG. Brain Topogr 25:248–263.
Minshew NJ, Williams DL (2007): The new neurobiology of autism—Cortex, connectivity, and neuronal organization. Arch Neurol 64:945–950.
Minshew NJ, Keller TA (2010): The nature of brain dysfunction in autism: Functional brain imaging studies. Curr Opin Neurol 23:124–130.
Moses SN, Houck JM, Martin T, Hanlon FM, Ryan JD, Thoma RJ, Weisend MP, Jackson EM, Pekkonen E, Tesche CD (2007): Dynamic neural activity recorded from human amygdala dur-ing fear conditiondur-ing usdur-ing magnetoencephalography. Brain Res Bull 71:452–460.
Muller RA, Shih P, Keehn B, Deyoe JR, Leyden KM, Shukla DK (2011): Underconnected, but how? A survey of functional con-nectivity MRI studies in autism spectrum disorders. Cereb Cortex 21:2233–2243.
Murias M, Webb SJ, Greenson J, Dawson G (2007): Resting state cortical connectivity reflected in EEG coherence in individuals with autism. Biol Psychiatry 62:270–273.
Nickl-Jockschat T, Habel U, Michel TM, Manning J, Laird AR, Fox PT, Schneider F, Eickhoff SB (2012): Brain structure anomalies in autism spectrum disorder—a meta-analysis of VBM studies using anatomic likelihood estimation. Hum Brain Mapp 33: 1470–1489.
Nishitani N, Nagamine T, Shibasaki H (1998): Modality-specific subregions in human inferior parietal lobule: a magnetoence-phalographic study during cognitive tasks. Neurosci Lett 252: 79–82.
Noesselt T, Driver J, Heinze HJ, Dolan R (2005): Asymmetrical activation in the human brain during processing of fearful faces. Curr Biol 15:424–429.
Orekhova EV, Stroganova TA, Nygren G, Tsetlin MM, Posikera IN, Gillberg C, Elam M (2007): Excess of high frequency elec-troencephalogram oscillations in boys with autism. Biol Psychi-atry 62:1022–1029.
Ortiz E, Stingl K, Muenssinger J, Braun C, Preissl H, Belardinelli P (2012): Weighted phase lag index and graph analysis: Preliminary investigation of functional connectivity during resting state in children. Comput Math Methods Med 2012: 186353.
Palva S, Palva JM (2012): Discovering oscillatory interaction net-works with M/EEG: Challenges and breakthroughs. Trends Cognitive Sci 16:219–230.
Palva JM, Monto S, Kulashekhar S, Palva S (2010): Neuronal syn-chrony reveals working memory networks and predicts indi-vidual memory capacity. Proc Natl Acad Sci USA 10716: 7580–7585.
Papanicolaou AC, Pazo-Alvarez P, Castillo EM, Billingsley-Marshall RL, Breier JI, Swank PR, Buchanan S, McManis M, Clear T, Passaro AD (2006): Functional neuroimaging with MEG: normative language profiles. NeuroImage 33:326–342. Pereda E, Quiroga RQ, Bhattacharya J (2005): Nonlinear
multivari-ate analysis of neurophysiological signals. Prog Neurobiol 77: 1–37.
Perez Velazquez JL, Galan RF (2013): Information Gain in the Brain’s Resting State: A New Perspective on Autism. Frontiers in Neuroinformatics 7:1–10.
Peters JM, Taquet M, Vega C, Jeste SS, Fernandez IS, Tan J, Nelson CA, 3rd, Sahin M, Warfield SK (2013): Brain functional networks in syndromic and non-s