PENGARUH PEMBERI DENGAN Lactobacillu
DAN KADAR ASAM
PENGARUH PEMBERIAN TEPUNG MELINJO YANG DIFERMENT Lactobacillus fermentumTERHADAP KANDUNGAN
DAN KADAR ASAM URAT PADA TIKUS
SKRIPSI
Oleh :
Diah Lutfi Indawati NIM 062210101038
FAKULTAS FARMASI UNIVERSITAS JEMBER
2010
31
Baker, H., Hudson, J. J. and Chomson. 1980. The Laboratory Rat. Academic Press, Inc. California.
Berg, G. M. and Niels O. G. J. 2006. Purine and Pyrimidine Metabolism by Estuarine Bacteria. Aquat Microbial Ecology. 42: 215 – 226
Chamberlain, C. J. 1935. Gymnosperm : Structure and Evolution. University of Chicago Press, Chicago Illinois, Reptinted by Dover Publication 1966.
Choi, H. K., Karen, A., Ellizabeth, W. K., Walter, W. and Gary, C. 2004. Purine-Rich Foods, Dairy and Protein Intake and The Risk of Gout in Men. The New England Journal of Medicine, 350: 1093-1103
Collin, M. D. and Gibson. R. G. 1999. Probiotics, Prebiotics and Synbiotics: Approaches for Modulating the Microbial Ecology of The Gut. American Journal of Clinical Nutrition. 69:501-510
Deutscher, M. P. 1990. Method in Enzymology, Guide to Protein Purification. Tronto : Academic Press, Inc.
Dipiro, J. T., Talbert, R. L., Yee, G. C., Matzke, G. R., Wells, B. G. and Posey, L. M. 2002. Pharmacotherapy. A Pathophysiologic Approach. New York : McGraw-Hill.
Ganong, W. F. 2002. Buku Ajar Fisiologi Kedokteran. Jakarta: Penerbit Buku Kedokteran, EGC.
Grohs, B. M and Benno, K. 1994. Study of Purine Degradation in Aqueous Solutions By Paracoccus denitrificians. Current Microbiology. 28:255-259
Hawkins D.W., Rahn D.W. 2005. Gout and Hyperuricemia. Pharmacotherapy, Apathophysiological Approach, McGraw-Hill.
Hidayat, R. 2009. Gout dan Hiperurisemia. Medicinus.22: 47-50
Hose, H. and Sozzi, T. 1991. Biotechnology Group Meeting: probiotics – fact or fiction. J. Chem. Technol. Biotechnol.51: 539-570
32
Kong, L., Zhou, J., Wen, Y., Li, J., Cheng, C.H.K. 2002. Aesculin Possesses Potent Hypouricemic Action in Rodents but is Devoid of Xanthine Oxidase/Dehydrogenase Inhibitory Activity. Planta Med. 68: 175-178
Kruszewska, H., Aleksandra, M., and Urszula, C. 2004. Biodegradation of DNA and Nucleotides to Nucleosides and Free Bases. Il Farmaco. 59: 13-20
Lisal, J. S. 2005. Konsep Probiotik dan Prebiotik untuk Modulasi Mikrobiota Usus Besar. Journal of Medicinus Nutritive. 26: 256-262
Laemmli, U. K. 1970. Cleavage of Stuctural Protein During The Assembly of The Head of Bacterophage T4. Nature. 227: 680-685
Macfarlane and Cumming. 1999. Biomedical Journal. “Prebiotics and Probiotics : Can Regulating the Activities of Intestinal Bacteria Benefit Healt?”. Cambridge: Medical Research Council Dunn Clinical Nutrition Centre.
Manner, H. I. and Craig, R. E. 2006. Gnetum gnemon, Species Profiles for Pasific Island Agroforestry. http://www.tradisionaltree.com [ 18 Agustus 2009]
Napitupulu N.R., Kanti, A., Yulinery, R., Hardiningsih, dan Julistiono, H. 1997. DNA plasmid Lactobacillus asal makanan fermentasi tradisional yang berpotensi dalam pengembangan sistem inang vektor untuk bioteknologi pangan. Jurnal Mikrobiologi Tropis 1: 91-96.
Murray, R.K., Darly, K.G., Peter, A. M., Victor, W.R. 2003. Biokimia Harper, Edisi 24. Jakarta : EGC
Ogawa, J. 2006. Analysis of Microbial Purine Metabolism an Its Application for Hyperuricemia Prevention. Division of Applied Life Science, Graduated School of Agriculture, Kyoto University.
Pittman J.R., and Bross M.B. 1999. Diagnosis and Management of Gout. American Family Physician, The American Academy of Family Phisician.
Putra, T. R. 2006. Hiperurisemia, dalam Buku Ajar Ilmu Penyakit Dalam Jilid.II disusun oleh: Aru W. Sudoyo, Bambang Setiyohadi, dkk. Pusat Penerbitan Ilmu Penyakit Dalam Fakultas Kedokteran Universitas Indonesia: Jakarta.
Salminen, S., Bouley, C., Boutron-Ruault, M. C., Cummings, J. H., A. Franck, G. R. Gibson, E. Isolauri, M. C. Moreau, M. Roberfroid, I. R. 1998. Functional food science and gastrointestinal physiology and function. Brazil Journal of Nutrition.80: S147-S171
Schrezenmeir, J. and M. de Vrese. 2001. Probiotic, Prebiotic, And Symbiotics-Approaching A Definition. American Journal of Clinical Nutrition. 73: 361S-364S
Shortt C. 1999. The Probiotic century: history and current perspectives. Review on Trend Food Science And Technology.10:411-417
Siswoyo, T. A. 2004. Physicochemical Characteristics of Melinjo (Gnetum gnemon) Starch-Lipid. Jurnal Ilmu Dasar. 5: 97-10
Siswoyo, T. A., Tri, A., Dian, P. A. W. 2009. Study of Purine Degradation in Aqueous Solution by Lactobacillus fermentum. In: Proceeding of International Conference Biologycal Science, Faculty of Biology, Gadjah Mada University, Yogyakarta. Strompfova, V., Laukova A., Fialkovicova M., Bogovic, M. B. 2004. Lactobacillus casei
ADI- a promising canine probiotic. In: Proceeding of International Conference, New Perspectives of probiotics. Kosice, Slovak Republik.
Usmiati, S. dan Sri, Y. 2005. Potensi Probiotik Bifidobacterium Sp Untuk Menunjang Kesehatan.Medika. 31:114-118
Verheij, E. W. M., R. E. C. 1997. Sumber Daya Nabati Asia Tenggara 2, Buah-Buahan Yang Dapat Dimakan. Jakarta: Gramedia Pustaka Utama.
Yonetani, Y and Iwaki, K. 1983. Effects of uricisuric Drugs and Diuretic on Uric Acid Excretion in Oxanate-treated Rats. Japan J. Pharmacol. 33:947-954
Yulinery, T., Eko, Y. dan Novik, N. 2006. Uji Fisiologis Probiotik Lacobacillus sp. Mar 8 Yang Telah Dienkapsulasi Dengan Menggunakan Spray Dryer Untuk Menurunkan Kolesterol. Biodiversitas.7:118-123
34 LAMPIRAN
1. KURVA STANDART
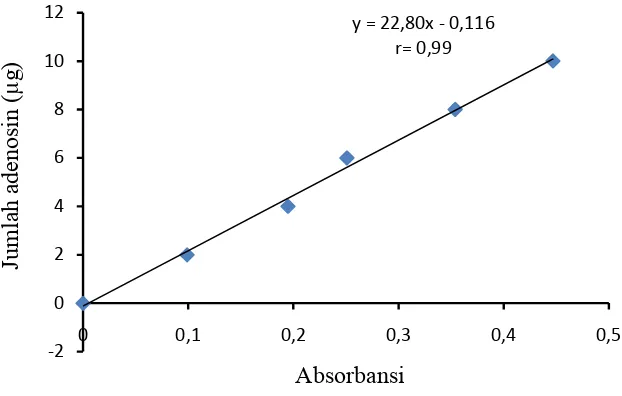
[image:5.612.168.479.459.657.2]1.1 Kurva Standart Adenosine
Tabel konsentrasi dan absorbansi standart adenosin ∑ Adenosin (µg) Absorbansi
0 0 2 0,099 4 0,195 6 0,251 8 0,354 10 0,447
Kurva standart adenosin
y = 22,80x - 0,116 r= 0,99 -2 0 2 4 6 8 10 12
0 0,1 0,2 0,3 0,4 0,5
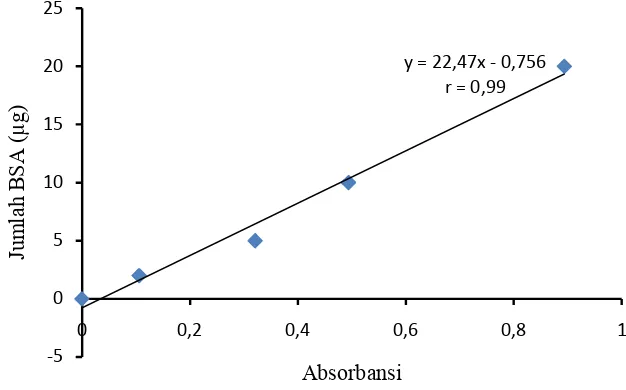
1.2 Kurva Standart Protein
Tabel konsentrasi dan absorbansi standart protein
∑ BSA (µg) Absorbansi
0 0
2 0,106
5 0,321
10 0,494
20 0,894
Kurva standart protein
y = 22,47x - 0,756 r = 0,99
-5 0 5 10 15 20 25
0 0,2 0,4 0,6 0,8 1
Jum
la
h
B
S
A
(
µ
g
)
36
2. SODIUM DEDOKSIL SULFAT POLYACRYLAMIDE GEL
ELEKTROPHORESIS SDS-PAGE
Komposisi Lower Gel
Komponen 12 %
Aquadest 3,35 mL
Tris pH 8,8 2,5 mL
10% SDS 0,1 mL
Akrilamide 4 mL
APS 50 µL TEMED 5 µL Komposisi Upper Gel
Komponen 4 %
Aquadest 6,1 mL
Tris pH 6,8 2,5 mL
10% SDS 0,1 mL
3. VOLUME MAKSIMAL PEMBERIAN LARUTAN SEDIAAN UJI PADA BEBERAPA HEWAN UJI
Jenis hewan uji Volume maksimal (mL) sesuai jalur pemberian
i.v i.m i.p s.c p.o
Mencit (20-30 g) 0,5 0,05 1,0 0,5 – 1,0 1,0 Tikus (100 g) 1,0 0,1 2 – 5 2 – 5 5,0
Hamster (50 g) - 0,1 1 – 2 2,5 2,5
Marmot (250 g) - 0,25 2 – 5 5,0 10,0
Kelinci (2,5 Kg) 5 – 10 0,5 10 – 20 5 – 10 20,0 Kucing (3 Kg) 5 – 10 1,0 10 – 20 5 – 10 50,0 Anjing (5 Kg) 10 – 20 5,0 20 – 50 10,0 100,0
38
4. HASIL ANALISIS DATA 4.1 Hasil Analisis Data In-Vitro
ANOVA protein
Sum of
Squares Df
Mean
Square F Sig.
Between
Groups 9,413 6 1,569 9,477 ,000
Within Groups 3,477 21 ,166
Total 12,890 27
Uji Duncan Multiple Comparisons
Protein
kelompok N
Subset for alpha = .05
1 2 3
1 4 7,0800
2 4 7,8900
4 4 8,3950 8,3950
24 4 8,4850 8,4850
16 4 8,6825
6 4 8,7675
8 4 8,8375
Sig. 1,000 ,062 ,181
4.2 Hasil Analisis Data In-Vivo
Tests of Normality
Kolmogorov-Smirnov(a) Shapiro-Wilk
Statistic df Sig. Statistic df Sig.
kadar ,167 9 ,200(*) ,909 9 ,312
* This is a lower bound of the true significance. a Lilliefors Significance Correction
Test of Homogeneity of Variances kadar
Levene Statistic df1 df2 Sig.
,412 2 6 ,680
ANOVA kadar
Sum of
Squares df Mean Square F Sig. Between Groups 20,047 2 10,023 68,863 ,000
Within Groups ,873 6 ,146
40
Uji Duncan Multiple Comparisons
kadar
kelompok N
Subset for alpha = .05
1 2 3
Duncan(a) 1 3 2,2333
3 3 3,7000
2 3 5,8667
Sig. 1,000 1,000 1,000
Means for groups in homogeneous subsets are displayed. a Uses Harmonic Mean Sample Size = 3,000.
1: kelompok non treatment 2: kelompok melinjo
5. Dokumentasi Penelitian
Biji Melinjo (Gnetum gnemon) Tepung Melinjo Terfermentasi
Keterangan:
1. Suspensi melinjo
2. Suspensi .melinjo terfermentasi 3. Potassium oxonat
1
1 2 3