ICACSIS
2013
ISBN: 978-979-1421-19-5zyxwvutsrqponmlkjihgfedcbaZYXWVUTSRQPONMLKJIHGFEDCBA
Support V ector R egression M odelling for R ainfall
Prediction in D ry Season Based on
Southern O scillation Index and N IN 03.4
Gita Adhani'.
Agus Buono',
Akhmad
Faqih2
zyxwvutsrqponmlkjihgfedcbaZYXWVUTSRQPONMLKJIHGFEDCBA
IzyxwvutsrqponmlkjihgfedcbaZYXWVUTSRQPONMLKJIHGFEDCBA
Department of Computer Science. -'Department of Geophysics and MeteorologyFaculty of Mathematics (Ind Natural Sciences. Bogor Agricultural University
Email : [email protected]@[email protected]
Abstract-Various c1imate disasters in lndonesia are mostly related to the El Nino Southern Oscillation (ENSO) phenomenon. The variability of etimate especially rainfall is strongly related to this phenomenon. Southern Oscillation Index (SOl) and sea surface temperature anomaly (SST A) at Nin03.4 region are two common indicators used to monitor phenomenon of El Nino and La Nina. Furthermore, SOl and NINO SSTA can be the indicator to find the rainfall probability in a particular season, related to the existing condition of c1imate irregularities. This research was conducted to estimate the rainfall during dry season at Indramayu district. The basic method used in this study was Support Vector Regression (SVR). Predictors used were SOl and NIN03A sea surface temperature (SST) data. The expcrtments wcre conducted by comparing the model performance and prediction rcsults, The training set was c1ustered in advance and then SVR model was generated using RBF kernel based on their c1ustering result. This research obtaincd an SVR model with correlation coefficient of 0.76 and NRMSE error value of 1.73.
I. INTRODUCTION
Clirnate is one of natural ecosystem cornponents that has a rnajor influence on the various sectors of human life. Indone ia as an agricultural country is dependent
Manuscript rcccivcd June 28. 2013. This wor],
zyxwvutsrqponmlkjihgfedcbaZYXWVUTSRQPONMLKJIHGFEDCBA
\-a~supponcd 111 part h~ the Computer Science Department of Bo~('r :\~ricultllrall inivcrvrtv (i3:\lJ). Center for Climatc Risk and Opportunuy Management ln Southcast Asia and Pacific (CCRO"I·Sh\J». Bogor Agncultural Univer sir, (13:\11), United States :\genc\ for Intemational Development (US/\ID).
Gita Adham IS WIth the Computer SCience Department. Bogor Agricultural I inivcrsitv. PO BOX IA6RO 11'f)O:"FSIA Icorrcsponduig author to prol Ide phone "6~8~J(,60 I 59R-l. c-rnail adharu gita II gmarl.cornj
Ag'" I\1I"no IS with the Comrilter Science Department. B()~nr Agncultural 1'ruvcrsuv. PO nox 166RO INIX)~I·.SIA (e-mail pudcsha 1/grnarl com)
Akhmad laqrh IS wrth the (ieophyslcs and ~letcor('i<'g~ Department. Bogor Agricultural 1'ruvcrsrtv. pt) BOX I(,(,/(O
INIX)~I'SL·\ lc-mad akhmadfaqih (/ gmad corn )
on elimate condition and weather. Climate and weather are crucial factors to suceesses agricultural and plantation. Knowledge of climate patterns and weather can help in making deeisions eropping patterns and plant varieties appropriate in difTerent areas.
Various clirnate disasters in lndonesia are mostly related to the El Nino Southern Oscillation (EN50) phenornenon. Climate variability, especially rainfall, is strongly related to jhis phenornenon. Generally, El Nino impact on rainfall deereasing or even drought. otherwise La Nina influenees on rainfall increasing which can cause flooding [I].
La Nina causes curnrnulation of air rnass that contains alot of water vapor in the lndonesia atrnosphere thus potency of rain clouds fonning enhanccs. As a result, although the middle of 20 I 0 dry season, it still could be raining in rnany regions with low up to high intensity [2].
El Nino phenornenon gives more serious impact than La Nina. El Nino causes rainfall in most area in lndonesia rcduced. This rainfall decreasing rate IS really dependent on intensity and El Nino duration. El Nino is noted onee caused long-term drought 111
lndonesia. Rainfall information cluring dry season is greatly needed in agricultural and plantations. Rainfall forecasting during dry season can be used as information for larmers to mitigate any cases that can be happcned like preproduction drought that lead to crop failure.
This research porpose to forecast rainfall during dr)' season by took case study in Indramayu region using Support Vector Regression (SVR) and related variables uscd are Southern Oscillation Index (501) and sea surface ternperature (SST) at NINO 3.4 region. SVR is Support Vector Machine (SVM) is used for regression case.
ICACSIS
2013
downscaling model ing of GCM data using support vector regression to predict monthly rainfall in district of Indramayu. The results is quite good to predict rainfall in normal conditions, however it is neither extreme case [4].
II. METHOD
zyxwvutsrqponmlkjihgfedcbaZYXWVUTSRQPONMLKJIHGFEDCBA
A. Problem ldentification and Formulation
SOl and NINO sea surface temperature anomaly (SST A) are used as indication in monitoring of El Nino and La Nina phenornenon that is.' commonly cal led by El Nino Southern Oscillation (ENSO). Southern Oscillation Index (SOl) is anornalies of air pressure difTerence in the Tahiti surface in Polynesia islands, French. with Darwin surface, Australia. The sustainable of SOl negative values below -8 shows El Nino phenomenon while SOl positive values above 8 shows La Nina phenomenon [5]. The more negative SOl values mean stronger warm event, whereas positive SOl values the stronger event cold event [6].
NINO is an index
zyxwvutsrqponmlkjihgfedcbaZYXWVUTSRQPONMLKJIHGFEDCBA
ofsea surface ternperature. NINO is obtained by taking the average value of the surfaceternperature in a given area. There are 4 NINO areas according to IRI [7], narnely NINO I+2, NIN03, NINO].4, and NIN04. NINO I+2 region is located between 0 0 - 100 Sand 80 0 - 90 0 W. This area was
first rise in temperature when El Nino occurs. NINO] region lies in the middle of the Pacific Ocean between 5 0 N - 50S and 90 0 - 150 0 W which is the zone
most closcly related to El Nino conditions. NIN03.4 region located between the equator 50
S - SON and 1700
- 1200 W and have a great variability in the time
scale El Nino. NIN04 lies in the western of Pacific Ocean betwcen 50N - 50S and 1500 W - 1600 E.
ENSO takes important rule in extrerne variability rain conditions. Fluctuations of ENSO occurance in Pacific Ocean is highly related to rainfall in lndonesia [8] For global climate variability, NINO 3.4 is more frcqucntly used that has broad impact sea surface ternperature variability in this state has thougest effect on rainfall friction in West Pacific [7]. West to Central Pasific friction causes the heating location changes this lcad of mostly global atmospheric circulation. Boundary of this research is also appointed so that the scope is not too bread or too narrow. Flowchart of th is research method can be seen in Figure I.
B. Data Preproccssing
Data used are Southern Oscillation Index (SOl). NINO ].4 SST. and rainfall during dry season precipitation obscrvation data the dry season observe data. SOl and NINO SST data are derividc from Australian Bureau of Meteorology (BOM). SOl data used is from 1876 up to 2012. whercas NINO SST data is from 1950 lip to 20 I O. Rainfall observed data is through 196:' up to 20 I 0 are dcrivide from Badan
Meteorologi Klimotologi
zyxwvutsrqponmlkjihgfedcbaZYXWVUTSRQPONMLKJIHGFEDCBA
Jail Gen/is/ka (BMKG) through wcather station in the district of Indramayu.ISEN: 978-979-1421-19-5
-- ---_.This research oni: used
May
up to February SOl data in 1970 until 20 I O. So is the case with NINO ].4 data and the observed data is referred to SOl data time range.Problem ldcnutlcuuon and
lormulanon
[Jala laklng
t)h:--~'r'.~tlon Data
\UI \L"·\"CD. \I~O 3.~ SST
\1;1\ -lcb, and "II n 1,111 Jn di"\
-cason J;)t.l
zyxwvutsrqponmlkjihgfedcbaZYXWVUTSRQPONMLKJIHGFEDCBA
S V R Clustcr
-
-:ljtJu
-~--- -~---
-
--f.:c~c~ __
I I
I I
I I
I I
L 1
(ind
zyxwvutsrqponmlkjihgfedcbaZYXWVUTSRQPONMLKJIHGFEDCBA
L - _
ICACSIS 2013
ISBN: 978-979-1421-19-5
I. Rainy Zone I and Ujing Garis 2. Rainy Zone 2 3. Rainy Zone 3 and Wanguk
: Losarang, Pusaka Negara, Sukra,
: Sudikampiran and Sudirnampir : Lawang Semut, Teluk Kacang.
4. Rainy Zone 4 : Rentang. Sukadana, and Tugu 5. Rainy Zone 5-'-6 : Sumurwatu, Taminyang, and Slamet
Rainfall during dry season is obtained from summary of May up to August perdasarian rainfall. Afterwards of RaZ I until RaZ 5+6 mean value for Beach rainfall periode years is calculated. SOl and. NINO 3.4 data is obtained by using May untii February data for each rainfall period years.
Data division aim to find out training data and tested data. Training data is used to form SYR model while tested data is for calculating obtained SYR models accuracy. Tested data used is only applied in a year along.
C
zyxwvutsrqponmlkjihgfedcbaZYXWVUTSRQPONMLKJIHGFEDCBA
Clustering by Ward Method Clustering using ward method is implemented inSOl. NINO 3.-1 SST. and rainfall during dry season data by random partition in k c1uster. This method embark the grouping on research units that have similar characteristics are analogous to the closest distance. Next, this training data would be divided into some clusters according to the appointed k cluster. After get classes that showed the closest characteristics then cluster detection process is carried on the tested data. Testcd data using SYR models corresponding to
its cluster.
zyxwvutsrqponmlkjihgfedcbaZYXWVUTSRQPONMLKJIHGFEDCBA
D. SI
zyxwvutsrqponmlkjihgfedcbaZYXWVUTSRQPONMLKJIHGFEDCBA
R ModellingSYR is implementation of Support Vcctor Machine (SYM) for regression case. The output in regression case is real numbers or continuous. SYR is a method th at can overcorne the overfining, 50 it will produce a
good performance [9J. The basic idea of Support Yector Regression to detennine which data sets are dividcd into training scts and test sets. Thcn detennined from the training set of a regression function with a certain deviation limits th us produce a prediction that close to the actual target. Training data is processed using SVR training to obtain the model with the data used SOl. NIN03.4 SST. and dry season rainfall data as input for training.
SVR process is implcmentcd in each cluster that has becn fonned in clustering step. SVR uses kernel functions to transform the non-linear input into the feature space that dimcnsion is higher due to problems in the real world are rarely lincar separable gene rally.
As for some of kernel functions are: - -I. Linear Functions
Linear function equation is
k(x, y)
=
xT Y+
c
2. Polynornial FunctionsPolynornial function Equation is kCx.y)
=
(arTy+
C)d3.zyxwvutsrqponmlkjihgfedcbaZYXWVUTSRQPONMLKJIHGFEDCBAGaussian function (RI3F)
RBF function equation is
k(x,y)
=
e.x
:p(-rll
x _
y1l2)Kernel function used in SYR are linear, polynomial, and RBF kernel functions. Model performance of kernel function can be known by its correlation coefficient and NRMSE error value. Each kernel function has parameter value that must be appointed firstly. Parameter C value is referred to linear kernel function. parameter C, y. r, and d value is referred to polynomial kernel function, whereas parameter C and y is referred to RBF kernel function. The parameter value gives big impact on resulted SYR model. The more optimal parameter, it means the better resulted model. Search of kernel function optimum parameter uses grid search.
E. Test
Cluster detection is implemented to tested data that are SOl and NIN03.4 SST value in one year along. Detection is applied using Squared Pearson calculation to detect cluster in tested data. Next, tested data whose cluster has been known is proceed bv SVR model
based on its c1uster.
-ln this step. tested data is used as input for SVR rnodels to get of predicted value. The test based on appropriate SVR models with categorized cluster of that tested data.
F. A na/ysis and Eva/liat ion
Accuracy and eror calculation of predicted results using SVR model to tested data uses correlation cocfficicnt (R) and Nonnalized Root Mean Square Error (NRMSE)_ Model compability is considered good if R value is close to I and NRMSE is close to O. Correlation coefficicnt showed strong relation bctween two variables. It is described bellow about correlation coefTicient R equation:
legend:
x.: actual value / observed value
,I', :predicted value
11 :data amount
Error value is used to deterrnine deviation of estimated value against the actual value. Error calculation uses Normalized Root Mean Square Error (NRMSE). It is described bellow about NRMSE equation:
Il
'\ll (x - v)~...JnL.;=l -oi - - i
1\'RMSE=
-'---legend:
.r, : actual value Iobserved value r, : predictcd value
11 :data amount
B. Model Performance Based
zyxwvutsrqponmlkjihgfedcbaZYXWVUTSRQPONMLKJIHGFEDCBA
011SVR KernelFunction
zyxwvutsrqponmlkjihgfedcbaZYXWVUTSRQPONMLKJIHGFEDCBA
This research used 30 annual training data clustered
by k =3. Clustering and its detection process on tested
data were applied by software named MINITAB 16.
Each c1uster has SVR model with three SVR kernel
function. such as Polynornial.
Linear,
and RBF kernel.Cluster detection on test ed data
aimed
to obtainoptimal prediction results by using appropriate SVR
models. Annual tested data would use SVR models
suited with its c1uster. SVR kernel function
perforrnance could be seen from its correlation rate
and error values of each kernels obseved data. The
model performance is considered good if its
correlation rate is high and prediction error value is
low.
Training using SVR needs parameter suitcd with its
kernel. To get optimal kernel, grid search irnplemented
in the training is done. Parameter C value is referred to
Lincar kernel function. Parameter C and y value is
referred to Polynomial and RBF kernel function.
Based on calculation correlation and NRMSE. SVR
mode ls with RI3F kernel function has highest
correlation value and the lowest error. cspccially
correlation value (R) is 0.76 and NRMSE value is
l ,73. Best do worst
pcrformance
model in sequenceare RBF, Linear, and Polynornial. Table I shows
correlation and NRMSE error value of each kernel.
Best pararneters setting for RI3F kernel as the result of
grid search is showed by Table 2.
"\1\[31.[ I
CURRU.!\TION VALUES ANDNRMSF \lASI.\) Kt:RNEI.
zyxwvutsrqponmlkjihgfedcbaZYXWVUTSRQPONMLKJIHGFEDCBA
_IC_A_C_S_I_S_2_0_13
I~SB~N~:9~-~~~~~~5
Gi
deviasi standard of predictionzyxwvutsrqponmlkjihgfedcbaZYXWVUTSRQPONMLKJIHGFEDCBA
111. RESUL TS AND DISCUSSION
A. Data and Predictors Selection
Rainfall data used in the research is sourced from
Indonesia bureu of
Meteorology
CI irnatology andGeophysics (Badan Meteorologi Klimatologi dan
Geofisika, BMKG). More detailed information about
the data used can be found in
Chapter
Methodology.The election of SOl and NIN03.4 SST as a predictor
of SVR modeling as it relates to rainfall in dry season. .:
More proper predictors are used, bener the resulting
model. SOl and NINO is one of indicators of the
ENSO phenomenon affecting etimate.
Comrnonly, lndonesia has two
seasons,
rainy and dryseasons in where rainy season is main factor as most
irnportant part Indonesian tropical c1irnate [10]. Other
main factors that influence Indonesian c1imate are
monsoon and many other processes like the El Nino
Southern Oscillation (ENSO). Global symptorns
appearance such 3S El Nino and 1.3 Nina that are
caused by ENSO can be predicted by observing
anomaly repetitions happened 111 sea surface
temperature.
SOl is anornalies of air pressure difference in the
Tahiti surface in Polynesia islands, French, with
Darwin surface, Australia. This natural phenomenon is
followed by deviations of rainfal! circulation and
patterns. SOl negative value cornrnonly indicatc El
Nino phenomenon whereas the positif one which is
connected to stronger the Pacific trade winds and
warmer sea ternpcrature in north of Australia Mans La
Nina phenomenon.
Besides global variablc that givcs impact on El Nino
and La Nina phenomenon is NINO sea surface
tempcrature anornaly, Changes sea surface tempcraturc
is closely related to the symptom happencd at
transforrnation atrnosphere. Symptom is necessary to
be obscrve because of the existance of sea-atrnosphere
bilateral influence. El Nino and La Nina extreme
syrnptorns is appcared because this interaction by the
sea. NINO 3.4 is considered more appropriate to be
used than othcr NINOs. Sea surface tcrnperature
variabiliry in this state has the haighest effect on
rainfal! friction in West Pacific. West-to-Central
Pacific friction causcs the hearing location change thus
lcad of mostly global atmospheric circulation [7). 50.
501 and NINO 3.4 is us ed as predictor to prcdict
rainfall during dr)' season.
Not Ever months of 501 and NINO 3.4 SST's
variablcs would be used as prcdictor. The months uscd
are May up to February in next year. This election
airned to predict rainfall during dry season of MJJ/\
(May June July) in next year as well.
Kernel Correlation NRMSE
RBF 0.76 1.73
Linear 0.13 -137
Polynornial -0.27 357.54
Every annual tcstcd data amrnountcd to 10 ycars
becarnc different mernber cluster. Each clustcr of one
test ed data event has SVR models with dissimilar
optimal parameter.
More explanation of kernel function pcrformancc in
SVR model was dcscribed in Figure 2 cornparison
graph and scatter plots graphs. Cornparison graph
identificd relation between obscrvarions (i\1JJA
RrDS) and prcdiction rcsults of cach kernel function.
A strong connection between observ at ion and
prcdiction showcd more solid corrclation and the
smaller error between observed and predicted values.
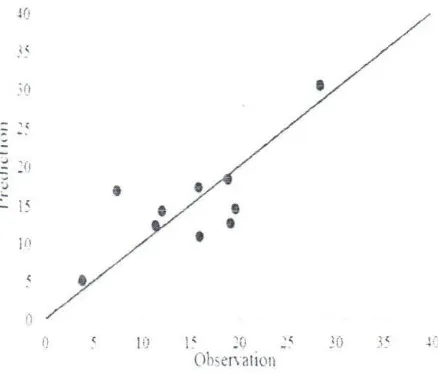
Scatter piot in Figure 3 dcscribcd relation pattern
bctwccn observed and predicted values. l.incar
connection formed straight line indicated that there arc
close correlation bctween observed and prcdictcd
\ aluc. It can be seen th at using RAr kernel inc ludes
strong connection betwccn obscrvation and prcdiction
,.
"
zyxwvutsrqponmlkjihgfedcbaZYXWVUTSRQPONMLKJIHGFEDCBA
ICACSIS
2013
TABLE 2
BEST PARAMETERS SETTING FOR RBF KERNEL
Tested Year Cluster Best C Best?
zyxwvutsrqponmlkjihgfedcbaZYXWVUTSRQPONMLKJIHGFEDCBA
200012001 2 45.25 32
2001/2002 2 2.83 ~')
zyxwvutsrqponmlkjihgfedcbaZYXWVUTSRQPONMLKJIHGFEDCBA
. J _
200212003 2 ~7. J _
1.73x1O-l
2003/2004 3 ~7. J _ 6.IOxI0-5
2004/2005 2 2 ~7. J _
200512006 0.25 0.0625
2006/2007 3 lAI ~')
. J ~
2007/2008 3 33554432 3.05x I 0.5
2008/2009 2 8 0.13
2009/2010 2 134217728 4.2IxIO·3
~0
.,
5..;0
'(
Z
:- :'1
~ < I'
:::: 10
"
- - Ot>s<>J'I<lSI -- RBF
o
I"g 2 Cornpanson graph bciwccn obscrvation and prcdicuon based on the R 111'kernel pcrforrnance
•
•
•
•
••
ln
•
•
n
10 i~ 10 "
Observat ion
"
.t ,
30
f·'g.1 ",atin plot obxcrvations with R BI-' kernel function prcdicuons
ISBN: 978-979-1421-19-5
C
zyxwvutsrqponmlkjihgfedcbaZYXWVUTSRQPONMLKJIHGFEDCBA
Analysis and Evaluation ResultsRainfall during dry season prediction using SYR
results varied correlation coefficient and NRMSE
error values. After training data clustering and tested
data
cluster
detection, it was obtained the best modelwith the highest correlation rate and the lowest error.
Based on SYR best model obtained is using RBF
kernel by SOl and NINO 3,4 SST variables in May up
to February. NRMSE error value in RBF kernel
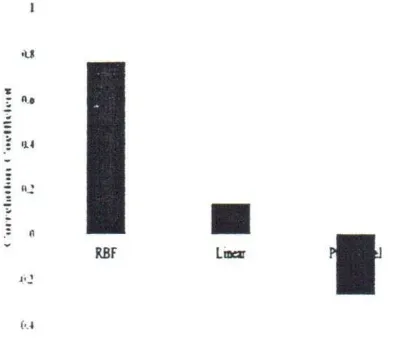
function is 1.73 as seen in Figure 4. Correlation
coefficient value for each kernel function has invers
value th.;n its NRMSE error value, as seen on Figure
5.
.100
~O
.100
: ~
;,0:
;; :00
~
z I,G
100
50
1.73
RBF
35i~
Linur P.l~1I.mi21
Fig -1. NRMSE of 3 kernel function
Correlation coefficient RBF kernel is 0.76. lt
showed that 76% of observation value total variety can
be cxplained by its linear relation with predicted value.
Correlation coefficient Linear kernel is 0.13. It
showed thai 13% of observation value total variety can
be cxplained by its linear relation with predicted value.
Correlation coefficient Polynomial kernel is
-0.27. It explained that negative correlation coefficient
has invers connection. It rneans if the observed value is
high. predicted value would be low as well and vice
versa. The correlation coefficient value indicates that
26% of observation value total variety can be
explaincd by its linear relation with predicted value.
lY. CONCLUSION
This research results the best of Support Yector
Regression (SYR) model in rainfall during dry season
forccasting with highest correlation coefficient value,
and lowest NMRSE value using SOl and NINO 34
SST data. Tested data using SYR model suited with ili
clustcr to calculate rainfaIl during dry season
prediction value. The SYR model is obtained by using
Radial Basis Function (RBF) kernel function and
training data clustcr amounted to k = 3. Correlation
cocfficicnt rcsult gained is 0.76 and NRMSE error
value is 1.73. Polynornial kernel function has worst
pcrformance by its lowest correlation coefficicnt and
highest NMRS[ error values. lt is caused by
[image:5.595.48.267.604.791.2]ICACSIS
2013
zyxwvutsrqponmlkjihgfedcbaZYXWVUTSRQPONMLKJIHGFEDCBA
·U
..
.:
...
;,
;'H
-
n.:
-•
;,
..
RBF la
J."'..!
FIg 5 Obscrv Jhon correlation coefficient graph with iIS
prediction us mg :1 kernel function
incompatibility of function configuration with the data
or wrong parameter range election when doing grid
search.
Gita I\dhani thanks to Computer Science
Department, Bogor Agricultural University for the
supervision: Center for
Climate
Risk and OpportunityManagement in Southeast Asia and Pacific
(CCROM-S[i\P). RAlI. for the supported data: United States
Agency for Intemational Development (USI\ID) for
partly supportcd financial;
zyxwvutsrqponmlkjihgfedcbaZYXWVUTSRQPONMLKJIHGFEDCBA
Direktorat JenderalPendidikan Tinggi (DIKTI) through the Bantuan
Operusiona! Perguruan Tinggi
zyxwvutsrqponmlkjihgfedcbaZYXWVUTSRQPONMLKJIHGFEDCBA
Negeri (BOPTN)Kcsc,m;1! Prograrn for partly supportcd financial.
ISBN: 978-979-1421-19-5
REFERENCES
III Esuningtyas W. wigena A H. 2011. Teknik SIa1istQI Downscaling dengan Regrcsi Komponen Utama dan Rcp::si Kuadrat T erkecil Parsial untuk Prediksi Curah Hujan PIda Kondisi El :,\ino. La Nina dan Normal. Jurnal .'.Ieteorolort danGeofisika. IZ(I }:65- 7:!.
[21 [BMKGI Badan Meteorologi Klimatologi dan GeofISika OO).
20 I O. Hujan di Musim Kemarau Dampak La tf••.
[downloadcd 2012 ~o' 251· Available:
hnpIlw \\\, bmkg.go.idlRB\lKG_ Wilavah_9/LainJ..ainlAni; clIHUJA~ _ DI_ \ILISIM_KEM.-\RAU _DAMPAK_LA_NINA. brnkg
(3I l.arasan. ;{. 2012 Prediksi awal musim hujan mengguna. data southen- »scittauon mdcv dcngan metode Support VCCb
Regressron Isl..lIpsil Bogor (lOr Bogor AgricuItunI Umvcrsity
1-1I Agrnalaro MA 20II Pemodelan "lali,li,al downscaling CbIa
GC\ 1 menggunakan support vcctor rcgrcssion untuk
mempred.k sr curah hujan bulanan lndramuyu [thesis]. Bogor (ID,. Bogor Agrrcultural Uruversuv
[51 [BOM) Bureau of Mcteorology. 2002 Clirnate GIossary • Southern Oscillation Index (SOl) [downloadcd 2013 Jun 29).
Avarlablc hnp IIreg bom gov.au/climatc/ glossaryisoi.shtml.
(I.) ·\s·s~a~lIr AR 2(I{. 7 ldenufik asr hubungan tluktuasi nilai
':i()! terhadap lurah hujan bulanan JI kawasan
BalUklllU-B;.:Ju~ul. B~!I ,'B:m:: Lrsr.:r: .,!~: !23·12C.)
171 (IRII 111( lntcrnauonal Research lnsutute tor Climate and Socictv (;S, 2007 Munltormg H,SU [downloaded 2012
~u, 25). Available:
hup 11111columbia cdu/clllnat(/I.NSO/bal:lglllul1d/monitoring.. htrnl
(R) Aldrran, E. I.D Gatcs, and F II Widodo 2007. Seasooal vanahllll~ of lndoncsian rarnfall 111FCIIAI\14 sirnulations and ln the rcan;II\sc, lhc role "I'I:N\() Thcorcncal and Appl.~d
C/II,,,llology X7 -11-:'9 dOI I(I I007i,0070-l-006-0218-8 (<iI "m!'(a AJ. "Chl1(k,,/,r 1\ 200-1 ..\ I utor ial lin Support Vector
Rq;rc.:~sl\>n .')"ilIIH ,C f, and CnmpullIl>! l--l 1l)9·~22
1101 ~ICU\\UIt S. \1c(ircgllr (iR ('lX2 l romcn! Cl rmatology .i"
In/rnt/uC"PI1 111I h •.- tlnn.n« (~f 7hc rll\!' I.alo"c/e Chichesrer
[image:6.607.97.298.100.274.2]