iii
ACKNOWLEDGEMENT
First and foremost, all the praise to Allah the Al-mighty for his blessings and benevolence, that his project has been successfully completed. By the Grace of Him and His Knowledge that He granted me, I have been able to write this humble report to the completion.
With sincere gratitude and appreciation, I would like to thank my supervisor, Mrs. Ainil Jessita binti Jalal for her valuable guidance and encouragement throughout the accomplishment of this project. All her advice and ideas have contributed to the success of this project. It’s been an honor for me to working under supervision of such a great person like her.
iv
ABSTRACT
v
ABSTRAK
Kertas kerja ini mengkaji tentang pengaliran halaju udara di dalam ruang
vi
CONTENT
CHAPTER SUBJECT PAGE
ABSTRACK ii
CONTENT iii
CHAPTER 1 INTRODUCTION 1
1.0 Background 1
2.1.1 Conduction heat transfer 6
2.1.2 Convection heat transfer 6
2.2 Air velocity 7
2.2.1 Air flows 9
2.3 Temperature measurement 10
2.4 Simulation 12
2.4.1 Basic assumption 12
vii
CHAPTER SUBJECT PAGE
2.4.2.1 Overall computational domain 14
2.4.2.2 PCB’s representation 15
2.5 Results and discussions 15
2.5.1Temperature and velocity distribution 16
2.5.2 Heat transfer effect 17
CHAPTER 3 METHODOLOGY
3.2 Simulation using Computational Fluid Dynamics 23 3.2.1 Introduction to CFX-Mesh Simulation 23
3.3.2ANSYS CFX simulation process 28
3.3.2.1 CAD model preparation 28
3.3.2.2 Mesh generation 29
3.3.2.3 Pre processing 32
3.3.2.4 Solver stage 35
viii
CHAPTER SUBJECT PAGE
CHAPTER 4 RESULT AND DISCUSSION 38
4.0 Introduction 38
4.1 Experiment Result 40
4.2 Simulation Result 41
4.3 Discussion 47
CHAPTER 5 CONCLUSION AND RECOMMENDATION 49
5.0 Conclusion 49
5.1 Suggestion and recommendation 50
REFERENCE 51
ix
LIST OF TABLE
NO. TITLE PAGE
4.1 Average temperature from experiment 40
4.2 Average velocity from experiment 41
x
LIST OF FIGURE
NO TITLE PAGE
2.1 Determination of actual flow 8
2.2 Layout of major chassis component around CPU 9
2.3 Thermocouple location 11
2.4 Layout of system CFD analysis model 13
2.5 Comparison of data between present calculation and previous study 16
2.6 Velocity distribution 16
2.7 The local Nusselt Number of CPU in different mode 17
3.1 Methodology flow chart 19
3.2 Chassis Layout 20
3.3 Thermocouple 21
xi
3.5 CFX-5 simulation steps 26
3.6 Experimental set up 27
3.7 experimental set up 27
3.8 CAD model 28
3.9 Meshing model 30
3.10 Meshing model 31
3.11 Location of outlet and inlet 33
3.12 Velocity profile 34
3.13 Convergence graph 36
4.1 Chassis model 39
4.2 Temperature contour 42
4.3 Velocity vector 43
4.5 Velocity streamlines 45
1
CHAPTER I
INTRODUCTION
1.0 Background
The central processor unit (CPU) is an important component in a computer system. A lot of small components are located inside the CPU such as the motherboard, heat sinks, circuit boards etc. These components generate heat, so they must be cooled to make sure their temperature does not reach the maximum allowable temperature value. Typical limiting CPU case temperature are in the range of 70 to 85 °C but it is depends on the different CPU types.
The CPU is cooled using heat sinks which operate by carrying the heat either by convection or radiation. Heat sinks must have good heat conduction properties such as aluminium or copper, and placed near to the heat sources. The heat sink has metal fins of thin cross sections to increase the area for heat dissipation. A motor driven fan may also be placed on top so that it draws the hot air away faster than natural convection.
2
The inlet air will first pass through the thermal module and removes the heat generated by the CPU, then flows to the heat sink and removes the heat generated by the CPU chipsets. Finally the air will flows into the power supply and removes the heat generated by power supply.
1.1 Objective of the research
The objectives of this research are:
a) To develop a simulation of air flow inside the CPU chassis based on practical measurement,
b) Compare experimentally and simulation for the velocity at the outlet vent of the chassis.
1.2 Problem statement
Newer computers come with larger memory and faster speed due to the customer needs. The increase of the speed, processor and memory will consume more power and raise the temperature inside the system. Overheating of CPU components will affect the stability, speed and performance of the computer.
3
1.3 Scopes of the Study
The scopes of this research are:
a) Gather experiment data for input and validation of CFD simulation b) Generate CAD drawing of computer hardware
c) Simulate thermal cooling of computer hardware and compare with collected experimental data.
d) Investigate effect of different turbulent model available in CFX.
1.4 Limitations
The research has been limited to:
a) The desktop computer that have been used consist of Cooler Master Wave Server Chassis, P5W deluxe Asus Motherboard and Intel core2duo E6600 processor b) Several assumptions have been made in the simulations such as the internal
components are represents as lumped object. The turbulent air flows were assumed. No buoyancy effect and no solid conduction included.
1.5 Expected Outcomes
During project researching and analyzing, the expected outcomes are:-
4
1.6 Project organization
5
CHAPTER II
LITERATURE REVIEW
2.0 Introduction
Literature review is based on term on related topic that was studied and has been discussed by a professional and has given a complete explanation on how the things of study work out. From research, there are several journals that related with this research.
The previous efforts to simulate three dimensional modeling computational modeling of air cooled desktop computer can be found in several publications. J.S. Chiang, S.H. Chuang and Y.K. Wu in their journal had done numerical simulation of heat transfer in a desktop computer with heat generating component. J.Y. Chang and C.W. Yu works on identification and simulation of minimum air flow design for desktop computer
6
2.1 Heat transfer
The heat transfer method in this research will be heat transfer primarily by convection. Several components and printed circuit board (PCB) inside the chassis that generate heat transfer heat by conduction. Since the components inside the chassis was assumed as a lumped object, heat transfer by conduction is neglected. Therefore only heat transfer from the components to the air, that is convection, is considered.
The air inside the enclosure flows through the inlet and exhaust fans. Therefore the heat transfer in both the inlet and outlet boundaries are considered as forced convection. So, the buoyancy will also be neglected.
2.1.1 Conduction heat transfer
Heat transfer by conduction can be defined as the energy transfer from the high temperature region to the low temperature region when a temperature gradient exists in a body.
q @kAA.
Where; q = The heat transfer rate
A
T
+A
x
= The temperature gradient in the direction of the heat flow2.1.2 Convection heat transfer
7
The temperature of solid due to an external field such as fluid buoyancy can induce a fluid motion. This is known as natural convection and it’s a strong function of the temperature difference between the solid and the fluid. Blowing air over the solid by using external devices such as fans can also generate a fluid motion. This is known as force convection
In this research, several components inside the chassis will have the heat transfer by conduction. The heat transfer from the components to the air can be defining as convection heat transfer. Since the focus of this research is to predict air flow and temperature, no solid conduction was solved.
2.2 Air velocity
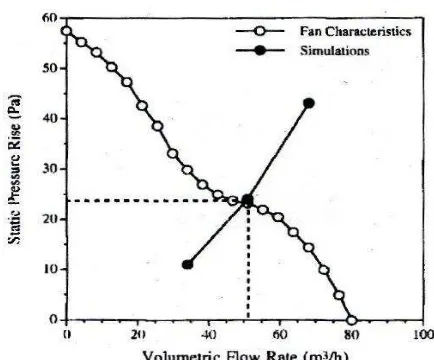
The actual air flow rate delivered from the fans was unknown and controlled by the flow impedance of the enclosure. To estimate the actual air flow rate, it is necessary to adjust the flow rate to correspond to the predicted pressure rise across a fan to match the given fan characteristic (provide by manufacturer).
8
Figure 2.1 Determination of actual flow rate at fan (Source: T.Y. Tom Lee (1994))
In this research, the inlet air velocity will be measured using air velocity meter. This is more accurate than estimating the average using method above.
The other way to used the hydraulic characteristic curve as shown in figure 2.1 is by using the equation of the form
PK u
2 2 ,
f g
Where; ∆P = pressure different ρ= inlet air density u= inlet air velocity
9
2.2.1 Air flows
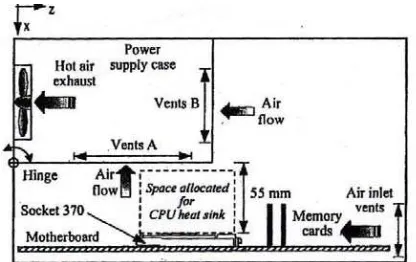
Figure 2.2 layout of major chassis component around CPU (View from the bottom of the chassis)
(Source: J.Y. Chang (2000))
The figure above shows the flows of the air in the chassis. Air velocity and the pressure drop will be measure at the inlet vents and at fans. In actual system operation, the fan speed is controlled by a temperature sensor in the power supply case. This reduces air flow and fan noise when the system is not fully loaded. During actual system operation, the fan speed operated at 3300 to 3500 rpm. The account for fan speed variation on the fan curve, the following fan laws were used
P1P2 n1 rotation will be obtain using hydraulic characteristic curve as shown in figure 2.2. The
10
2.3 Temperature measurement
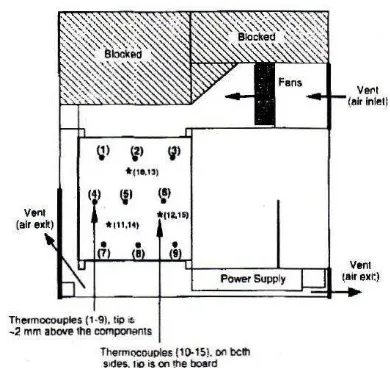
The temperature in the chassis and at the selected location will be measured. During the experiment, several T-type (cooper-constantan) thermocouples (with ±0.1°C uncertainty) were attached along the component side of the powered PCB. The front ends of this thermocouple were titled normal to the PCB, and the tips were positioned in the air approximately 2 mm above the components.
From these several thermocouples, air temperatures between boards were measured. Experiments were run to estimate the proportion of heat dissipated through the noncomponent side of the board. This was done by measuring board temperatures on the both sides and then calculating the conduction heat loss through the board. Board temperatures were measured by additional T-type thermocouples that were positioned on both sides of the powered PCB. The tips of the thermocouples were bounded against the board by the high-conductivity epoxy. The locations of these thermocouples on the PCB are shown in figure 2.2.
11
Figure 2.3 thermocouples location (Source: T.Y. Tom Lee (1994))
The temperature of the CPU chipsets was measure to determined the heat dissipated by the component. A thermocouple was installed in a machined groove into the copper case. A 4mm square groove was machined up to the center of the copper case. A stainless steel sheathed J-type thermocouple (0.25mm diameter) was placed into the grooved and the gap was filled with thermally conductive epoxy to make it flush with the CPU case surface.
12
2.4 Simulation
CFD program PHOENICS was used to simulate the thermal behavior inside an enclosure. This program is base on structured mesh and finite volume formulation to discretize the Navier-Stroke equations.
The grid distributions are non-uniform and refines in the vicinity of high power components. Three components of Navier-Stroke equations, energy equation, turbulent kinematics energy equation ` a and turbulent energy dissipation rate ` a equation are coupled and solved together.
2.4.1 Basic assumption