Description of bone mineral density in postmenopausal women at
Immunoendocrinology Integrated Laboratory, Faculty of Medicine
University of Indonesia
D.S. Wibisono, A. Baziad
Abstrak
Untuk mengetahui pola densitas mineral tulang pada wanita pasca menopause dilakukan penelitian secara retrospektif terhadap 40 wanita pasca menopause dengan menggunakan alat Dexa pada tulang L2– L4. Didapatkan hasil dengan akurasi formula survey 15%:
rerata usia menopause 53,25 tahun, 30 % densitas mineral tulang normal, 52,5 % osteopenia & 17,5 % osteoporosis. Pada penelitian ini juga didapatkan ada hubungan yang kuat ( r = 0,547 ) & sangat bermakna ( p = 0,000 ) antara tinggi badan dengan densitas mineral tulang, didapatkan hubungan yang cukup ( r = 0,315 ) & bermakna ( p = 0,047 ) antara berat badan dengan densitas mineral tulang, demikian pula hubungan yang cukup ( r = - 0,301 ) & bermakna ( p = 0,059 ) antara lama menopause dengan densitas mineral tulang, serta tidak didapatkan hubungan antara usia ( r = 0,119 ) maupun Indeks Masa Tubuh ( IMT ) ( r = 0,086 ) dengan densitas mineral tulang. (Med J Indones 2004; 13: 31-9)
Abstract
To identify the pattern of bone mineral density in postmenopausal women through retrospective study in 40 postmenopausal women using Dexa instrument in bones (L2 - L4). Results with 15% of survey formula accuracy were found: mean of menopausal age was 53.25 years, normal bone mineral density 30%, osteopenia 52.5%, and osteoporosis 17.5%. A very strong relationship (r=0.547) and a significant relationship (p=0.000) between body height and bone mineral density were found in this study, and there was a moderate (r=0.315) and significant (p= 0.047) relationship between body weight and bone mineral density, and likewise there was a moderate (r=-0.301) and significant (p=0.059) relationship between duration of menopause and bone mineral density. By contrast, no relationship was found between age (r=0.119) and Body Mass Index (BMI) (r=0.086) and bone mineral density. (Med J Indones 2004; 13: 31-9)
Keywords: Duration of menopause, menopause age, body height, body weight, body mass index, and bone mass density.
It was estimated that by the year 2000, life expectancy rate of Indonesian women reached 67.5 years, and the group of elderly people reached 8.2% of all
Indonesian population.1
Physiologically, estrogen begins to decrease at the age of 40 years and is at the lowest level at the age of 53 years. The decrease of estrogen will result in the decrease of osteoblast activity and form type I collagen. Bone formation decreases physiologically, and the changes in the remodeling balance of the
bone to bone resorption will occur.1
Estrogen triggers osteoblast activity and bone formation occurs, and when estrogen decreases bone deformation will occur leading eventually to bone fragility. This condition will result in the post-menopausal disorder of osteoporosis at the risk of bone fractures.
Data from the US showed that of 25 million people of the US population suffering from osteoporosis, 80 % were women among whom 1.5 million people experienced fractures each year and 0.5 million people had thoracal and lumbal vertebral fractures which frequently resulted in deformity and hunched
posture.2
World Health Organization (WHO) defines osteoporosis as a disease characterized by the decrease of bone mass and bone micro-architecture damage, a condition
which will contribute to bone fragility resulting in the
increased risk of bone fractures.2,4,10,11
According to WHO, osteoporosis occurs when bone mineral density (BMD) is greater than 2.5 of Standard
Deviation under the mean of young adult.4
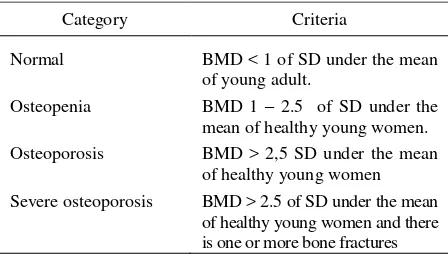
Table 1. WHO: Criteria of Osteoporosis in Women4,7,11
Category Criteria
Normal
Osteopenia
Osteoporosis
Severe osteoporosis
BMD < 1 of SD under the mean of young adult.
BMD 1 – 2.5 of SD under the mean of healthy young women. BMD > 2,5 SD under the mean of healthy young women BMD > 2.5 of SD under the mean of healthy young women and there is one or more bone fractures
The objective of this study is to identify the pattern of bone mineral density in post-menopausal women and specifically to assess the presence or absence of the relationship between body height, body weight, age and duration of menopause with bone mineral density
METHODS
This retrospective analytical study was conducted at Immuno-endocrinology Integrated Makmal Laboratory - Faculty of Medicine University of Indonesia, on the basis of the medical records of Immuno-endocrinology Integrated Makmal Laboratory - Faculty of Medicine University of Indonesia from November 1, 2001 to November 30, 2001.
Post-menopausal women undergoing bone density
using Dexa instrument in bones L2 - L4 were included
in this study. Statistical analysis was performed with SPSS using one sample statistics, paired sample
correlation and coefficient relationships were
considered significant if p<0,05.
Operational definition
Bone mineral density (BMD) is the amount of mineral (gram) per centimeter of bone quadrate, obtained from the measurement with Lunar DPX dual energy X-ray Densitometry (Lunar Corporation, Madison, Wisconsin, USA).
WHO Criteria Normal :
BMD < - 1 SD of the mean of young adult Osteopenia :
BMD - 1 SD – - 2.5 of DS of the mean of young women
Osteoporosis :
BMD > - 2.5 SD under the mean of young women T Score :
What is SD above and under BMD at young age Z Score :
Patient’s BMD was compared with her age and gender in SD
Menopause is :
The last menstruation which is still controlled by the function of ovarian hormone.
Post-menopause is :
Ammenorrhea in 12 months after menopause characterized by high level of LH and FSH, and low
level of estrogen and progesterone.9
RESULTS
The study was conducted retrospectively in 40 menopausal patients, and the results found are presented in Table 2.
Table 2. Clinical characteristics of studied cases
Characteristics Mean Standard Deviation Age (year) 53.25 3.48 Body height (cm) 154.98 5.08 Body weight (Kg) 60.10 9.43 Menopause (Year) 3.95 2.43 BMD 0.94782 0.12140 T-Score - 1.43 1.01 Z-Score - 0.91 2.39 Body Mass Index 24.9950 3.5266 (BMI= BW/BH2, Kg/Cm2)
Table 2 shows that mean post-menopausal patients’
ages was 53.25 years in which the youngest age was 47 years and the oldest 62 years.
Patients’ body height has a range of 145 cm to 166 cm
and mean body height was 154.98 cm. Range of patients’ body weight was between 40 kg and 83 kg with a mean of 60.10 kg. Duration of menopause started from 1 year to 10 years after menopause with a mean of 3.95 years.
5% 7.50%
5% 20.00%
37.50%
10%
0% 2.50%
2.50% 5% 5%
0%
0% 5% 10% 15% 20% 25% 30% 35% 40%
45-50 51-55 56-60 61-65
Normal Osteopenia Osteoporosis
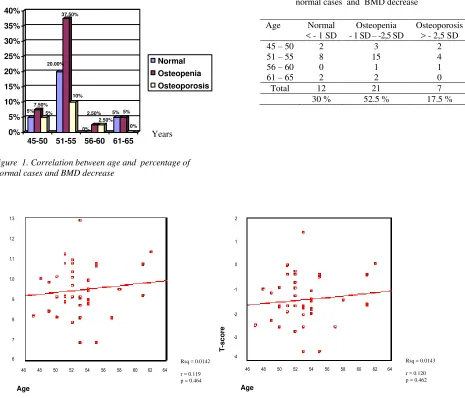
Table 3 shows that there were 12 patients (30 % ) with normal bone mineral density, 21 patients (52.5% with osteopenia and 7 pateints (17.5%) with osteoporosis such that there were 70% of patients experiencing bone mineral density decrease lower than 1 SD.
Figure 1 shows that the highest frequencies of osteopenia (37.5%) and osteoporosis (10%) were
found at the age of 51-55 years. . It is evident from Figures 2 and 3 that BMD and T-Score were determined by age factor at 1% (Rsq =0.0142 and 0.0143).
Figures 2 and 3 also demonstrate a weak relationship between age and BMD (r=0.119) and age and T-Score (r = 0.120), and both relationships were not significant (p > 0.05).
Age Normal < - 1 SD
Osteopenia - 1 SD – -2,5 SD
Osteoporosis > - 2,5 SD 45 – 50 2 3 2 51 – 55 8 15 4 56 – 60 0 1 1 61 – 65 2 2 0 Total 12 21 7
30 % 52.5 % 17.5 %
Figure 1. Correlation between age and percentage of normal cases and BMD decrease
Table 3. Correlation between age and number of normal cases and BMD decrease
Rsq = 0.0142
r = 0.119 p = 0.464
Rsq = 0.0143
r = 0.120 p = 0.462
Figure 2. Correlation between age and BMD Figure 3. Correlation between age and T-Score
Years
BM
D
T
-s
c
o
re
1.3
1.2
1.1
1.0
9
8
7
6
46 48 50 52 54 56 58 60 62 64
Age
46 48 50 52 54 56 58 60 62 64
Age
2
1
0
-1
-2
-3
0 1 2 3 4 5 6 7 8
141-145
146-150
151-155
156-160
161-165
166-170
Body height (cm)
Normal Osteopenia Osteoporosis
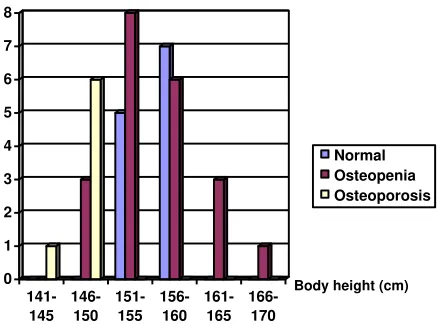
In the correlation between body height and T-Score, it appears that osteopenia had the highest frequency in body height of 151-155 cm, while osteoporosis occurred most frequently in body height of 146-150 cm, and the higher the body weight the lower the incidence rate of osteopenia. (Figure 4 and Table 4 ).
Figures 5 and 6 demonstrate a strong correlation (r = 0,547) between body height and bone mineral density,
and this correlation was very significant (p<0.01). Likewise, there was a strong correlation between body height and T-Score.( r = 0.546 ) and ( p < 0.01 ).
From Figures 5 and 6, it is evident that bone mineral density and T-Score were determined by body height by 29% ( Rsq = 0.2990 and 0.2995 ).
Body Height
Normal < - 1 SD
Osteopenia - 1 SD – -2,5 SD
Osteoporosis > - 2,5 SD
141-145 0 0 1
146-150 0 3 6
151-155 5 8 0
156-160 7 6 0
161-165 0 3 0
166-170 0 1 0
Total 12 21 7
Table 4. Correlation between Body Height and number of normal cases and BMD decrease
Rsq = 0.2990
r = 0.547 p = 0.000
Rsq = 0.2985
r = 0.546 p = 0.000
Figure 5. Correlation between body height and BMD Figure 6. Correlation between body height and T-Score Figure 4. Correlation between body height and number
of normal cases and BMD decrease
BM
D T-s
c
o
re
1.3
1.2
1.1
1.0
9
8
7
6
2
1
0
-1
-2
-3
-4
140 150 160 170
Body Height (cm)
140 150 160 170
2.50%
0%0%0%0%0% 5%
2.50% 5%
0% 17.50%
5%
2.50% 15%
5%
2.50% 5%
0% 10%
5%
0%
5% 5%
3%
0% 2.50%
0% 2.50%
0% 0%
0.00% 2.00% 4.00% 6.00% 8.00% 10.00% 12.00% 14.00% 16.00% 18.00%
36-40 41-45 46-50 51-55 56-60 61-65 66-70 71-75 76-80 81-85
Body weight (kg)
Normal Osteopenia Osteoporosis
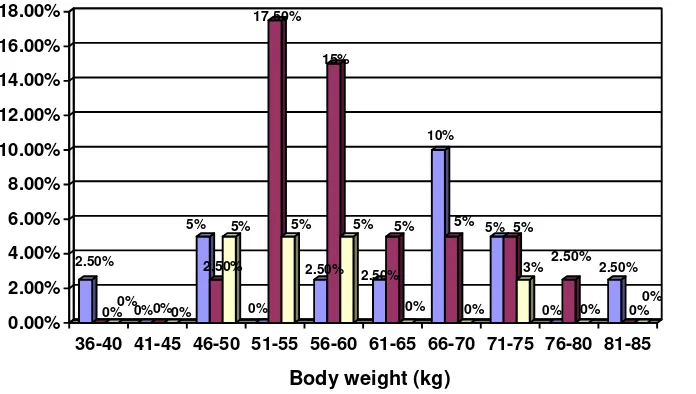
The correlation between body weight and T-Score is evident in Figure 7. Osteopenia had the highest frequency in body weight of 51-55 kg (17.5%) and body weight of 56-60 kg (15%), while osteoporosis occurred most frequently in body weight of 46-50 kg, 51-55 kg and 56-60 kg (each was 5% respectively).
On statistical analysis, a moderate (r=0.315) and significant (p<0.05) correlation was found between body weight and body mineral density (Figure 8).
Likewise, there was a moderate (r=0.315) and significant (p<0.05) correlation between body weight and T-Score.
From Figures 8 and 9 it is evident that body mineral density and T-Score were determine by body weight factor by 9%. ( Rsq = 0,0995 & 0,0991 ).
Figure 7. Correlation between body weight and percentage of normal cases and BMD decrease
Rsq = 0.0995
r = 0,315 p = 0,047
Rsq = 0.0991
r = 0,315 p = 0,048
Figure 8. Correlation between body weight and - BMD Figure 9. Correlation between body weight – T-Score
BM
D
T
-s
c
o
re
1.3
1.2
1.1
1.0
9
8
7
6
2
1
0
-1
-2
-3
-4 30 40 50 60 70 80 90
Body Weight (kg)
30 40 50 60 70 80 90
menopause correlation was found between duration of menopause and bone mineral density (R=-0.301); however, this relationship was not significant (p>0.05) (Figure 11). Likewise, there was a moderate correlation between duration of menopause and T-Score (r=-0.301), yet
this relationship was not significant as well (p>0.05) (Figure 12).
From Figures 11 and 12 it is evident that body mineral density and T-Score were determined by duration of menopause factor by 9% (Rsq= 0.0904 and 0.0903). By controlling other variant factors affecting body mineral density, it proved that the relationship between duration of menopause and body mineral density was significant (p=0.040) (<0.05). (See Table 5).
menopause
Figure 10. Correlation between duration of menopause and percentage of normal cases and BMD decrease
Rsq = 0.0904
Figure 11. Correlation between duration of menopause and BMD
Figure 12. Correlation between duration of menopause and T-Score
B
MD
0 2 4 6 8 10 12 14 16
E Cases
(1-5) (6-10) (11-15) (16-20) (21-25) (26-30) (31-35)IMT
Normal Osteopenia Osteoporosis
Table 5. Multiple regression statistical analysis
Model
Non-standardized coefficients
Standardized coefficient
t p
B Std. Error Beta
1 (Constant) -2.047 1.118 -1.831 .075 menopause -.141 .066 -.338 -2.128 .040 BMI 4.675 4.551 .163 1.027 .311
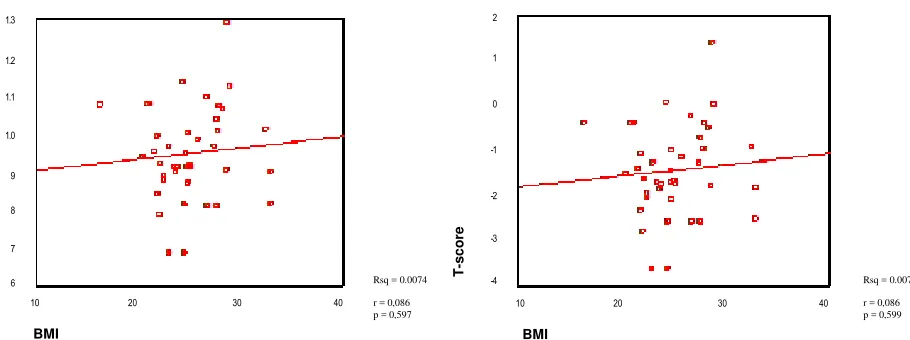
In the correlation between Body Mass Index and T-Score, it was found that the highest incidence rate of osteopenia and osteoporosis occurred in Body Mass Index between 21-25 (Figure 13). On statistical
analysis, it shows that the relationship of Body Mass Index and body mineral density and T-Score was weak (r=0.086 and r=0.086) and not significant (p=0.597 and p=0.599) (>0.05).
a. Dependent variables : T-Score
Figure 13. Correlation between BMI and number of normal cases and BMD decrease
Rsq = 0.0074
r = 0,086 p = 0,597
Rsq = 0.0074
r = 0,086 p = 0,599
Figure 14. Correlation between BMI (Body Mass Index) and BMD
Figure 15. Correlation between BMI (Body Mass Index) and T-Score
BM
D
1.3
1.2
1.1
1.0
9
8
7
6
10 20 30 40
BMI
T
-s
c
o
re
10 20 30 40
BMI
2
1
0
-1
-2
-3
DISCUSSION
Of 40 post-menopausal patients with duration of menopause of 1 year to 10 years, it was found that mean menopausal age was 53.25 years. This finding was not different from the results of the previous
studies1,2. Of these 40 patients, 30% of patients had
normal bone mineral density, 52.5% had osteopenia and 17.5% had osteoporosis. At first glimpse, these results would show a strong and significant relation-ship between estrogen deficiency (menopause) and the decrease of bone mineral density. However, in further examination the relationship between duration of menopause and bone mineral density proved moderate (r=-0.301) and not significant (p=0.059), as presented in Figures 11 and 12.
As known, estrogen produced during the reproduction period plays a role in the formation of bone cells and inhibits the resorption of bone cells in the remodeling
process of the bone.1,2,3,5,6,8,13,14
In entering menopausal age in which there is a estrogen deficiency, it is understandable that a decrease of mineral bone density will occur in accordance with the duration of menopause. Nevertheless, in this study this correlation was not significant (p>0.05). This may be due to the fact that bone mineral density after menopause is determined not only by ovarian estrogen deficiency, but also by extra-ovarian estrogen such as fat and adrenal, as well as dietary food commonly consumed by Indonesian people and Asians in general, such as soybean cake (tempe), tofu, and soybean which can maintain and even enhance bone mineral density
after menopause.12 In addition, physical activities and
genetic factor may affect bone mineral density.13,14
Such foods contain a great deal of phytoestrogen (Isoflavon) which may increase bone mass density in
the lumbal region, but not in other skeletal region.12
Another phytoestrogen, i.e. Daedzein is able to inhibit
osteoclast activation.12 Geinstein is also able to
increase IGF in vitro, i.e., a cytokine which causes
osteoclast apoptosis.12.
In further study with statistical analysis of the 40 patients by controlling other variant factors affecting bone mineral density, it proved that duration of menopause has a significant correlation with bone mineral density (p=0.04). The difference in significance may be attributed to the fact that this study was retrospective in which the variants were not controlled.
The study on age and bone mineral density showed a weak (r=0.119) and insignificant (p=0.464) relationship. In fact, it has been understood that the peak of bone mass formation in women occurs at the age of 30 years, and after that a decrease in bone mineral
density of 0.5 – 1% per year will follow2,8 and this
decrease is even more noticeable when a woman enters menopausal age in which an estrogen deficiency
(ovarian estrogen is not produced any longer) of 2 –
3% per year will occur.2,8
However, menopausal age varies from woman to woman such that the results of this study showed a weak and insignificant correlation between woman age and bone mineral density. This result is evident 17.5% osteoporosis after reaching menopausal age (Table 3), as if there was a correlation between age and bone mineral density. The highest frequency of osteopenia (37.5%) and osteoporosis (10%) occurred
in the age range of 51 – 55 years. In terms of the
relationship of body mass index (BMI) and bone mineral density (T-Score), the highest frequency was found in BMI of 21 - 25, i.e., osteopenia in 16 cases and osteoporosis in 4 cases (Figure 13).
It also evident that in BMI > 25 (obesity), there was a tendency of decreased frequency of osteopenia and osteoporosis. This finding was in accordance with the condition of obese people who produce extra ovarian estrogen, such that bone mass density can still be maintained.
On statistical analysis, there was a weak (r= 0.086) and insignificant (p>0.05) relationship between BMI and bone mineral density and T-Score (Figures 14 and 15). This may be due to the fact that this study was retrospective and the number of cases was less. The accuracy value in this study according to the survey formula was only 15 % (d=0.15495).
In this study, there was a strong (r = 0.547) and very significant (p <0.01) relationship between body height and bone mineral density in post-menopausal women (Figures 5 and 6). Figure 4 shows that the higher the
patient’s body, the lower the incidence rate of
osteopenia and osteoporosis, as explained by the load
weightier the load received by the bones, such that bone mass formation during premenopause at the
peak period with appropriate nutrition2 may be a
saving for post-menopause.1,2,3,14,15,16 This condition
will provide concrete results in female workers with
high posture and abundant physical activities.1,2
The study on body weight and bone mineral density in post-menopausal women also demonstrated a moderate (r = 0.315) and significant (p < 0.05) correlation. Likewise, there was strong ( r = 3.15) and significant (p <0.05) relationship between body weight and T-Score (Figures 8 and 9).
Several literatures13,14,15,16 demonstrated that extra
ovarian estrogens such as fat, liver, and kidney are able to change androgen to estrogen through aromatization, and this can affect bone mineral density in post-menopausal women. In obese women, such changes were greater than in slim women, such that the incidence rate of osteoporosis in obese women
after menopause was lower than in slim woman16. This
finding was evident in Figure 7, in which the greater the patient’s body weight, the lower the incidence rate of osteopenia and osteoporosis. The high incidence rate of osteopenia occurred in body weight of 51- 60 kg (22.5%), while that of osteoporosis occurred in body weight of 46 -60 kg (15%).
CONCLUSIONS AND RECOMMENDATION
Conclusions:
With survey formula accuracy of 15%, it was found that:
1. Mean menopausal age was 53.25 years
2. The incidence of bone mineral density (BMD)
> -1 SD between 1 year and 10 years after menopause was 70%, i.e. 52.5% osteopenia and 17.5% osteoporosis.
3. There was a strong correlation and very significant
between body height and bone mineral density (BMD).
4. There was a moderate and significant correlation
between body weight and bone mineral density (BMD).
5. There was a moderate and significant correlation
between duration of menopause and bone mineral density (BMD), after other variant factors were controlled.
6. No correlation (weak correlation) was found
between age or body mass index (BMI) and bone mineral density (BMD).
Recommendation:
A similar study with a greater number of cases and a more selective and multicenter study throughout Indonesia should be conducted.
REFERENCES
1. Rachman IA. Paparan sinar ultraviolet Beta terhadap remodeling tulang : studi eksperimen pada macaca fascicularis yang hipoestrogenik, (disertasi) Jakarta FKUI, 1999: 1-46. 2. Soewarno S. Pengaruh senam pencegahan osteoporosis
terhadap kepadatan mineral tulang pada perempuan usia 25-35 tahun, (tesis). Jakarta FKUI, 2001: 43-84.
3. Bongguk R. Pengaruh Depot Medroksi Progesteron Asetat, Estradiol Cypionat dan kalsium pada densitas tulang pasca oophorektomi bilateral, (tesis). Jakarta FKUI, 1998: 4-15. 4. Product monographi. Allovel. The first Priority for
Osteoporosis Prevention and Treatment, 2000: 1-14. 5. Winarno B. Densitas Mineral Tulang Wanita Menyusui,
(tesis). Jakarta FKUI, 1998: 4-17.
6. Santoso B. Manfaat Raloksifen terhadap perubahan Densitas Mineral Tulang lumbal pada wanita pasca menopause, (tesis) Jakarta FKUI, 2001:6-16.
7. Setyohadi B.The Role of Calcium and vitamin D on Bone metabolism dalam : Simposium Advance Management of Osteoporosis : Prevention, Treatment and Diagnosis. Perosi. Jakarta. Menara Peninsula Hotel, 2001: 12-16. 8. Dharmasetiawan MS. Peranan Pengobatan Hormonal
Pengganti Pada Massa Klimakterium. RSPAD Gatot Subroto, Jakarta, 1996: 1-16.
9. Baziad A, Hestiantora A, Rachman IA. Pengobatan & Pencegahan Osteoporosis dengan Terapi Hormon Pengganti pada Wanita Menopause. Dalam: Panduan Menopause. Ed.I.POGI, PERMI. Jakarta 1997: 44-51.
10. Kanis JA, Devogelaer J-P, Gennari C. Bone Density measurement in the assesment and treatment of osteoporosis : Practical Guidelines. European Foundation For Osteoporosis and bone disease (EFFO) Black Nell Healthcare Ltd. London.1997: 1-12.
11. Limpaphayom K. Osteoporosis: Background, Pathogenesis, Measurement of Bone Density, Prevention and Treatment. Dalam : First Consensus meeting on menopause in the East Asian Region Proceedings. Geneva 1997. 2nd
Ed.Medical Forum Internasional BV.1998: 81-94. 12. Pawitan J.A Phytoestrogens : Protection Against a wide Range
of Diseases, dalam : Medical progress. 2002: 29: 1: 9-13. 13. Christiansen C. Menopausal Osteoporosis : Impact of Sex
Steroid Replacement, dalam Reproductive Endocrinology, Surgery and Technology Vol.2 Lippincoff-Raven Publishers Philadelphia 1996 : 1825-1839
14. Speroff L, Glass RH, Kase NG. Menopause and The Perimenopausal Transition. Dalam: Clinical Endocrinologic and Infertility.6thed. Lippincott Williams & Wilkins.1999. Baltimore: 643-707.
15. Foster G.V. Osteoporosis. Dalam : Decision Making in Reproductive Endocrinology. Black Nell Scientific Publications. Oxford.1993 : 600-605.