Neither the whole work, nor any part of it, has been submitted to any university or other examining body. i). This dissertation has not been submitted for any degree or examination at any other university. iii). This dissertation does not contain other people's data, photographs, graphics or other information, unless specifically acknowledged as being sourced from other people.
This dissertation does not contain the writings of other persons, unless they are specifically acknowledged as originating from other researchers. This dissertation contains no text, graphics or tables copied and pasted from the Internet unless specifically acknowledged and the source is detailed in the dissertation and in the References sections. To the management and staff of Inkosi Albert Luthuli Central Hospital for allowing me to conduct this study at their institution.
For patients from the gynecological menopause clinic at Inkosi Albert Luthuli Central Hospital who participated in this study. BMD in postmenopausal African and Indian women 66 Figure 11: Correlation between weight and BMD of the lumbar spine.
ABSTRACT
1.1. INTRODUCTION
- THE CARDIOMETABOLIC PROFILE OF MENOPAUSE
- BONE HEALTH IN THE MENOPAUSE
- RELATIONSHIP BETWEEN CARDIOMETABOLIC PROFILE AND BONE MINERAL DENSITY
- MANAGEMENT OF THE MENOPAUSE .1 CARDIO-METABOLIC RISK
- BONE MINERAL DENSITY
Varma et al (2008) further showed that the prevalence of obstructive CAD (diagnosed on angiogram after chest pain) was greater in women with osteoporosis (74%) and osteopenia (66%) versus normal bone mineral density (45%). A single BMD test has high specificity (about 85%) in predicting fracture risk but lacks sensitivity (less than 50% of women with osteoporosis-related fractures have a BMD T score in the osteoporosis series) (Hough et al. ., 2010). Mendelsohn et al (1999) found that estrogen promotes vasodilation by downregulating the expression of angiotensin 2, and thereby the Renin Angiotensin System (RAS) and Endothelin 1.
Early evidence from Browner et al (1993) suggested an association between cardio-metabolic profile (which included atherosclerotic vascular disease, hypertension, dyslipidaemia and altered glucose metabolism) and low BMD. Marcovitz et al (2005) was the first study to report osteoporosis as a predictor of coronary artery disease (CAD) in the postmenopausal population, with low bone mineral density associated with significant CAD in women. Varma et al (2008) further showed that the prevalence of obstructive CAD (diagnosed on angiogram after chest pain) was greater in women with osteoporosis (74%) versus osteopenia (66%) versus normal bone mineral density (45%).
Bansel et al (1992) found that low calcium concentrations were associated with an upregulation of parathyroid hormone (PTH) and a parallel increase in tissue plasminogen activator (from osteoblasts). Finkelstein et al (2008) demonstrated that bone mineral density loss of the lumbar spine was accelerated in underweight postmenopausal women. Total plasma cholesterol is a major concern in the prevention of cardiovascular disease (De Backer et al., 2003).
Furthermore, the intima media ratio was significantly higher in the treated group (Sator et al., 1998).
THE STUDY: AIMS, METHODS AND STATISTICAL ANALYSIS
AIMS
All women attending the menopause clinic are assessed during the initial consultation and their demographic and clinical data are entered onto a primary assessment form. The results of biochemical and radiological research are entered unchanged on this form. Menopause was defined as amenorrhea of more than 6 months with a serum FSH > 30 IU/l or amenorrhea of more than 12 months.
African or Indian postmenopausal women over 40 years of age with confirmed menopause were included in the study. Women with premature ovarian insufficiency (in women <40 years), women in menopause, patients with a follicular stimulating hormone (FSH) level < 30 IU/l and women with reduced bone mineral density due to a pre-existing chronic disease were excluded of the research. The data analyzed included the presence of menopausal symptoms, a history of hypertension, diabetes, ischemic heart disease, hypercholesterolemia, decreased bone mineral density, or previous fragility fractures.
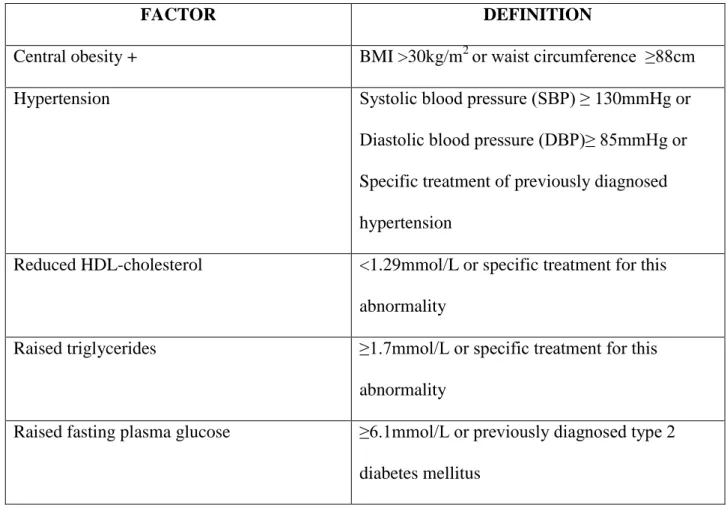
A past history of gestational diabetes, past pre-eclampsia and confirmed polycystic ovarian syndrome was assessed. Clinical data included systolic and diastolic blood pressure, height and weight, abdominal and hip circumference, calculated body mass index, calculated waist-to-hip ratio, clinical stigmata for dyslipidemia, and insulin resistance. Biochemical investigations included a fasting lipogram (cholesterol, triglycerides, HDL and LDL), fasting glucose and insulin levels and thyroid function tests.
Serum glucose was analyzed using the Hexokinase 2-step method, which produces a solution that absorbs ultraviolet light.
STATISTICAL ANALYSIS
RESULTS
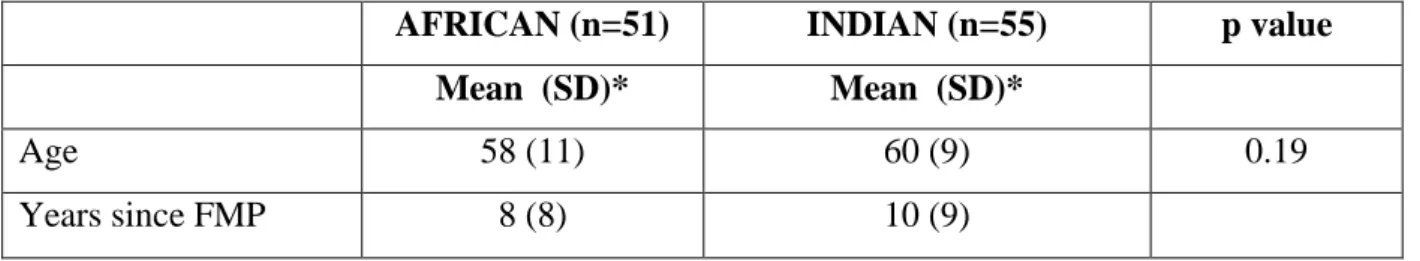
The average age of women after menopause was 60 years and 58 years for Indian and African women respectively. The median duration after FMP was 10 years for Indian women and 8 years for African women. There were no statistical differences between Indian and African women regarding age and duration after FMP.
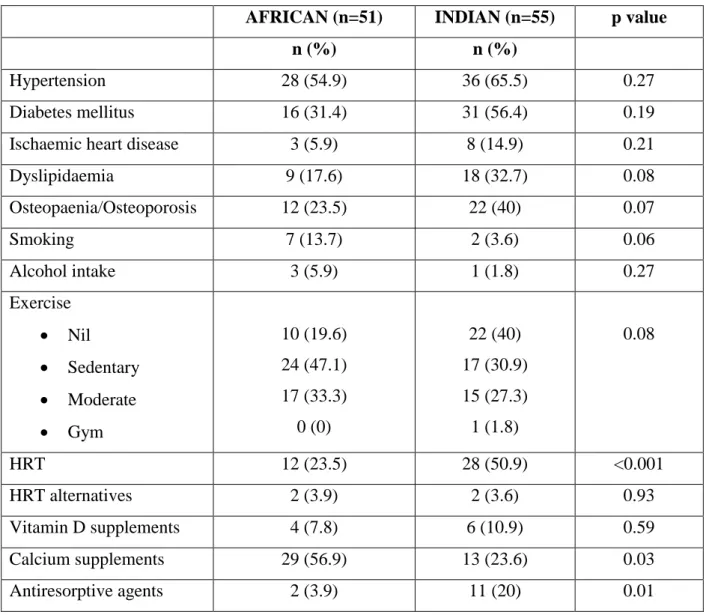
The presence of urogenital symptoms was reported in 54.9% of African women and 61.8% of Indian women. There were no statistical differences between African and Indian women regarding diet, lifestyle and social habits. Significantly more Indian women (20%) used anti-resorptive agents compared to African women (3.9%) while significantly more African women (56.9%) used calcium.
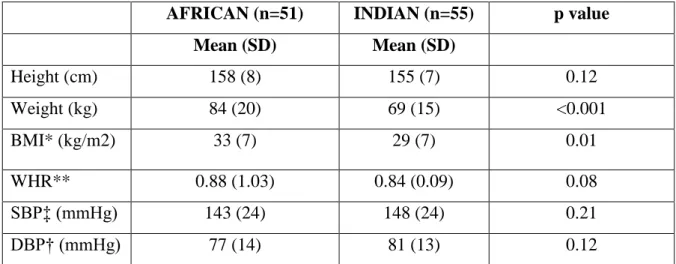
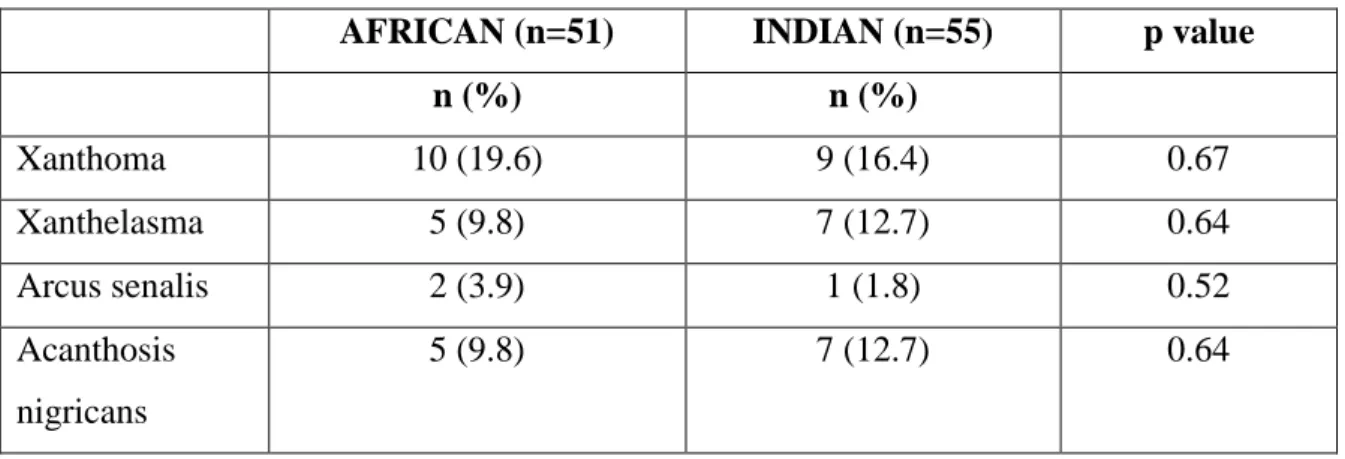
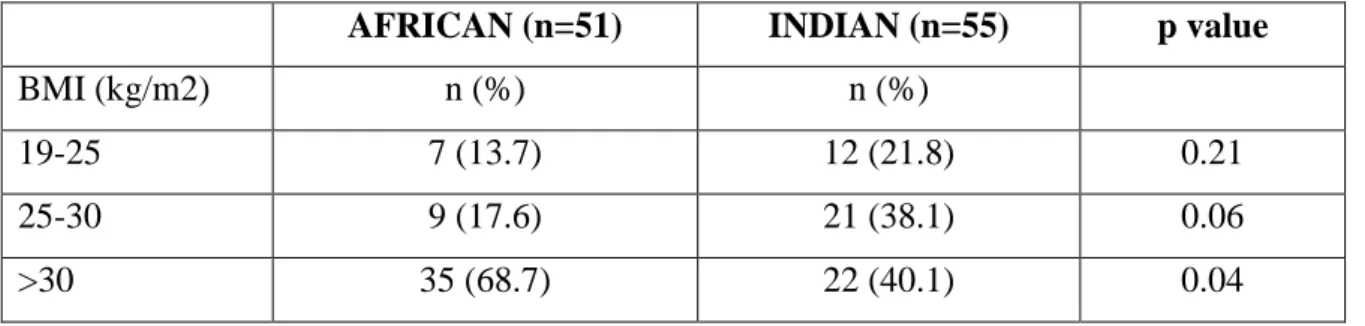
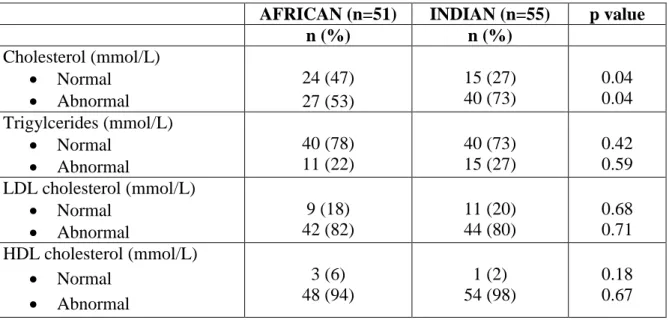
Tables 5 and 6 show the clinical profile of African and Indian women attending the IALCH Menopause Clinic. Weight and average body mass index (BMI) of African women were significantly higher in African women compared to Indian women, 86.3% of African women and 78.2%. There were no differences in height, WHR, SBP, DBP, clinical stigmata of dyslipidemia, or insulin resistance between postmenopausal African and Indian women.
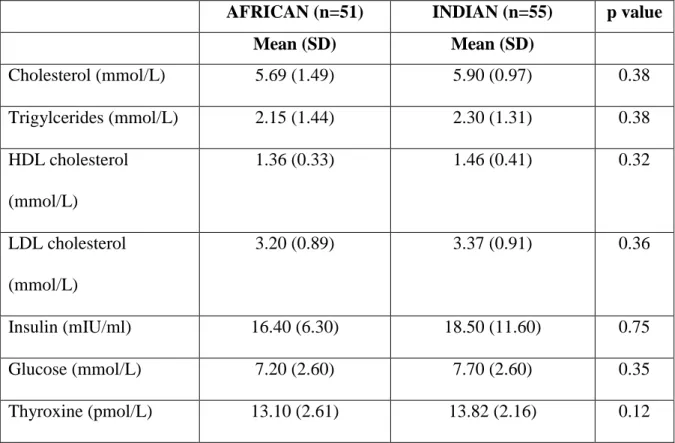
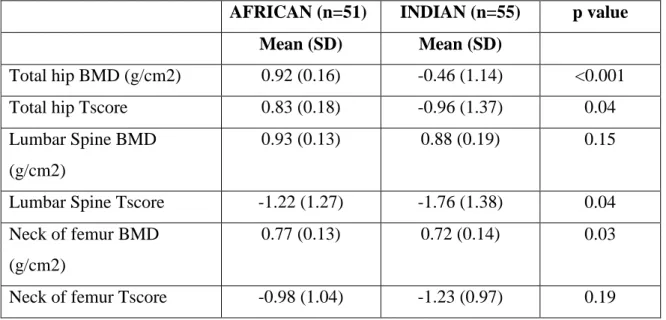
There were no statistically significant differences between African and Indian postmenopausal women with regard to the analyzed biochemical parameters. Most women had an abnormal lipid profile; 53% of African women and 73% of Indian women showed abnormal cholesterol, 22% of African women and 27% of Indian women had an abnormal triglyceride profile, 82% of African women and 80% of Indian women. Statistically significant differences in total hip BMD, total hip T-score, lumbar spine T-score and femoral neck MKG were demonstrated between African and Indian women.
African and Indian women when looking at T-scores at the hip, neck of femur and lumbar spine. When African and Indian women were analyzed separately (figures 8, 9, 11 and 12), Indian women showed stronger correlations between weight and BMD.
DISCUSSION
Among the African and Indian women in the study, there was a high prevalence of hypertension, diabetes, hypercholesterolemia, ischemic heart disease, and low bone mineral density. Sigurdsson et al (2008) assessed the influence of genetics on bone mineral density in North American Caucasians, African Americans and Hispanics. The study found that genetics among different ethnic groups is more important than environmental factors in the pathogenesis of low bone mineral density.
In a North American study examining the effect of genetics on bone mineral density in the African population, Sudanese immigrants were compared with Caucasian and Asian populations (Gong et al., 2006). There was also a positive association between weight and both lumbar spine and total hip bone mineral density (p<0.01). Ganry et al (2000) examined the association between alcohol consumption and bone mineral density in French women aged 75 years or older.
Bone mineral density of multiple skeletal areas and body composition were measured using dual X-ray absorptiometry. The study showed that consumption of small/moderate amounts of alcohol was associated with improved bone mineral density. Egger et al (1996) and Ilich et al (2002) examined the relationship between smoking and bone mineral density.
Our study showed a statistically significant inverse relationship between serum LDL cholesterol levels and lumbar spine bone mineral density (p=0.03). There was no statistically significant correlation between cholesterol, HDL cholesterol or triglycerides and bone mineral density in this study. The study showed a modest inverse relationship between body bone mineral density (lumbar spine and whole body) and total serum.
The study concluded that a pro-atherogenic lipid profile is associated with higher bone mineral density. An observational study by Bagger et al (2007) on 1176 Danish postmenopausal women examined the relationship between serum lipids and bone mineral density (Bagger et al., 2007). The true incidence of low BMD may be skewed by use of
CONCLUSION AND RECOMMENDATIONS
Locally, there are no clear guidelines for the screening and assessment of cardiovascular disease and low bone mineral density in menopause. We therefore recommend the development of screening and treatment protocols locally to aid in risk stratification and optimal management of the older women.
APPENDIX A TABLES AND FIGURES
A retrospective audit of the cardio-metabolic profile and bone mineral density in postmenopausal women attending Inkosi Albert Luthuli Central Hospital menopause clinic from 01 July 2009 to 31 December 2010.
APPENDIX C NORMAL VALUES
Low density lipo-protein (LDL ) Optimal: <2.6 mmol/L
High density lipo-protein( HDL) Favourable <1 mmol/L
Triglycerides (TCG) Normal <2.83mmol/L
Cholesterol
5.3 mmol/L
25 mIU/ml
T4 (thyroxine) : normal 11-22.7 pmol/L
TSH (thyroid stimulating hormone) normal 0.27-4.2mIU/L
APPENDIX D SCORE RISK CHART
APPENDIX E HOSPITAL APPROVAL
APPENDIX F
POSTGRADUATE APPROVAL
APPENDIX G ETHICAL APPROVAL